. 2018 Feb 5;39(4):233-251.
doi: 10.1002/jcc.25106. Epub 2017 Nov 14.

Implementation and performance of the artificial force induced reaction method in the GRRM17 program

Affiliations

Implementation and performance of the artificial force induced reaction method in the GRRM17 program

Satoshi Maeda et al. J Comput Chem. .

Abstract

This article reports implementation and performance of the artificial force induced reaction (AFIR) method in the upcoming 2017 version of GRRM program (GRRM17). The AFIR method, which is one of automated reaction path search methods, induces geometrical deformations in a system by pushing or pulling fragments defined in the system by an artificial force. In GRRM17, three different algorithms, that is, multicomponent algorithm (MC-AFIR), single-component algorithm (SC-AFIR), and double-sphere algorithm (DS-AFIR), are available, where the MC-AFIR was the only algorithm which has been available in the previous 2014 version. The MC-AFIR does automated sampling of reaction pathways between two or more reactant molecules. The SC-AFIR performs automated generation of global or semiglobal reaction path network. The DS-AFIR finds a single path between given two structures. Exploration of minimum energy structures within the hypersurface in which two different electronic states degenerate, and an interface with the quantum mechanics/molecular mechanics method, are also described. A code termed SAFIRE will also be available, as a visualization software for complicated reaction path networks. © 2017 The Authors. Journal of Computational Chemistry Published by Wiley Periodicals, Inc.

Keywords: QM/MM; intrinsic reaction coordinate; nonadiabatic transition; potential energy surface; transition state.


Figures

Scheme 1
Scheme 1
Fragment generation around carbon atoms with asterisk marks. [Color figure can be viewed at wileyonlinelibrary.com]
Figure 1
Figure 1
a) an elementary reaction step in Co‐catalyzed hydroformylation, b) the highest energy structures along AFIR and LUP paths, c) an energy profile along the IRC path and those along AFIR and LUP paths obtained through the searches with different γ (see text), d) all obtained EQs and TSs by the (restricted) SC‐AFIR search, where those obtained by the subsequent “RePATH” calculation are indicated by asterisk marks (see text). Relative Gibbs free energy (130°C, 1 atm) values and relative electronic energy values in parentheses are shown in kJ/mol below each structure. [Color figure can be viewed at wileyonlinelibrary.com]
Figure 2
Figure 2
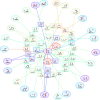
The global reaction path network of the atomic composition C4H6, where the part obtained by both the SC‐AFIR1 and SC‐AFIR2 searches are shown in blue, that obtained only in the SC‐AFIR1 search in green, and that obtained only in the SC‐AFIR2 search in red. Low and high energy regions are indicated by dark and light colors, respectively, where relative energy values in kJ/mol are shown below each EQ. EQs are indicated by ellipses in which the corresponding molecular structures are depicted. TSs and dissociated products are indicated by small open and filled circles, respectively. [Color figure can be viewed at wileyonlinelibrary.com]
Figure 3
Figure 3
The reaction path network around EQ0, a conformer of glycine molecule. Although the search found many other TSs and DCs that are not connected to EQ0, only those directly connected to EQ0 are depicted for simplicity. Relative energy is depicted according to the rainbow spectrum, where the lowest energy EQ is indicated by purple. Relative energy values in kJ/mol are shown below each structure. [Color figure can be viewed at wileyonlinelibrary.com]
Scheme 2
Scheme 2
Calculation flow of DS‐AFIR.
Figure 4
Figure 4
Six dissociation channels starting from EQ0, a conformer of glycine molecule. Relative energy values in kJ/mol are shown below each structure. [Color figure can be viewed at wileyonlinelibrary.com]
Figure 5
Figure 5
A random structure, the initial EQ obtained by optimizing the random structure, and the ten lowest energy EQs among 186 obtained by the EQ only search. Relative energy values in kJ/mol are shown below each structure. [Color figure can be viewed at wileyonlinelibrary.com]
Figure 6
Figure 6
The IRC path (thick black line) and six paths of different settings of eq. (6) on the Müller–Brown potential. The path indicated by circles was obtained by integrating the AFIR path of eq. (6) with δ = 300.0 and Y = 1.0 throughout. Paths indicated by inverse triangles and triangles facing sideways were obtained by integrating the AFIR path of eq. (6) with δ = 300.0 and Y = 0.0 throughout, starting from EQ1 and EQ2, respectively. Paths indicated by triangles, crosses, and squares are those obtained by integrating the AFIR path of eq. (6) with δ = 100.0, 300.0, and 500.0, respectively, and Y determined by eq. (9). [Color figure can be viewed at wileyonlinelibrary.com]
Figure 7
Figure 7
Energy profiles along the AFIR path obtained by applying DS‐AFIR to pentaprismane and [10]annulene and the LUP path obtained by optimizing the AFIR path. [Color figure can be viewed at wileyonlinelibrary.com]
Figure 8
Figure 8
The energy profile along IRC paths between pentaprismane and [10]annulene. [Color figure can be viewed at wileyonlinelibrary.com]
Figure 9
Figure 9
Structures of singlet 1 MIN, triplet 3 MIN, and quintet 5 MIN, and all obtained MESX structures by the GP/SC‐AFIR searches, for Fe(PMe3)4. MESXs for singlet‐triplet, singlet‐quintet, and triplet‐quintet pairs are denoted as 1/3A–D, 1/5A–C, 3/5A–H, respectively. Relative energy values in kJ/mol are shown below each structure. [Color figure can be viewed at wileyonlinelibrary.com]
Figure 10
Figure 10
Connections among lowest energy MESX structures, that is, 1/3A, 1/5A, and 3/5A in Figure 9, through meta‐IRC paths. [Color figure can be viewed at wileyonlinelibrary.com]
Figure 11
Figure 11
MECI structures for naphthalene obtained by the GP/SC‐AFIR search and TSs on S 1 linking the S 1MIN and the lowest lying three MECIs. Relative energy values in eV are shown below each structure. [Color figure can be viewed at wileyonlinelibrary.com]
Figure 12
Figure 12
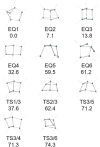
EQs and TSs obtained by the SC‐AFIR method combined with ONIOM and microiteration technique, starting from hexasilaprismane (EQ3). The six bulky 2,6‐diisopropylphenyl groups are not depicted for clarity. Relative energy values in kJ/mol are shown below each structure. [Color figure can be viewed at wileyonlinelibrary.com]

Similar articles

Cited by

References

    1. Schlegel H. B., J. Comput. Chem. 2003, 24, 1514. - PubMed
    1. Jensen F., Introduction to Computational Chemistry, 2nd ed.; Wiley: Chichester, UK, 2007.
    1. Fukui K., Acc. Chem. Res. 1981, 14, 363.
    1. Maeda S., Harabuchi Y., Ono Y., Taketsugu T., Morokuma K., Int. J. Quantum Chem. 2015, 115, 258.
    1. Harvey J. N., WIREs Comput. Mol. Sci. 2014, 4, 1.

Publication types

LinkOut - more resources