

Measuring human placental blood flow with multidelay 3D GRASE pseudocontinuous arterial spin labeling at 3T
- PMID: 29135072
- PMCID: PMC5951737
- DOI: 10.1002/jmri.25893
Measuring human placental blood flow with multidelay 3D GRASE pseudocontinuous arterial spin labeling at 3T
Abstract
Background: Placenta influences the health of both a woman and her fetus during pregnancy. Maternal blood supply to placenta can be measured noninvasively using arterial spin labeling (ASL).
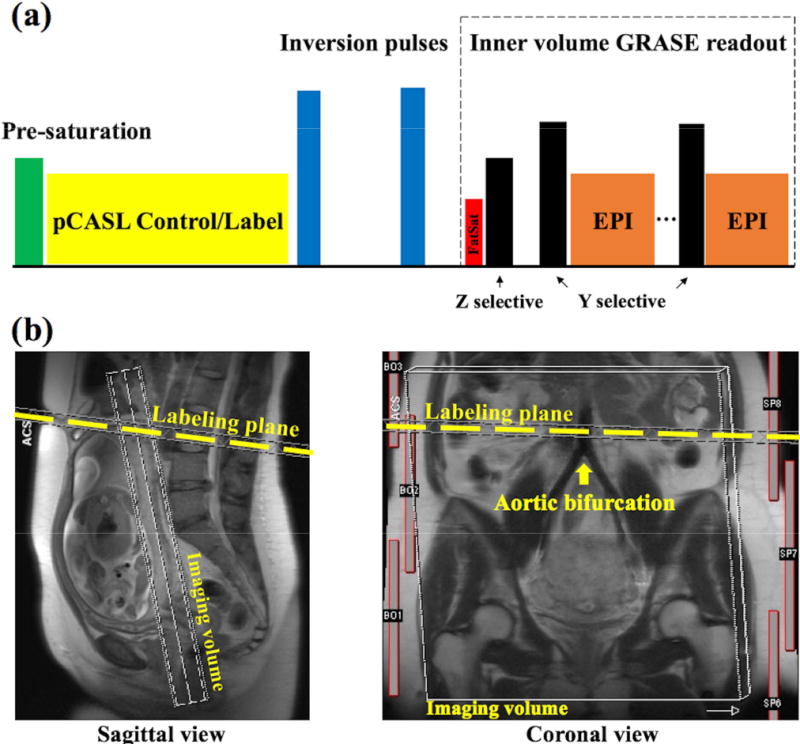
Purpose: To present a multidelay pseudocontinuous arterial spin labeling (pCASL) combined with a fast 3D inner-volume gradient- and spin-echo (GRASE) imaging technique to simultaneously measure placental blood flow (PBF) and arterial transit time (ATT), and to study PBF and ATT evolution with gestational age during the second trimester. The PBF values were compared with uterine arterial Doppler ultrasound to assess its potential clinical utility.
Study type: This was a prospective study.
Subjects: Thirty-four pregnant women.
Field strength/sequence: Multidelay 3D inner-volume GRASE pCASL sequence on 3T MR scanners.
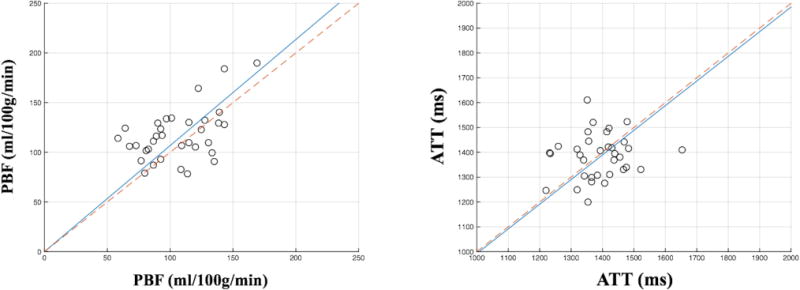
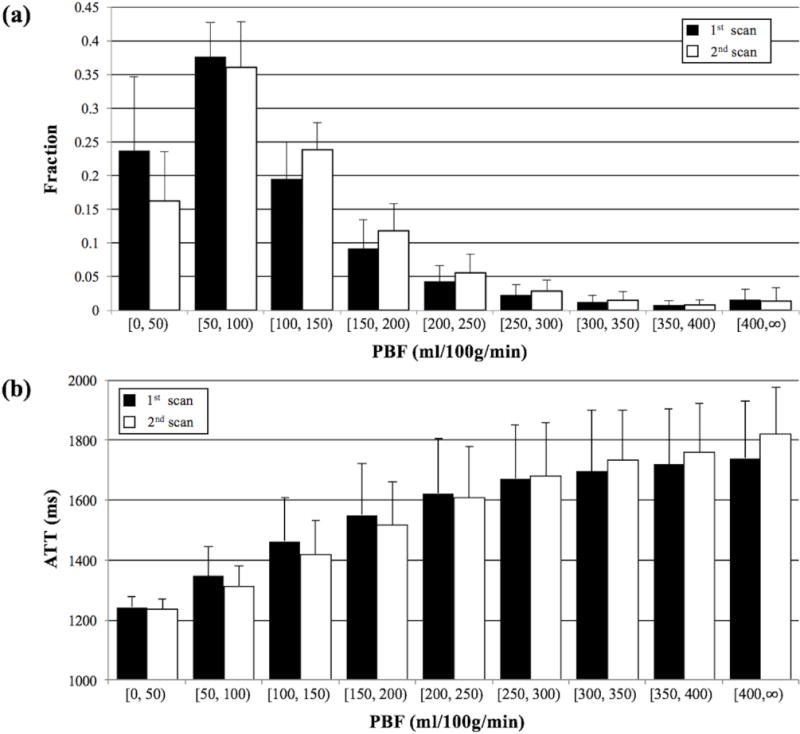
Assessment: Subjects underwent two longitudinal MRI scans within the second trimester, conducted between 14-16 and 19-22 weeks of gestational age, respectively. Placental perfusion was measured using the free-breathing pCASL sequence at three postlabeling delays (PLDs), followed by offline motion correction and model fitting for estimation of PBF and ATT.
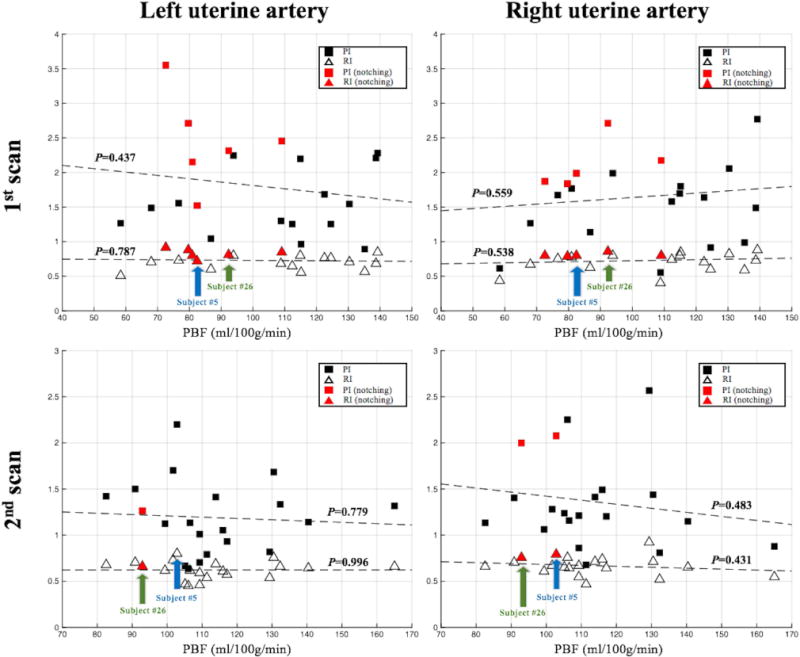
Statistical tests: A paired t-test was conducted to evaluate the significance of PBF/ATT variations with placental development. A two-sample t-test was conducted to evaluate the significance of PBF difference in subjects with and without early diastolic notch.
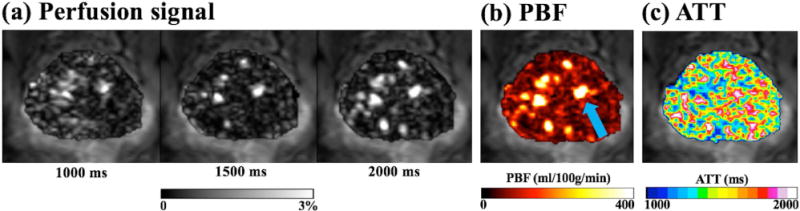
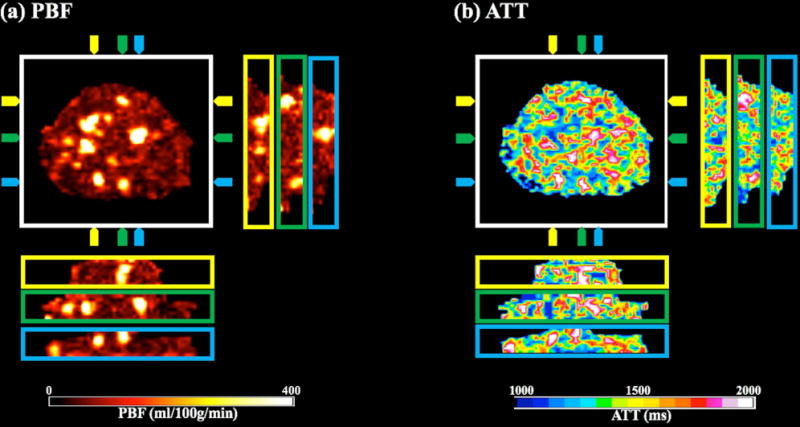
Results: The mean PBF and ATT for the second trimester were 111.4 ± 26.7 ml/100g/min and 1387.5 ± 88.0 msec, respectively. The average PBF increased by 10.4% (P < 0.05), while no significant change in ATT (P = 0.72) was found along gestational ages during the second trimester. PBF decreased 20.3% (P < 0.01) in subjects with early diastolic notches in ultrasound flow waveform patterns.
Data conclusion: Multidelay pCASL with inner-volume 3D GRASE is promising for noninvasive assessment of PBF during pregnancy. Its clinical use for the detection of aberrations in placental function and prediction of fetal developmental disorders awaits evaluation.
Level of evidence: 1 Technical Efficacy: Stage 2 J. Magn. Reson. Imaging 2018;47:1667-1676.
Keywords: arterial spin labeling (ASL); gestational age; human placenta; magnetic resonance imaging (MRI); placental blood flow (PBF).
© 2017 International Society for Magnetic Resonance in Medicine.
Figures
References
-
- Wang Y, Zhao S. Vascular Biology of the Placenta, Integrated Systems Physiology: from Molecules to Function to Disease0. San Rafael (CA) 2010
-
- Sibai B, Dekker G, Kupferminc M. Pre-eclampsia. Lancet. 2005;365(9461):785–799. - PubMed
-
- Campbell S, Diaz-Recasens J, Griffin DR, et al. New doppler technique for assessing uteroplacental blood flow. Lancet. 1983;1(8326 Pt 1):675–677. - PubMed
-
- Lai PK, Wang YA, Welsh AW. Reproducibility of regional placental vascularity/perfusion measurement using 3D power Doppler. Ultrasound Obstet Gynecol. 2010;36(2):202–209. - PubMed
-
- Salomon LJ, Siauve N, Balvay D, et al. Placental perfusion MR imaging with contrast agents in a mouse model. Radiology. 2005;235(1):73–80. - PubMed
Publication types
MeSH terms
Substances
Grants and funding
LinkOut - more resources
Full Text Sources
Other Literature Sources
Medical
