

Regional Variations of Spontaneous, Transient Adenosine Release in Brain Slices
- PMID: 29135225
- PMCID: PMC6050173
- DOI: 10.1021/acschemneuro.7b00280
Regional Variations of Spontaneous, Transient Adenosine Release in Brain Slices
Abstract
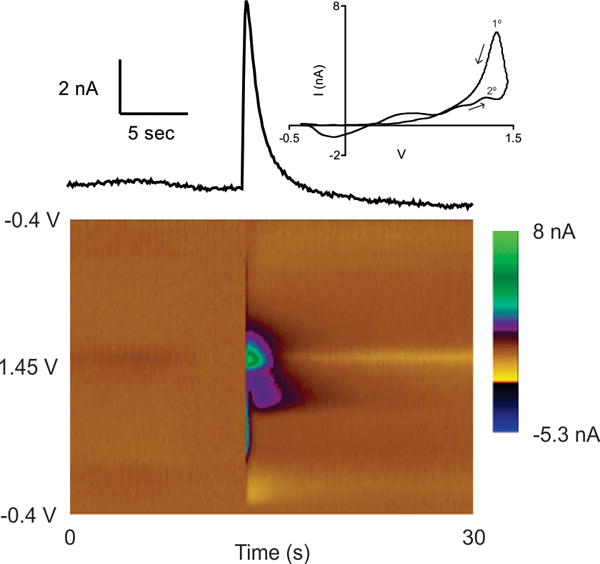
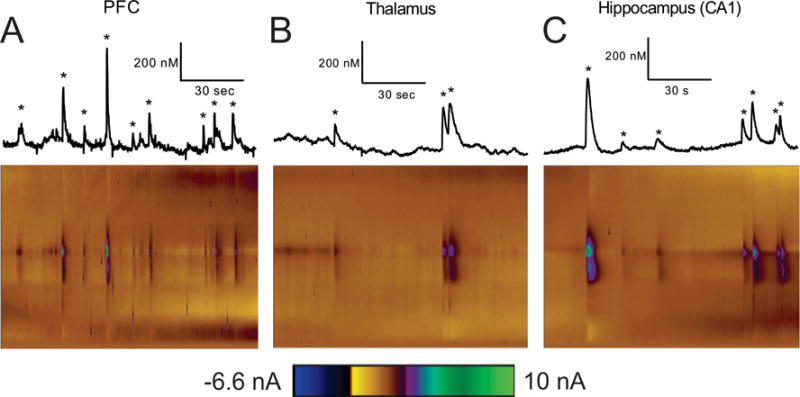
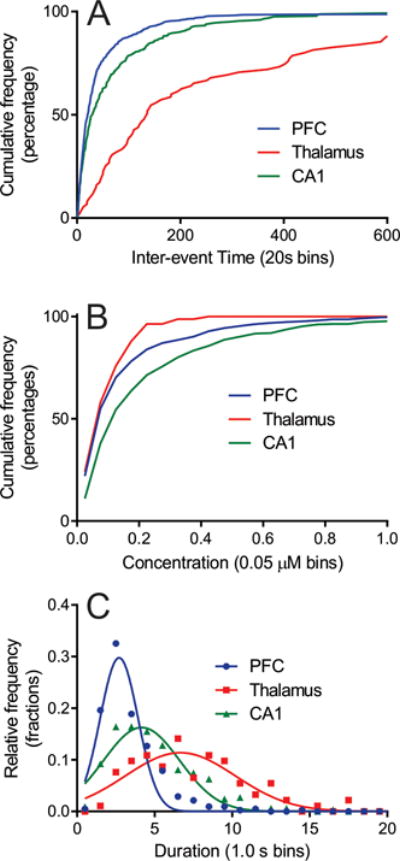
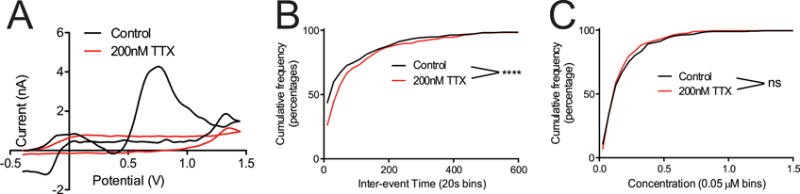
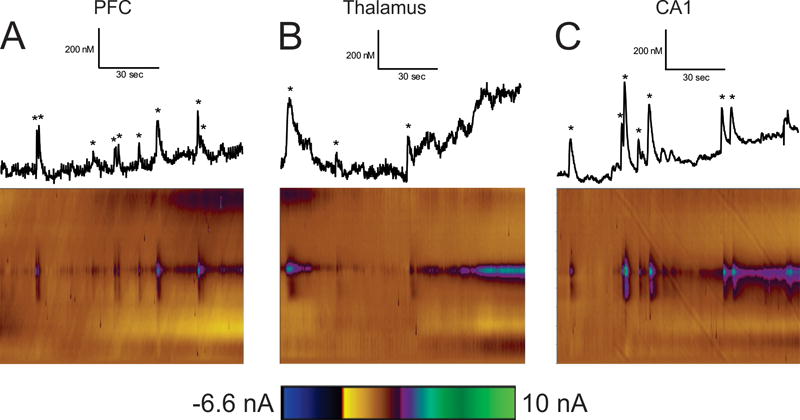
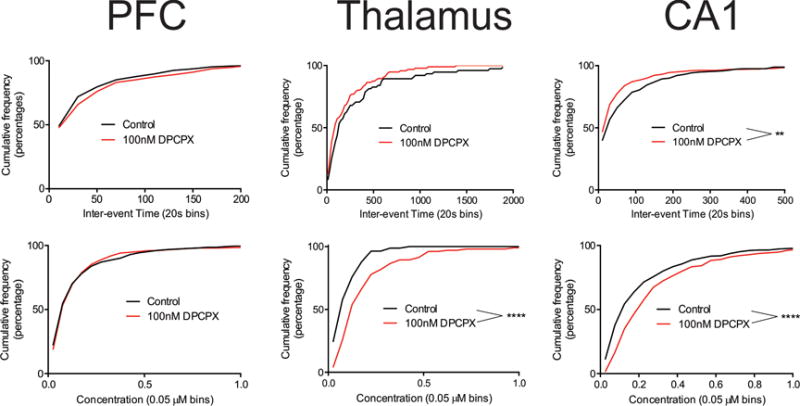
Transient adenosine signaling has been recently discovered in vivo, where the concentration is on average 180 nM and the duration only 3-4 s. In order to rapidly screen different brain regions and mechanisms of formation and regulation, here we develop a rat brain slice model to study adenosine transients. The frequency, concentration, and duration of transient adenosine events were compared in the prefrontal cortex (PFC), hippocampus (CA1), and thalamus. Adenosine transients in the PFC were similar to those in vivo, with a concentration of 160 ± 10 nM, and occurred frequently, averaging one every 50 ± 5 s. In the thalamus, transients were infrequent, occurring every 280 ± 40 s, and lower concentration (110 ± 10 nM), but lasted twice as long as in the PFC. In the hippocampus, adenosine transients were less frequent than those in the PFC, occurring every 79 ± 7 s, but the average concentration (240 ± 20 nM) was significantly higher. Adenosine transients are largely maintained after applying 200 nM tetrodotoxin, implying they are not activity dependent. The response to adenosine A1 antagonist 8-cyclopentyl-1,3-dipropylxanthine (DPCPX) differed by region; DPCPX had no significant effects in the PFC, but increased the average transient concentration in the thalamus and both the transient frequency and concentration in the hippocampus. Thus, the amount of adenosine available to activate receptors, and the ability to upregulate adenosine signaling with DPCPX, varies by brain region. This is an important consideration for designing treatments that modulate adenosine in order to cause neuroprotective effects.
Keywords: A1 receptor; Adenosine; brain slices; electrochemistry; fast-scan cyclic voltammetry.
Conflict of interest statement
The authors declare no competing financial interests.
Figures
References
-
- Tominaga K, Shibata S, Watanabe S. A neuroprotective effect of adenosine A1-receptor agonists on ischemia-induced decrease in 2-deoxyglucose uptake in rat hippocampal slices. Neurosci Lett. 1992;145:67–70. - PubMed
-
- Rebola N, Coelho JE, Costenla AR, Lopes LV, Parada A, Oliveira CR, Soares-da-Silva P, de Mendonca A, Cunha RA. Decrease of adenosine A1 receptor density and of adenosine neuromodulation in the hippocampus of kindled rats. Eur J Neurosci. 2003;18:820–828. - PubMed
Publication types
MeSH terms
Substances
Grants and funding
LinkOut - more resources
Full Text Sources
Other Literature Sources
Miscellaneous
