. 2017 Nov 14;14(11):1388.
doi: 10.3390/ijerph14111388.

Comprehensive Survey on Improved Focality and Penetration Depth of Transcranial Magnetic Stimulation Employing Multi-Coil Arrays

Affiliations

Comprehensive Survey on Improved Focality and Penetration Depth of Transcranial Magnetic Stimulation Employing Multi-Coil Arrays

Xile Wei et al. Int J Environ Res Public Health. .

Abstract

Multi-coil arrays applied in transcranial magnetic stimulation (TMS) are proposed to accurately stimulate brain tissues and modulate neural activities by an induced electric field (EF). Composed of numerous independently driven coils, a multi-coil array has alternative energizing strategies to evoke EFs targeting at different cerebral regions. To improve the locating resolution and the stimulating focality, we need to fully understand the variation properties of induced EFs and the quantitative control method of the spatial arrangement of activating coils, both of which unfortunately are still unclear. In this paper, a comprehensive analysis of EF properties was performed based on multi-coil arrays. Four types of planar multi-coil arrays were used to study the relationship between the spatial distribution of EFs and the structure of stimuli coils. By changing coil-driven strategies in a basic 16-coil array, we find that an EF induced by compactly distributed coils decays faster than that induced by dispersedly distributed coils, but the former has an advantage over the latter in terms of the activated brain volume. Simulation results also indicate that the attenuation rate of an EF induced by the 36-coil dense array is 3 times and 1.5 times greater than those induced by the 9-coil array and the 16-coil array, respectively. The EF evoked by the 36-coil dispense array has the slowest decay rate. This result demonstrates that larger multi-coil arrays, compared to smaller ones, activate deeper brain tissues at the expense of decreased focality. A further study on activating a specific field of a prescribed shape and size was conducted based on EF variation. Accurate target location was achieved with a 64-coil array 18 mm in diameter. A comparison between the figure-8 coil, the planar array, and the cap-formed array was made and demonstrates an improvement of multi-coil configurations in the penetration depth and the focality. These findings suggest that there is a tradeoff between attenuation rate and focality in the application of multi-coil arrays. Coil-energizing strategies and array dimensions should be based on an adequate evaluation of these two important demands and the topological structure of target tissues.

Keywords: electric field distribution; multi-coil array; target location; transcranial magnetic stimulation.


Conflict of interest statement

The authors declare no conflict of interest.

Figures

Figure 1
Figure 1
Segmentation method on the surface layer of top half of the head model. (ac) Different orientations of observation.
Figure 2
Figure 2
(a) The 16-coil array is shown in the front view, where Figures 1–16 are used to distinguish different coils. Directions of stimulating current are marked out by arc arrows. To simplify the calculation process, we used D to denote the outer diameter of individual coil and βD to represent the minimum distance between adjacent coils in a row. The models in (bd) are those of the 9-coil array, the 36-coil (dense) array, and the 36-coil (disperse) array, respectively. Ratio between of the outer diameter of the coil to the minimum coil–coil distance was fixed at 0.55, but the total numbers of coils in the arrays are distinct.
Figure 3
Figure 3
Coil arrays used for comparison. (a) figure-8 coil; (b) 36-coil planar array; (c) 36-coil cap-formed array.
Figure 4
Figure 4
Sketch maps of different coil combinations based on the 16-coil array. Current directions are indicated by arrows. Coils with clockwise or anticlockwise current are regarded as stimulating coils, whereas the gray ones represent coils without electricity. “a” indicates the length between two adjacent coils and the connecting lines in each coil array mark out the specific areas corresponding to different energized coil combinations.
Figure 5
Figure 5
Relationship between the electric field (EF) intensity and the depth of specific brain regions. (a) The intensity attenuation profiles of 4-coil combinations. Here, L indicates the distance from the surface of the head model along the direction passing through the brain center. EX represents the EF intensity of a targeted depth, and EO is the value of cortical EF intensity. (b) The intensity attenuation profiles of 8-coil combinations. (c) Relationship between the decay rate of induced EF strength and the value of CD among the 4-coil group. (d) Relationship between decay rate of field intensity and the CD level of 8-coil group.
Figure 6
Figure 6
The variation tendency of EF intensity generated by multi-coil arrays of distinct dimensions. The size of an individual coil and an overall spatial distribution of arrays are both influential factors to the variation tendency of the induced EF.
Figure 7
Figure 7
(a) Overall activated proportions targeting at different stimulated depths. L indicates the length from superficial layer to the interested depth of brain tissue. (b) The relationship between targeted depths and activated proportions. (c,d) Variation tendency of current density with the increase of targeted depth. The input energy is represented by current density of each individual coil.
Figure 8
Figure 8
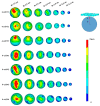
Spatial distribution of the induced EF in different layers of the head model. R meets the relationship of “R = 8.5-L”, indicating that R attenuates with the increase of L.
Figure 9
Figure 9
Strengths of the induced EFs at different depth are normalized with respect to the maximum EF amplitude estimated on the cortex. The values of proportion are represented with P. V(θ) shows the activated volume of the head model. The depths of brain tissue are marked A–G, which correspond to L from 1 to 7 cm.
Figure 10
Figure 10
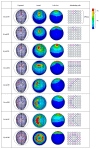
Stimulation results targeted at different cortical tissues. The units in red solid circles are interested regions. The activated parts and energized coils are shown correspondingly. Here, currents in coils are indicated by arrows.
Figure 11
Figure 11
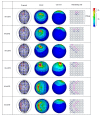
Stimulation results targeted at different cortical tissues. The units in red solid circles are interested regions. The activated parts and energized coils are shown correspondingly. Here, currents in coils are indicated by arrows of different directions.
Figure 12
Figure 12
(a) Attenuation rate of induced EF in the figure-8 coil, the 36-coil planar array, and the 36-coil cap-formed array. (b) Corresponding ranges of activated depth with different coil types. (c) The focality of various coils with optimal energizing strategies. (d) The attenuation rates of the figure-8 coil, the planar array, and the cap-formed array with optimal energizing strategies.
Figure 13
Figure 13
The comparison of the planar array and the cap-formed array. Red full lines indicate cortical regions activated by the selected coils in the cap-formed array. The dashed lines show cortical tissues stimulated by the same corresponding coils in the planar array.

Similar articles

Cited by

References

    1. Roth Y., Padberg F., Zangen A. Transcranial magnetic stimulation of deep brain regions: Principles and methods. Adv. Biol. Psychiatry. 2007;23:204–225.
    1. George M.S., Aston-Jones G. Noninvasive techniques for probing neurocircuitry and treating illness: Vagus nerve stimulation (VNS), transcranial magnetic stimulation (TMS) and transcranial direct current stimulation (tDCS) Neuropsychopharmacology. 2010;35:301–316. doi: 10.1038/npp.2009.87. - DOI - PMC - PubMed
    1. Pascual-Leone A., Walsh V., Rothwell J. Transcranial magnetic stimulation in cognitive neuroscience—Virtual lesion, chronometry, and functional connectivity. Curr. Opin. Neurobiol. 2000;10:232–237. doi: 10.1016/S0959-4388(00)00081-7. - DOI - PubMed
    1. Rastogi P., Lee E.G., Hadimani R.L., Jiles D.C. Transcranial Magnetic Stimulation-coil design with improved focality. AIP Adv. 2016;7:56701–56705. doi: 10.1063/1.4973604. - DOI
    1. Im C.H., Lee C. Precise Estimation of Brain Electrical Sources Using Anatomically Constrained Area Source (ACAS) Localization. IEEE. Trans. Magn. 2007;42:1713–1716. doi: 10.1109/TMAG.2006.892286. - DOI

LinkOut - more resources