Effects of small-scale clustering of flowers on pollinator foraging behaviour and flower visitation rate
- PMID: 29136042
- PMCID: PMC5685580
- DOI: 10.1371/journal.pone.0187976
Effects of small-scale clustering of flowers on pollinator foraging behaviour and flower visitation rate
Abstract
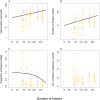
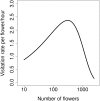
Plants often grow in clusters of various sizes and have a variable number of flowers per inflorescence. This small-scale spatial clustering affects insect foraging strategies and plant reproductive success. In our study, we aimed to determine how visitation rate and foraging behaviour of pollinators depend on the number of flowers per plant and on the size of clusters of multiple plants using Dracocephalum moldavica (Lamiaceae) as a target species. We measured flower visitation rate by observations of insects visiting single plants and clusters of plants with different numbers of flowers. Detailed data on foraging behaviour within clusters of different sizes were gathered for honeybees, Apis mellifera, the most abundant visitor of Dracocephalum in the experiments. We found that the total number of flower visitors increased with the increasing number of flowers on individual plants and in larger clusters, but less then proportionally. Although individual honeybees visited more flowers in larger clusters, they visited a smaller proportion of flowers, as has been previously observed. Consequently, visitation rate per flower and unit time peaked in clusters with an intermediate number of flowers. These patterns do not conform to expectations based on optimal foraging theory and the ideal free distribution model. We attribute this discrepancy to incomplete information about the distribution of resources. Detailed observations and video recordings of individual honeybees also showed that the number of flowers had no effect on handling time of flowers by honeybees. We evaluated the implications of these patterns for insect foraging biology and plant reproduction.
Conflict of interest statement
Figures


References
-
- Zimmerman M. Reproduction in Polemonium: competition for pollinators. Ecology. 1980;61(3):497–501. doi: 10.2307/1937414 - DOI
-
- Jennersten O, Nilsson SG. Insect flower visitation frequency and seed production in relation to patch size of Viscaria vulgaris (Caryophyllaceae). Oikos. 1993;68:283–292. doi: 10.2307/3544841 - DOI
-
- Emlen JM. The role of time and energy in food preference. The American Naturalist. 1966;100(916):611–617. doi: 10.1086/282455 - DOI
-
- MacArthur RH, Pianka ER. On optimal use of a patchy environment. The American Naturalist. 1966;100(916):603–609. doi: 10.1086/282454 - DOI
-
- Hegland SJ. Floral neighbourhood effects on pollination success in red clover are scale-dependent. Functional Ecology. 2014;28(3):561–568. doi: 10.1111/1365-2435.12223 - DOI
MeSH terms
LinkOut - more resources
Full Text Sources
Other Literature Sources

