Comparative Study
. 2018 Jan 4;46(D1):D956-D963.
doi: 10.1093/nar/gkx1090.

LinkedOmics: analyzing multi-omics data within and across 32 cancer types

Affiliations
Comparative Study

LinkedOmics: analyzing multi-omics data within and across 32 cancer types

Suhas V Vasaikar et al. Nucleic Acids Res. .

Abstract

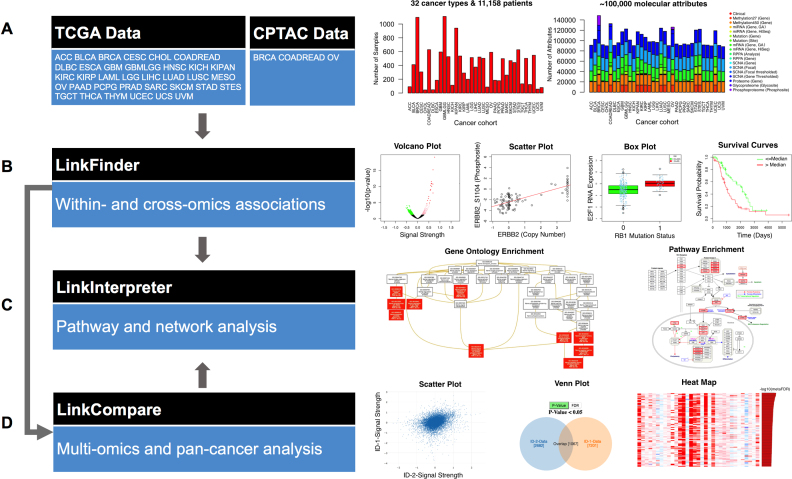
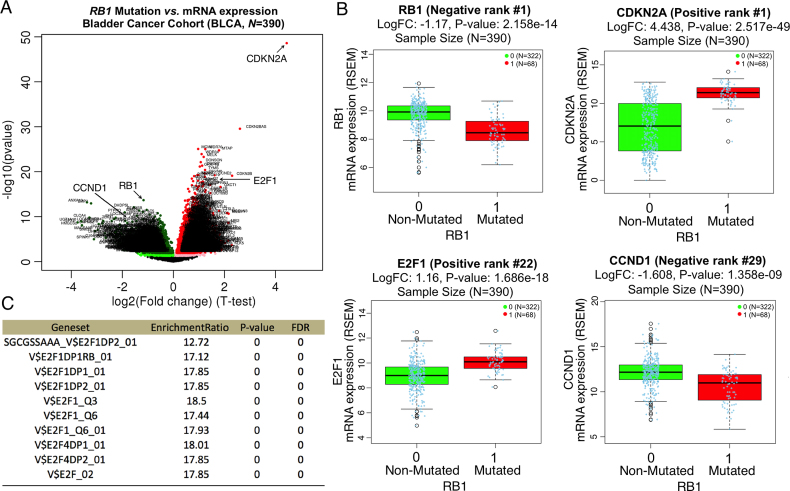
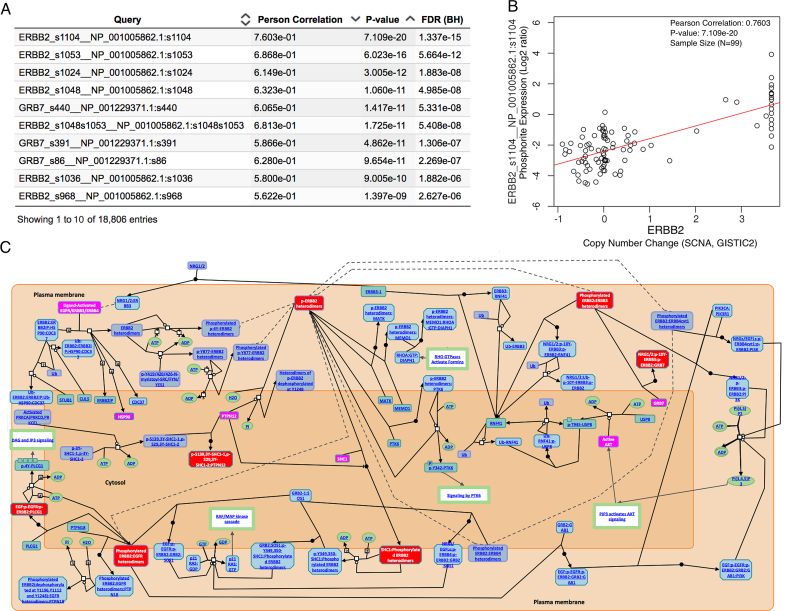
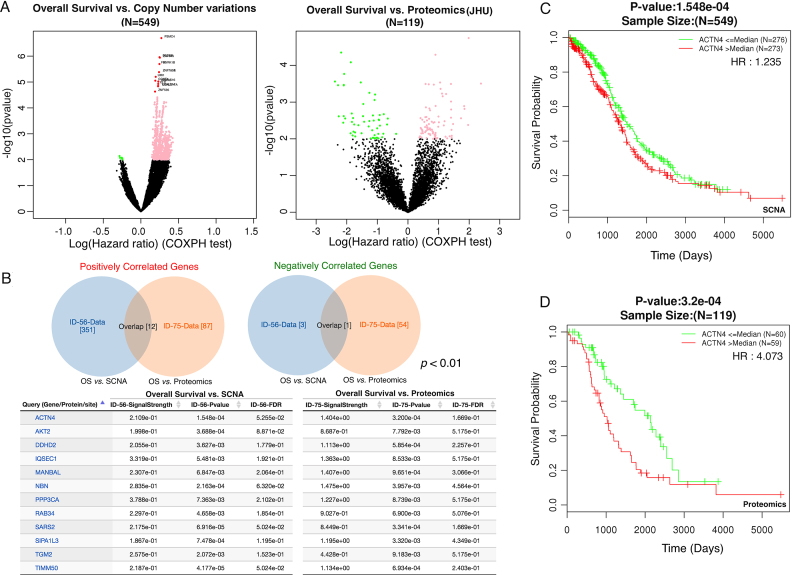
The LinkedOmics database contains multi-omics data and clinical data for 32 cancer types and a total of 11 158 patients from The Cancer Genome Atlas (TCGA) project. It is also the first multi-omics database that integrates mass spectrometry (MS)-based global proteomics data generated by the Clinical Proteomic Tumor Analysis Consortium (CPTAC) on selected TCGA tumor samples. In total, LinkedOmics has more than a billion data points. To allow comprehensive analysis of these data, we developed three analysis modules in the LinkedOmics web application. The LinkFinder module allows flexible exploration of associations between a molecular or clinical attribute of interest and all other attributes, providing the opportunity to analyze and visualize associations between billions of attribute pairs for each cancer cohort. The LinkCompare module enables easy comparison of the associations identified by LinkFinder, which is particularly useful in multi-omics and pan-cancer analyses. The LinkInterpreter module transforms identified associations into biological understanding through pathway and network analysis. Using five case studies, we demonstrate that LinkedOmics provides a unique platform for biologists and clinicians to access, analyze and compare cancer multi-omics data within and across tumor types. LinkedOmics is freely available at http://www.linkedomics.org.


Figures

Figure 1.
Figure 1.
LinkedOmics for discovering, comparing, and understanding the associations between billions of clinical and molecular attribute pairs within and across 32 human cancer types. (A) Data source, cancer cohorts, and the numbers of samples and attributes for each cancer cohort. Explanations of the abbreviations can be found in Supplementary Table S1. (B) The LinkFinder module performs association analysis within and across omics data types. Example outputs include volcano plots, scatter plots, box plots, and survival curve plots. (C) The LinkInterpreter module performs pathway and network analyses for associations identified by LinkFinder or LinkCompare. Example outputs include enriched Gene Ontology (GO) directed acyclic graphs and pathway diagrams. (D) The LinkCompare module compares associations identified by LinkFinder using correlation analysis and scatter plots, Venn diagrams, meta-analysis, heat maps and bar plots.
Figure 2.
Figure 2.
Functional impact of RB1 mutation on mRNA expression in Bladder Cancer. (A) In the TCGA BLCA (Bladder urothelial carcinoma) cohort, 1518 genes showed significant up-regulation (dark red dots, FDR < 0.01) in RB1 mutated samples whereas 1294 genes showed significant down-regulation (dark green dots, FDR < 0.01). (B) Among the most significant genes, up-regulation was found for CDKN2A and E2F1 (positive rank #1 and #22) whereas down-regulation was found for RB1 and CCND1 (negative rank #1 and #29). (C) The 1518 up-regulated genes were significantly enriched with transcriptional targets of E2F1 (Fisher's exact test, top 10 most enriched target sets).
Figure 3.
Figure 3.
Impact of ERBB2 amplification on protein phosphorylation in breast cancer. (A) The top 10 phosphosites associated with ERBB2 amplification. (B) Scatter plot visualizing the association between ERBB2 amplification and the phosphosite abundance of ERBB2_s1104. (C) Increased phosphorylation was found for the ‘Signalling by ERBB2’ pathway (rank #1, FDR = 0.006, gene set enrichment analysis with Reactome pathway database). The leading edge genes and their phosphorylated protein forms are highlighted in magenta and red boxes, respectively.
Figure 4.
Figure 4.
Multi-omics based protein signature for poor prognosis in ovarian cancer. (A) 1122 and 141 genes were significantly associated with patient survival time based on the copy number and proteomics data, respectively (P <0.01, Cox regression). (B) The Venn diagram analysis with directional constraint identified 13 overlapping genes between the two platforms, and the 12 genes associated with poor-prognosis are shown in the table. (C) Kaplan–Meier survival curves for patients with above- (red) and below- (green) median ACTN4 copy number estimates (Hazard ratio [HR] = 1.235, P = 1.548e–04). (D) Kaplan–Meier survival curves for patients with above- (red) and below- (green) median ACTN4 protein abundance (HR = 4.073, P = 3.2e–04).
Figure 5.
Figure 5.
Pan-cancer analysis for survival-associated gene expression signatures. (A) Twelve cancer types in the TCGA project with >100 death events. (B) The heat map shows the top 30 poor survival-associated genes. Each cell represents the signed –log10 (P-value). The right panel bar plot depicts corresponding meta-analysis based FDR. A and B share the same order of cancer types, as indicated below the heat map. (C) Increased expression of genes in the cell cycle pathway is associated with increased death risk (FDR<0.001, gene set enrichment analysis). Leading-edge genes are highlighted in red boxes in C. (D–G) Patients with above- (red) and below- (green) median APCDD1L mRNA abundance had significantly different survival rates in multiple cancer types such as bladder urothelial carcinoma (BLCA, D), head and neck squamous cell carcinoma (HNSC, E), kidney renal clear cell carcinoma (KIRC, F), and brain lower grade glioma (LGG, G).
Figure 6.
Figure 6.
LinkedOmics connected the novel pan-cancer poor prognosis marker APCDD1L to biological processes associated with tumor invasiveness and aggressiveness. We performed APCDD1L mRNA co-expression analysis in each of the 12 cancer cohorts using LinkFinder (Pearson's correlation) and then integrated the p values obtained from each cancer type using LinkCompare. The top 30 most significantly correlated genes are shown in the heat map, in which each cell represents signed –log10 (P-value). The right panel bar plot depicts corresponding meta-analysis based FDR. The epithelial–mesenchymal transition (EMT) genes are shown with green arrows.

References

    1. Fernandez-Banet J., Esposito A., Coffin S., Horvath I.B., Estrella H., Schefzick S., Deng S., Wang K., Aching K., Ding Y. et al. OASIS: web-based platform for exploring cancer multi-omics data. Nat. Methods. 2016; 13:9–10. - PubMed
    1. Gao J., Aksoy B.A., Dogrusoz U., Dresdner G., Gross B., Sumer S.O., Sun Y., Jacobsen A., Sinha R., Larsson E. et al. Integrative analysis of complex cancer genomics and clinical profiles using the cBioPortal. Sci. Signal. 2013; 6:pl1. - PMC - PubMed
    1. Goldman M., Craft B., Swatloski T., Cline M., Morozova O., Diekhans M., Haussler D., Zhu J.. The UCSC Cancer Genomics Browser: update 2015. Nucleic Acids Res. 2015; 43:D812–D817. - PMC - PubMed
    1. Li J., Lu Y., Akbani R., Ju Z., Roebuck P.L., Liu W., Yang J.Y., Broom B.M., Verhaak R.G., Kane D.W. et al. TCPA: a resource for cancer functional proteomics data. Nat. Methods. 2013; 10:1046–1047. - PMC - PubMed
    1. Aran D., Sirota M., Butte A.J.. Systematic pan-cancer analysis of tumour purity. Nat. Commun. 2015; 6:8971. - PMC - PubMed

Publication types

MeSH terms