

Shoot apical meristem and plant body organization: a cross-species comparative study
- PMID: 29136411
- PMCID: PMC5737494
- DOI: 10.1093/aob/mcx116
Shoot apical meristem and plant body organization: a cross-species comparative study
Abstract
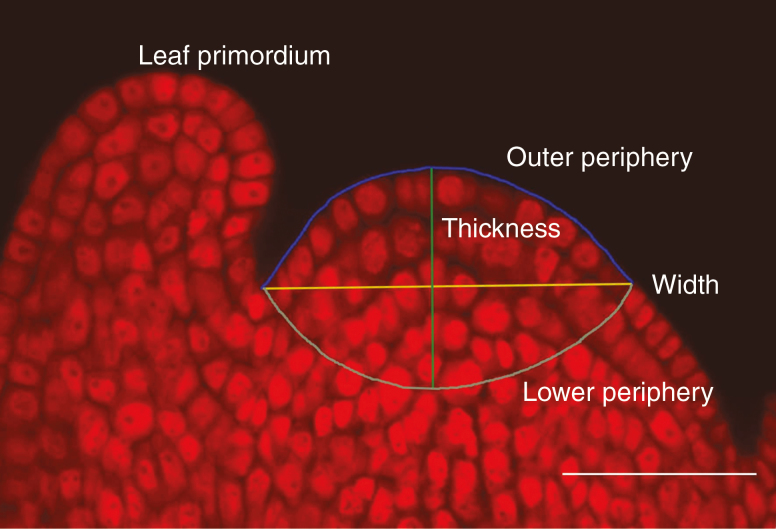
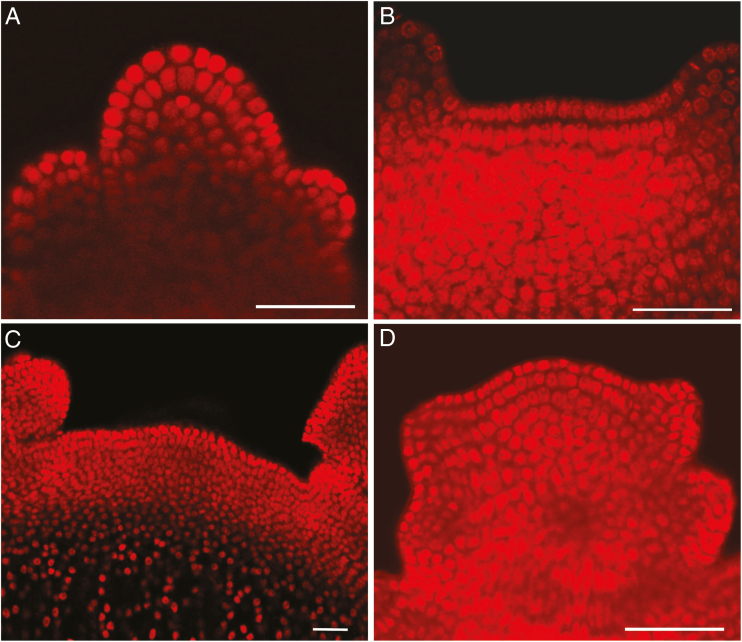
Background and aims: The shoot apical meristem (SAM) is the key organizing element in the plant body and is responsible for the core of plant body organization and shape. Surprisingly, there are almost no comparative data that would show links between parameters of the SAM and whole-plant traits as drivers of the plant's response to the environment.
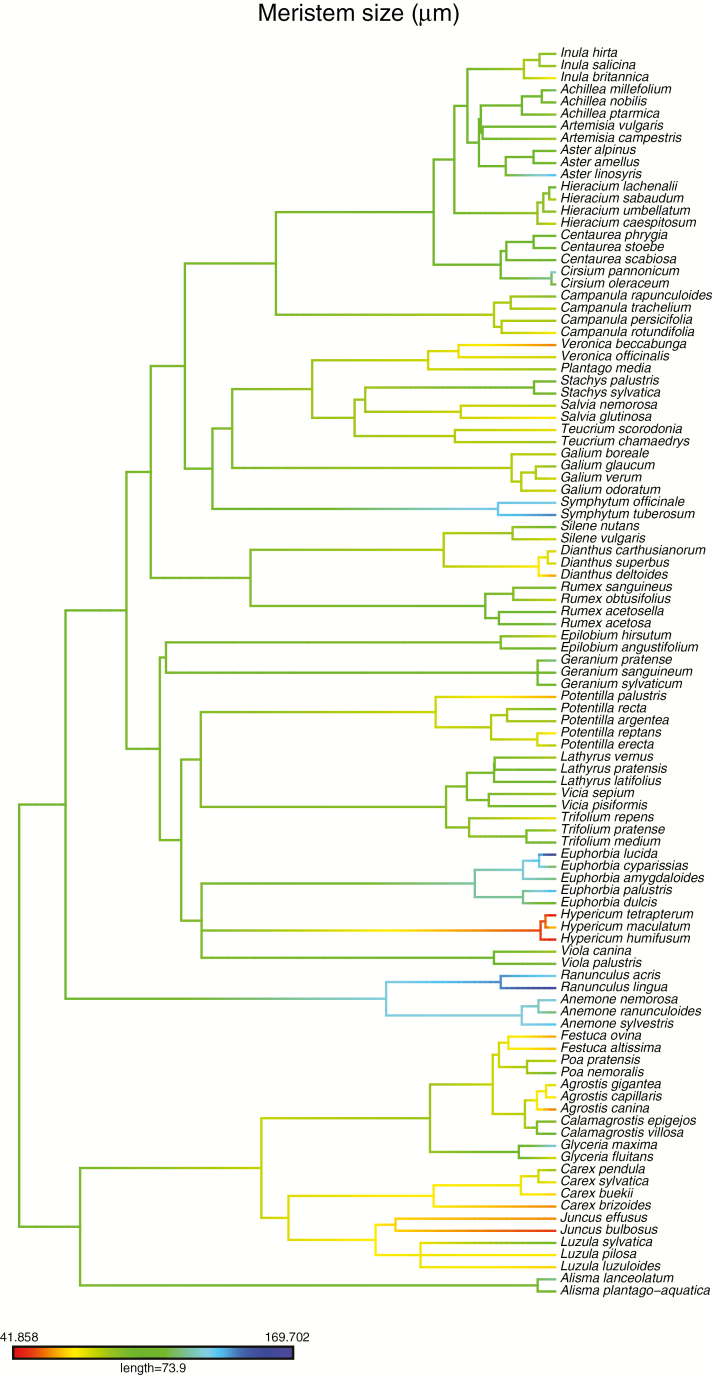
Methods: Interspecific differences in SAM anatomy were examined in 104 perennial herbaceous angiosperms.
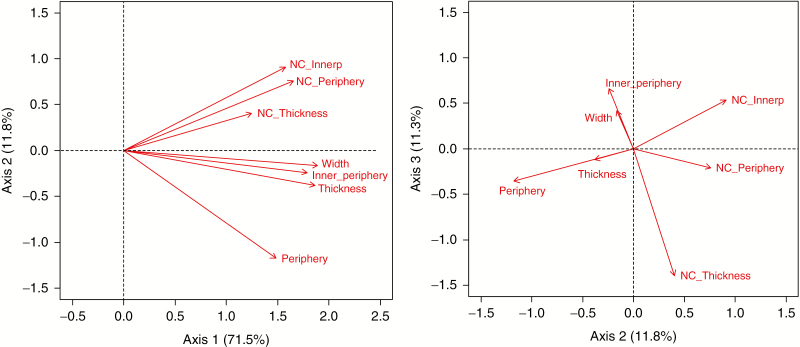
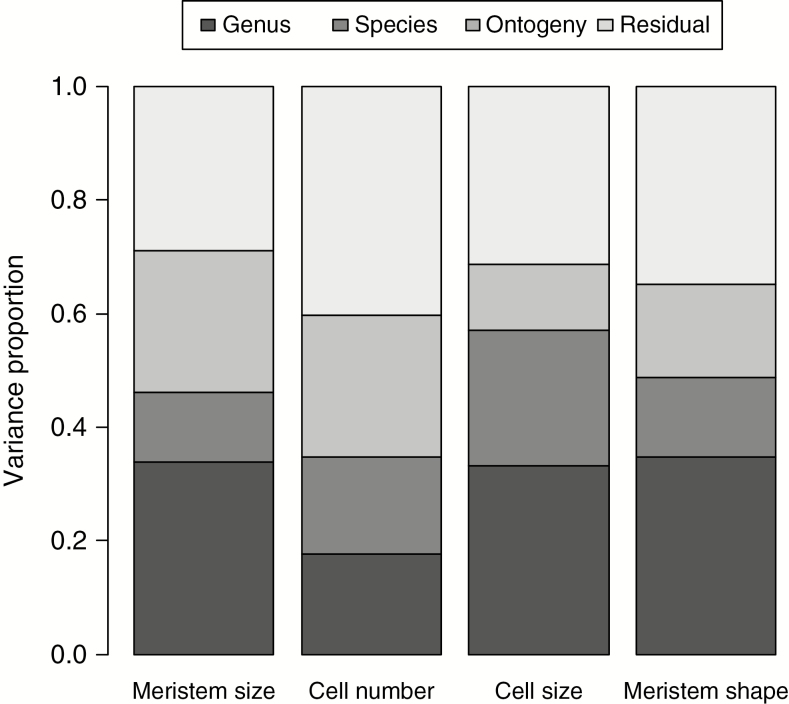
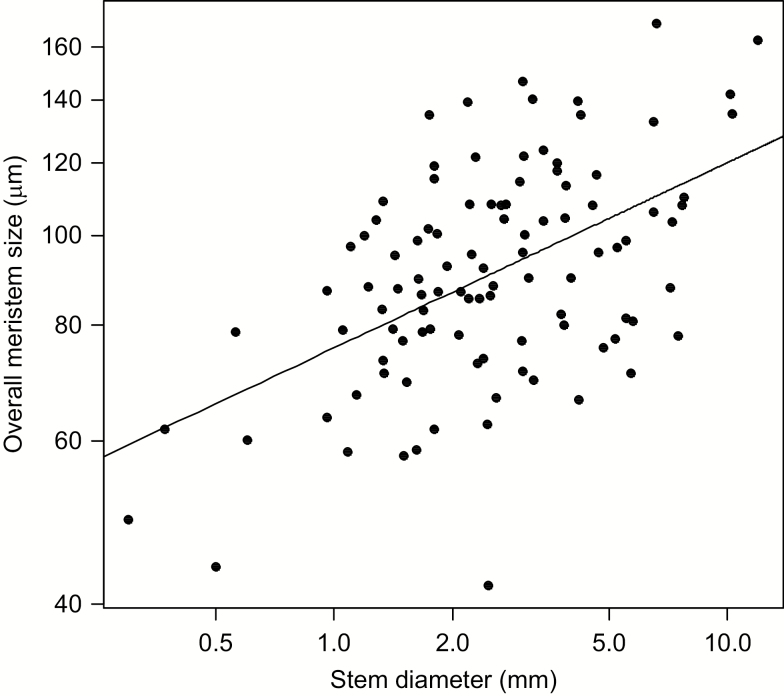
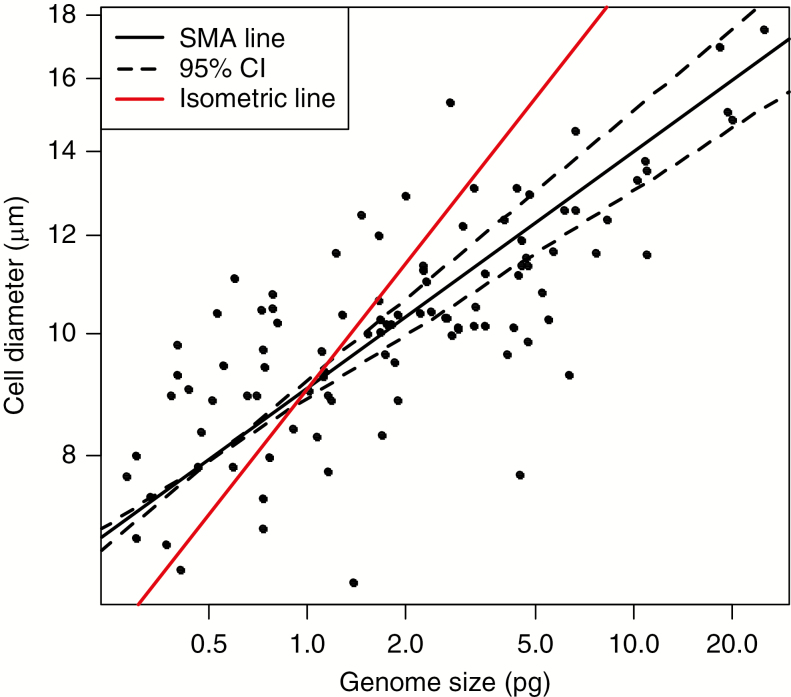
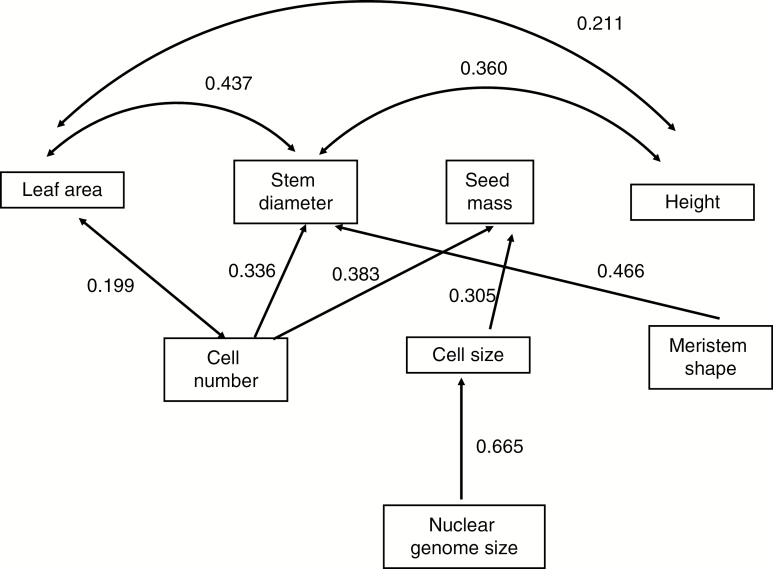
Key results: There were differences in SAM parameters among individual species, their phylogenetic patterns, and how their variation is linked to variation in plant above-ground organs and hence species' environmental niches. SAM parameters were correlated with the size-related traits of leaf area, seed mass and stem diameter. Of the two key SAM parameters (cell size and number), variation in all organ traits was linked more strongly to cell number, with cell size being important only for seed mass. Some of these correlations were due to shared phylogenetic history (e.g. SAM diameter versus stem diameter), whereas others were due to parallel evolution (e.g. SAM cell size and seed mass).
Conclusion: These findings show that SAM parameters provide a functional link among sizes and numbers of plant organs, constituting species' environmental responses.
Keywords: Corner’s rule; cell number; cell size; genome size; phylogenetic analysis.
© The Author 2017. Published by Oxford University Press on behalf of the Annals of Botany Company. All rights reserved. For Permissions, please email: journals.permissions@oup.com
Figures
Similar articles
-
Disentangling phylogenetic and functional components of shape variation among shoot apical meristems of a wide range of herbaceous angiosperms.Am J Bot. 2020 Jan;107(1):20-30. doi: 10.1002/ajb2.1407. Epub 2019 Dec 29. Am J Bot. 2020. PMID: 31885081
-
Genetic control of morphometric diversity in the maize shoot apical meristem.Nat Commun. 2015 Nov 20;6:8974. doi: 10.1038/ncomms9974. Nat Commun. 2015. PMID: 26584889 Free PMC article.
-
Feedback from Lateral Organs Controls Shoot Apical Meristem Growth by Modulating Auxin Transport.Dev Cell. 2018 Jan 22;44(2):204-216.e6. doi: 10.1016/j.devcel.2017.12.021. Dev Cell. 2018. PMID: 29401419
-
The vascular plants: open system of growth.Dev Genes Evol. 2017 Mar;227(2):129-157. doi: 10.1007/s00427-016-0572-1. Epub 2017 Feb 18. Dev Genes Evol. 2017. PMID: 28214944 Review.
-
Patterning at the shoot apical meristem and phyllotaxis.Curr Top Dev Biol. 2019;131:81-107. doi: 10.1016/bs.ctdb.2018.10.003. Epub 2018 Nov 27. Curr Top Dev Biol. 2019. PMID: 30612633 Review.
Cited by
-
Somatic Evolution of Stem Cell Mutations in Long-Lived Plants.Mol Biol Evol. 2025 Jul 30;42(8):msaf165. doi: 10.1093/molbev/msaf165. Mol Biol Evol. 2025. PMID: 40614173 Free PMC article.
-
The Cytokinin Status of the Epidermis Regulates Aspects of Vegetative and Reproductive Development in Arabidopsis thaliana.Front Plant Sci. 2021 Feb 23;12:613488. doi: 10.3389/fpls.2021.613488. eCollection 2021. Front Plant Sci. 2021. PMID: 33732273 Free PMC article.
-
Dynamic evolution of small signalling peptide compensation in plant stem cell control.Nat Plants. 2022 Apr;8(4):346-355. doi: 10.1038/s41477-022-01118-w. Epub 2022 Mar 28. Nat Plants. 2022. PMID: 35347264
-
Even when the seasons change our allometry stays the same. A Commentary on: 'Corner's rules pass the test of time: little effect of phenology on leaf-shoot and other scaling relationships'.Ann Bot. 2020 Nov 24;126(7):iii-iv. doi: 10.1093/aob/mcaa166. Ann Bot. 2020. PMID: 33057594 Free PMC article.
-
Developmental mechanisms involved in the diversification of flowers.Nat Plants. 2019 Sep;5(9):917-923. doi: 10.1038/s41477-019-0498-5. Epub 2019 Sep 2. Nat Plants. 2019. PMID: 31477891 Review.
References
-
- Abbe EC, Randolph LF, Einset J. 1941. The developmental relationship between shoot apex and growth pattern of leaf blade in diploid maize. American Journal of Botany 28: 778–784.
-
- Ackerly DD, Donoghue MJ. 1998. Leaf size, sapling allometry, and Corner’s rules: phylogeny and correlated evolution in maples (Acer). American Naturalist 152: 767–791. - PubMed
-
- Barlow PW. 1989. Meristems, metamers and modules and the development of shoot and root systems. Botanical Journal of the Linnean Society 100: 255–279.
-
- Bates D, Maechler M, Bolker B, Walker S. 2015. Fitting linear mixed-effects models using lme4. Journal of Statistical Software 67: 1–48.
-
- Bäurle I, Laux T. 2003. Apical meristems: the plant’s fountain of youth. Bioessays 25: 961–970. - PubMed
Publication types
MeSH terms
LinkOut - more resources
Full Text Sources
Other Literature Sources
