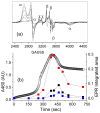
. 2017 Dec 6;139(48):17313-17326.
doi: 10.1021/jacs.7b06246. Epub 2017 Nov 27.

Equilibrating (L)FeIII-OOAc and (L)FeV(O) Species in Hydrocarbon Oxidations by Bio-Inspired Nonheme Iron Catalysts Using H2O2 and AcOH

Affiliations

Equilibrating (L)FeIII-OOAc and (L)FeV(O) Species in Hydrocarbon Oxidations by Bio-Inspired Nonheme Iron Catalysts Using H2O2 and AcOH

Williamson N Oloo et al. J Am Chem Soc. .

Abstract

Inspired by the remarkable chemistry of the family of Rieske oxygenase enzymes, nonheme iron complexes of tetradentate N4 ligands have been developed to catalyze hydrocarbon oxidation reactions using H2O2 in the presence of added carboxylic acids. The observation that the stereo- and enantioselectivity of the oxidation products can be modulated by the electronic and steric properties of the acid implicates an oxidizing species that incorporates the carboxylate moiety. Frozen solutions of these catalytic mixtures generally exhibit EPR signals arising from two S = 1/2 intermediates, a highly anisotropic g2.7 subset (gmax = 2.58 to 2.78 and Δg = 0.85-1.2) that we assign to an FeIII-OOAc species and a less anisotropic g2.07 subset (g = 2.07, 2.01, and 1.96 and Δg ≈ 0.11) we associate with an FeV(O)(OAc) species. Kinetic studies on the reactions of iron complexes supported by the TPA (tris(pyridyl-2-methyl)amine) ligand family with H2O2/AcOH or AcOOH at -40 °C reveal the formation of a visible chromophore at 460 nm, which persists in a steady state phase and then decays exponentially upon depletion of the peroxo oxidant with a rate constant that is substrate independent. Remarkably, the duration of this steady state phase can be modulated by the nature of the substrate and its concentration, which is a rarely observed phenomenon. A numerical simulation of this behavior as a function of substrate type and concentration affords a kinetic model in which the two S = 1/2 intermediates exist in a dynamic equilibrium that is modulated by the electronic properties of the supporting ligands. This notion is supported by EPR studies of the reaction mixtures. Importantly, these studies unambiguously show that the g2.07 species, and not the g2.7 species, is responsible for substrate oxidation in the (L)FeII/H2O2/AcOH catalytic system. Instead the g2.7 species appears to be off-pathway and serves as a reservoir for the g2.07 species. These findings will be helpful not only for the design of regio- and stereospecific nonheme iron oxidation catalysts but also for providing insight into the mechanisms of the remarkably versatile oxidants formed by nature's most potent oxygenases.


Conflict of interest statement

Notes

The authors declare no competing financial interest.

Figures

Figure 1
Figure 1
Top: Ligands used in this study that are proposed to support nonheme FeV(O) intermediates. Bottom: Various metal species involved in this study. The labelling scheme used throughout the text combines numbers that designate the metal species with letters that designate the ligands. For example, for complexes supported by TPA, the (L)FeII complex = 1a, (L)FeIII-OOH = 2a, (L)FeIII-OOAc = 3a, (L)FeIV(O)(OAc) = 4a, and (L)FeV(O)(OAc) = 5a.
Figure 2
Figure 2
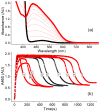
(a) UV-vis spectrum of a catalytic oxidation reaction involving 1a* (1 mM), H2O2 (10 mM), and AcOH (200 mM) in CH3CN at −40 °C showing the formation of 3a*, which is generated in 50 % yield relative to the 1a*. (b) The time traces depict the kinetic time course of 3a* as monitored at 460 nm in the presence of various substrate types and concentrations. A = 250 mM cyclohexadiene; B = 250 mM cyclohexene; C = 250 mM cyclooctene; D = 250 mM 1-octene; E = 125 mM 1-octene; F = 62.5 mM 1-octene; G = 250 mM cyclohexane; H = 250 mM tert-butyl acrylate; I = No substrate. The black half-filled circles representing different 1-octene concentrations demonstrate that the length of the steady state phase is also influenced by this variable.
Figure 3
Figure 3
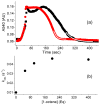
(a) Kinetic time course of 3a (monitored at 540 nm), generated in 20 % yield by adding 20 equiv. of H2O2 (90 % v/v) to a 0.5 mM solution of 1a in CH3CN at −40 °C in the presence of 200 equiv. of AcOH with either no substrate added (black rectangles) or with 50 equiv. 1-octene (red circles). Addition of 1-octene increases the decay rate constant of 3a by a factor of 5. The fitting to obtain the decay rate constant was conducted during the last turnover (upon depletion of HOOH). The decay time course is exponential as the reaction nears completion. The starting points for the exponential fits shown (white line) are chosen well after the transition from the steady state portion of the time course. (b) Correlation between the observed decay rate constants for 3a and 1-octene concentration in the catalytic oxidation of 1-octene using 1a (0.5 mM), H2O2 (10 mM), and AcOH (100 mM) in CH3CN at −40 °C. Note that the kinetic evolution of 3a was monitored at 540 nm, because the 460 nm λmax has significant background contribution from the decay product due to the low yield of 3a. For comparison, the kinetic behavior of 3a* is identical whether followed at its λmax of 460 nm or at 540 nm (Figure S1).
Figure 4
Figure 4
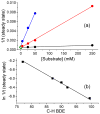
(a) Plot of the inverse length of the steady state duration of 3a* (460 nm) as a function of [cyclohexadiene] (blue), [cyclohexene] (red), and [1-octene] (black) in the 1a* (1 mM)/H2O2 (20 mM)/AcOH (200 mM)/substrate mixture in CH3CN at −40 °C. The point represented by the open diamond at the bottom left corner corresponds to the inverse length of the steady state duration of 3a* in the absence of any substrate. (b) Correlation between the natural log of the inverse length of the steady state for 3a* (460 nm) as a function of C–H bond dissociation energy in the 1a* (1 mM)/H2O2 (20 mM)/AcOH (200 mM)/substrate (250 mM) reaction mixture in CH3CN at −40 °C. Substrates used are from left to right cyclohexadiene, ethylbenzene, toluene, tetrahydrofuran, and cyclohexane.
Figure 5
Figure 5
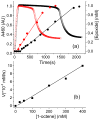
(a) Monitoring the A460 optical chromophore corresponding to 3a* (open squares) and the 1,2-epoxyoctane product yields (filled circles) determined by gas chromatography (GC) as a function of time in the 1a*/H2O2/AcOH/1-octene reaction at −40 °C, with 100 equiv. (black traces) and 400 equiv. (red traces) of 1-octene. The product formation time traces are fit with a linear function (red and black straight lines) to obtain the rate. (b) Plot for the rate of 1,2-epoxyoctane production as a function of [1-octene], in the catalytic oxidation of this substrate using 1a* (0.5 mM), H2O2 (10 mM) and AcOH (100 mM).
Figure 6
Figure 6
(a) EPR spectrum of a frozen mixture of 1a* and AcOOH in CH3CN showing the formation and decay of 3a* at g = 2.58, 2.38, 1.73 (α, 28 %), 5a* at g = 2.07, 2.01, 1.96 (β, 9 %), and 6a* at g = 2.21, 2.16, 1.94 (χ, 4 %) as a function of time. (b) EPR time-trace for 3a* (red boxes), 5a* (black boxes) and 6a* (blue boxes). The black, open circles represent the optical chromophore of 3a*, monitored at the 460 nm wavelength. EPR conditions: T = 20K, 0.2 mW, 1 mT modulation amplitude.
Figure 7
Figure 7
UV-vis spectral evolution of a reaction of 1.5 mM 1a with 5 equiv. of cyclohexane peroxycarboxylic acid (CPCA) in CH3CN/(CH3)2CO (1:1 v/v) at −65 °C. (Inset) EPR spectrum of a sample frozen upon maximum accumulation of the chromophoric species. The black trace is the experimental spectrum, while the red trace is the S = ½ SpinCount simulation with g = 2.07, 2.01, and 1.96 (10 % of total Fe). EPR conditions: T = 20 K, 0.2 mW power, 1 mT modulation.
Figure 8
Figure 8
Addition of 20 equiv. of H2O2 to a 1 mM CH3CN solution of 1a and AcOH (200 equiv.) at −40 °C, showing (TPA)FeIII–OOAc complex 3a (red trace), (TPA)FeIII–OOH complex 2a (purple trace) and (TPA)FeIV=O (green trace), which derives from the decay of both 2a and 3a. Inset: EPR analysis of aliquots of this reaction mixture collected at various time points. EPR signals of 2a (*) and 3a (#) can be observed. Both signals are, however, not present at the end of the reaction. EPR conditions: T = 20 K, 0.2 mW, 1 mT modulation amplitude.
Figure 9
Figure 9
The addition of AcOH (200 equiv.) to 2a (CH3CN, purple trace) generated from a 1 mM CH3CN solution of 1a and H2O2 (10 equiv.) at −40 °C, initiates the decay of 2a (purple trace) and the subsequent formation of 3a (red trace). (Inset) Time trace for the same reaction monitored at 460 nm (red trace), 540 nm (purple trace) and 370 nm (blue trace) wavelengths. The yellow traces in the inset are single exponential fits for the decay of 2a (kobs = 0.17(1) s−1) and formation of 4a (kobs = 0.19(1) s−1). While the decay of 2a is complete within 50 seconds (purple trace), the maximal accumulation of 3a is not complete until 120 seconds (red trace). 3a also possesses an electronic absorption band at 540 nm accounting for the increase in absorption at 540 nm concomitant with the increase at its λmax of 460 nm.
Figure 10
Figure 10
Decay rate constants of 2amax = 540 nm) plotted as a function of [AcOH] at −40 °C. The data are fitted with a hyperbolic function. This fit suggests a 2-step process in which fast reversible binding of AcOH (Kd = 0.17 M) is followed by a slower conversion to another species (4a) at a maximum apparent rate constant of 0.28 s−1. The maximal rate of decay shows that AcOH increases the decay rate of 2a by ~ 900-fold when saturation is achieved.
Figure 11
Figure 11
Black traces represent kinetic time courses of 3a* (460 nm) generated by adding 20 equiv. of H2O2 (90 % v/v) to a 0.5 mM solution of 1a* in CH3CN −40 °C in the presence of 200 equiv. of AcOH and various equivalents of 1-octene. The red traces indicate fits derived from numerical simulation of the experimental data according to the model presented in Scheme 2. The traces from right to left correspond to 0, 50, 100, 200, 400 and 600 equiv. of 1-octene added.
Figure 12
Figure 12
Kinetic trace for the formation and decay of 3a* in the reaction between 1a* and H2O2 (10 equiv.) in the presence of AcOH (200 equiv.) and 50 (black), 150 (red), 500 (blue), and 1000 (green) equivalents of 1,4-cyclohexadiene, demonstrating that the maximum yield of 3a* depends on the amount of 1,4-cyclohexadiene present in solution.
Scheme 1
Scheme 1
Proposed mechanism for the formation of the S = ½ FeIII–OOAc intermediate based on previous DFT calculations., , ,
Scheme 2
Scheme 2
Chemical model used to fit the kinetic evolution of 3a* (460 nm) as a function of 1-octene concentration shown in Figure 11. The unique equilibrium among the components of the catalytic troika, 3, 4 and 5, is highlighted with red. The H/D KIE observed in the reaction of 2 with AcOH (Table 2) would be connected in the k4 step in this scheme.

Similar articles

Cited by

References

    1. Sono M, Roach MP, Coulter ED, Dawson JH. Chem Rev. 1996;96:2841–2887. - PubMed
    1. Solomon EI, Brunold TC, Davis MI, Kemsley JN, Lee SK, Lehnert N, Neese F, Skulan AJ, Yang YS, Zhou J. Chem Rev. 2000;100:235–349. - PubMed
    1. Costas M, Mehn MP, Jensen MP, Que L., Jr Chem Rev. 2004;104:939–986. - PubMed
    1. Kovaleva EG, Lipscomb JD. Nature Chem Biol. 2008;4:186–193. - PMC - PubMed
    1. Barry SM, Challis GL. ACS Catal. 2013;3:2362–2370. - PMC - PubMed

Publication types