. 2017 Nov 13;32(5):574-589.e6.
doi: 10.1016/j.ccell.2017.10.007.

Arid1a Has Context-Dependent Oncogenic and Tumor Suppressor Functions in Liver Cancer

Affiliations

Arid1a Has Context-Dependent Oncogenic and Tumor Suppressor Functions in Liver Cancer

Xuxu Sun et al. Cancer Cell. .

Erratum in

  • Arid1a Has Context-Dependent Oncogenic and Tumor Suppressor Functions in Liver Cancer.
    Sun X, Wang SC, Wei Y, Luo X, Jia Y, Li L, Gopal P, Zhu M, Nassour I, Chuang JC, Maples T, Celen C, Nguyen LH, Wu L, Fu S, Li W, Hui L, Tian F, Ji Y, Zhang S, Sorouri M, Hwang TH, Letzig L, James L, Wang Z, Yopp AC, Singal AG, Zhu H. Sun X, et al. Cancer Cell. 2018 Jan 8;33(1):151-152. doi: 10.1016/j.ccell.2017.12.011. Cancer Cell. 2018. PMID: 29316428 Free PMC article. No abstract available.

Abstract

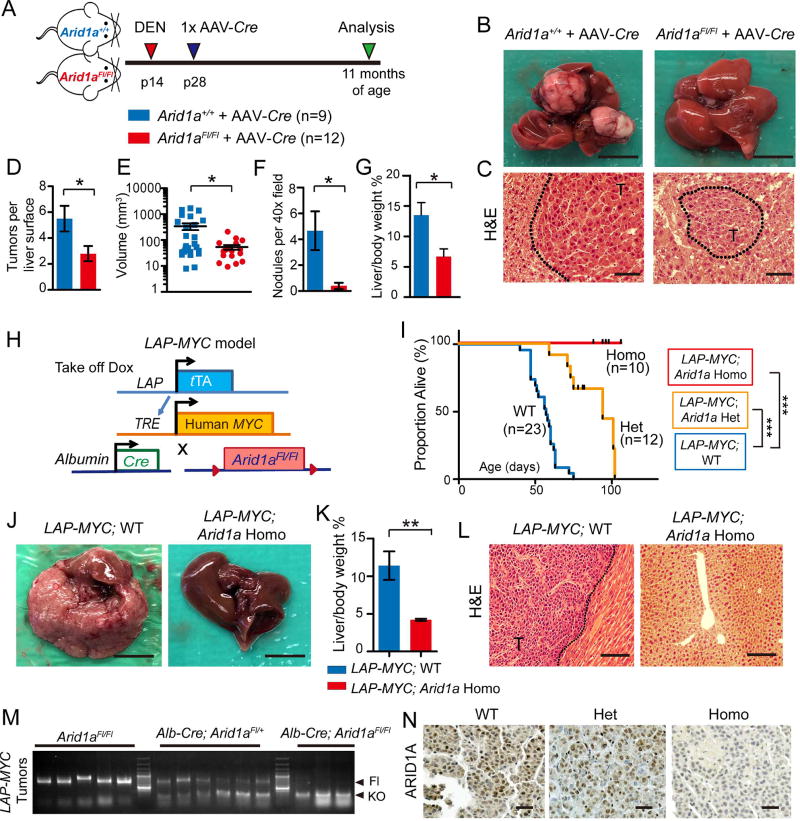
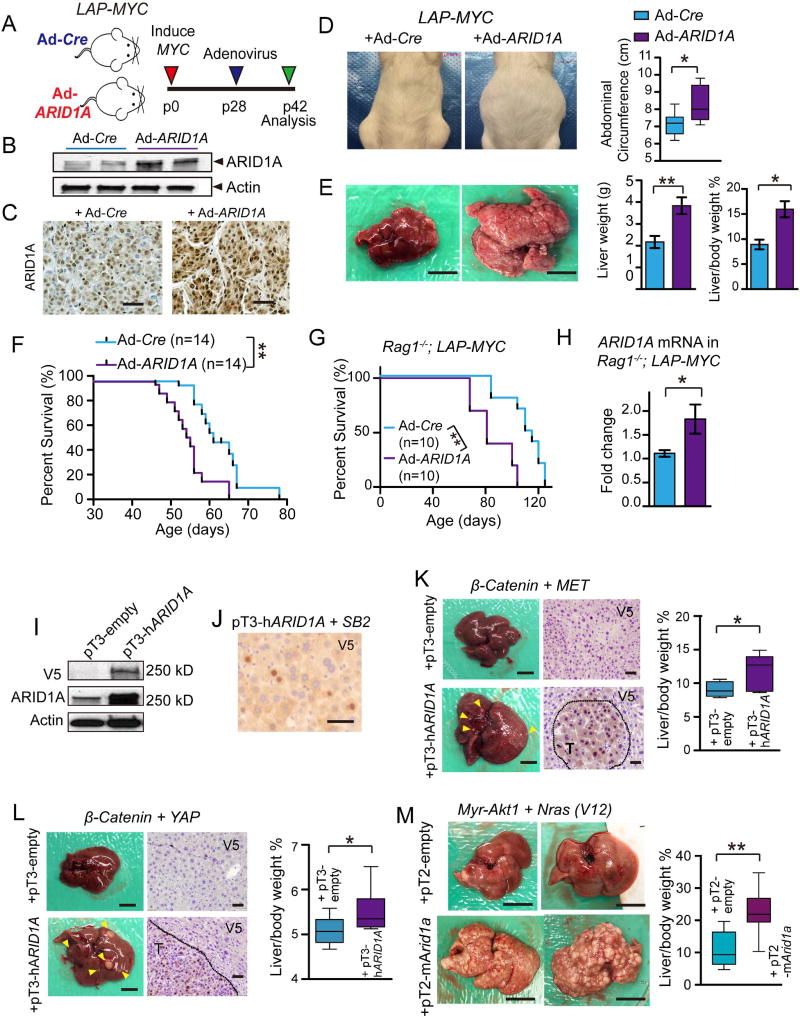
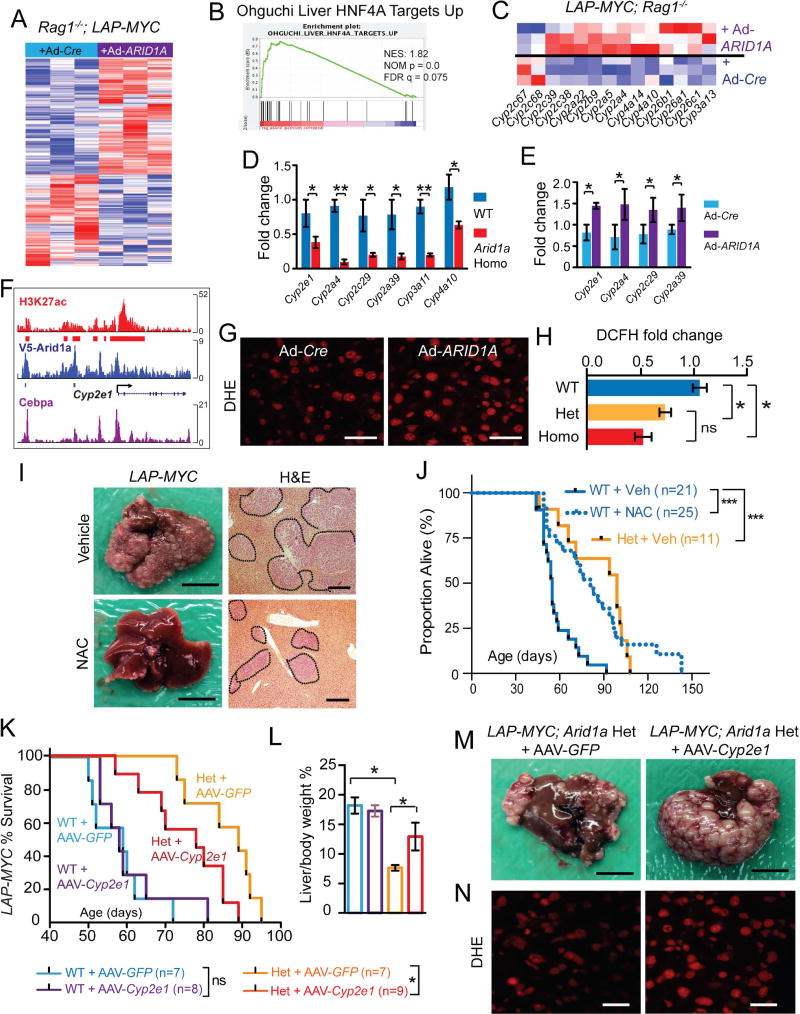
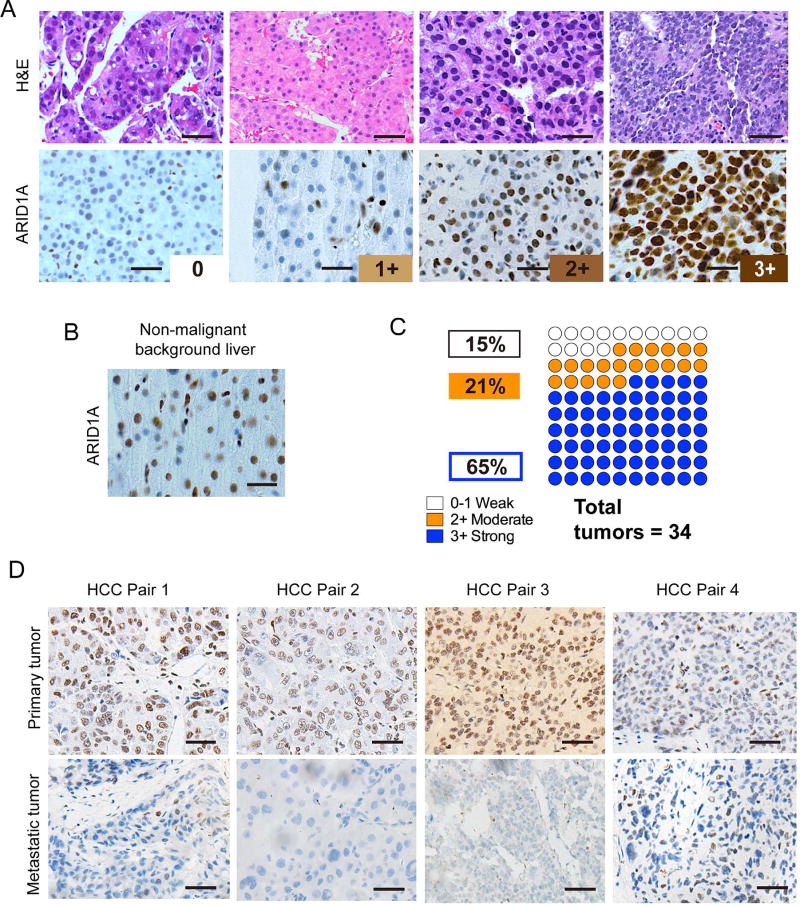
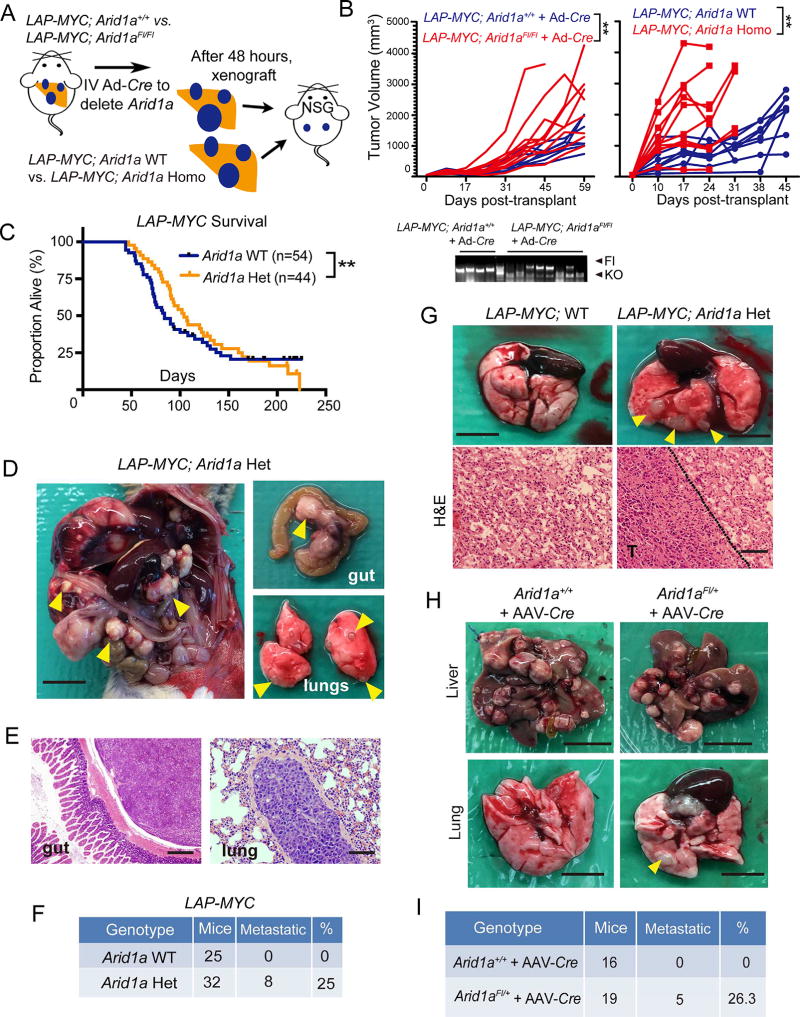
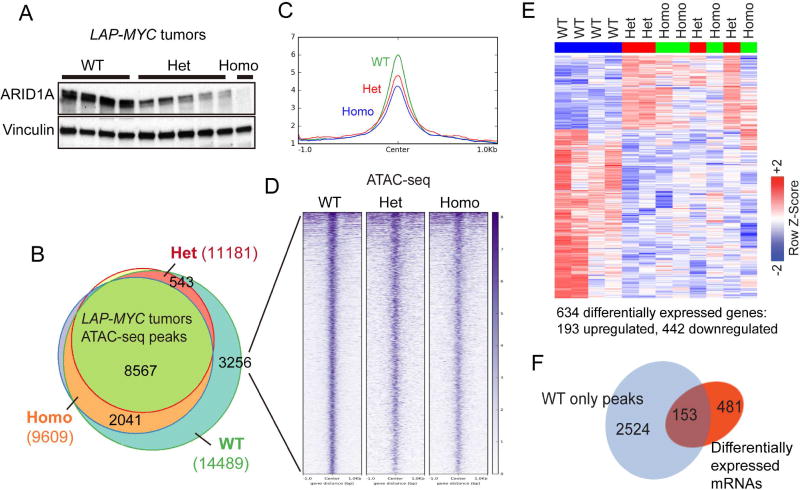
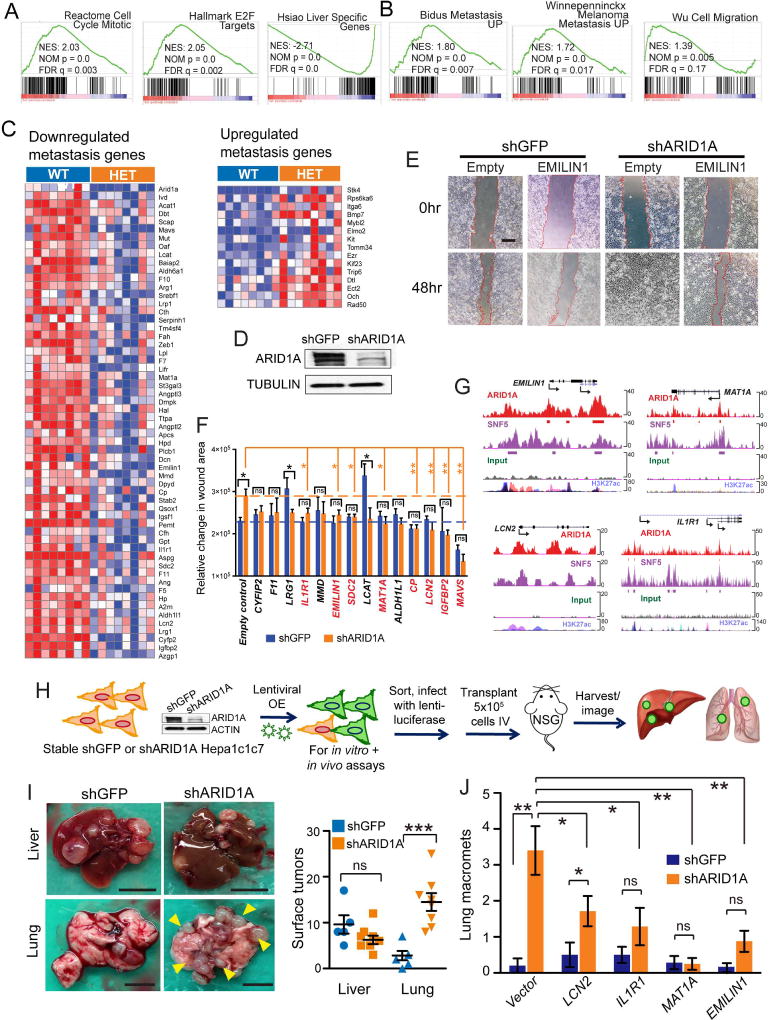
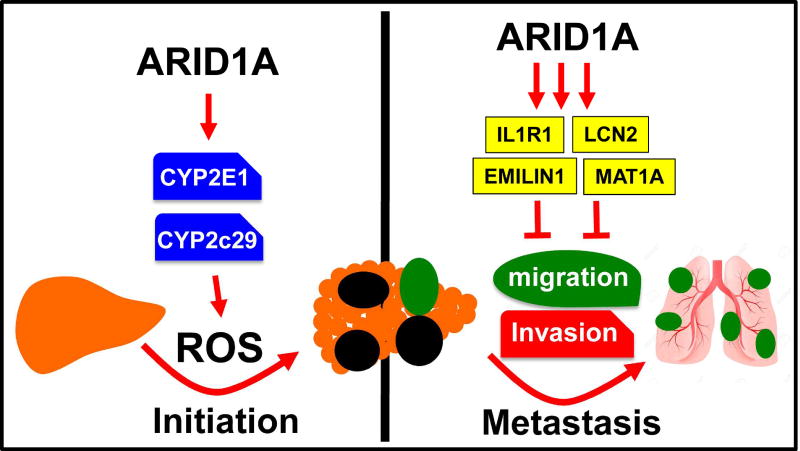
ARID1A, an SWI/SNF chromatin-remodeling gene, is commonly mutated in cancer and hypothesized to be tumor suppressive. In some hepatocellular carcinoma patients, ARID1A was highly expressed in primary tumors but not in metastatic lesions, suggesting that ARID1A can be lost after initiation. Mice with liver-specific homozygous or heterozygous Arid1a loss were resistant to tumor initiation while ARID1A overexpression accelerated initiation. In contrast, homozygous or heterozygous Arid1a loss in established tumors accelerated progression and metastasis. Mechanistically, gain of Arid1a function promoted initiation by increasing CYP450-mediated oxidative stress, while loss of Arid1a within tumors decreased chromatin accessibility and reduced transcription of genes associated with migration, invasion, and metastasis. In summary, ARID1A has context-dependent tumor-suppressive and oncogenic roles in cancer.

Keywords: ARID1A; SWI/SNF chromatin-remodeling complex; epigenetics; hepatocellular carcinoma; metastasis; mouse models.


Figures

Figure 1
Figure 1. Arid1a loss protected against chemical and MYC-induced HCC initiation
(A) Wild-type (WT) and Arid1aFl/Fl (KO) mice were injected with DEN at p14, then Arid1a was deleted with AAV-Cre at p28. 10–11 months after AAV-Cre, the mice were sacrificed. (B) Representative gross image of WT and KO livers. Scale bar = 10 mm. (C) H&E histology of tumor nodules. “T” denotes tumor. Scale bar = 100 µm. (D) Number of visible tumors on liver surface (n = 6 WT and 6 KO mice). (E) Tumor volume (n = 6 WT and 6 KO mice). (F) Quantification of pre-malignant or malignant nodules on H&E sections (n = 6 WT and 6 KO mice, three 40x fields/per mouse). (G) Liver to body weight ratios (n = 6 WT and 6 KO mice). (H) Schema to generate LAP-MYC; Arid1a WT, Het, and Homo mice. (I) Kaplan-Meier curves of LAP-MYC; Arid1a WT, Het, and Homo mice on a pure FVB background. (J) Representative gross images of LAP-MYC; Arid1a WT and Homo livers at p49. Scale bar = 10 mm. (K) Liver to body weight ratios (n = 7 WT and 9 Homo mice) (L) H&E histology of tumor and normal adjacent tissue at p49. “T” denotes tumor. Scale bar = 200 µm. (M) This genotyping protocol is used to detect Arid1a WT, floxed, and exon 8 excision mediated by Cre within LAP-MYC tumors. (N) ARID1A IHC in LAP-MYC; Arid1a WT, Het, and Homo tumors. Scale bar = 100 µm. Two-tailed Student’s t-tests (two-sample equal variance) were used to test the significance of differences between two groups. Kaplan-Meier method was used to estimate survival curves, which were compared using the log-rank test. All data in this figure are represented as mean ± SEM, * (p < 0.05), ** (p < 0.01), *** (p < 0.001). See also Figure S1.
Figure 2
Figure 2. ARID1A overexpression accelerated oncogenesis in multiple HCC models
(A)LAP-MYC mice injected at p28 with adenovirus carrying Cre recombinase (Ad-Cre) or human ARID1A (Ad-ARID1A) under a CMV promoter and sacrificed at p42. (B) Western blot of liver tissues from LAP-MYC mice 5 days after Ad-Cre or Ad-ARID1A injection. Antibody detects human and mouse ARID1A proteins. (C)ARID1A IHC in LAP-MYC tumors. Scale bar = 100 µm. (D) Girth of LAP-MYC abdomens injected with Ad-Cre or Ad-ARID1A. Box plots show the minimum, lower quartile, median, upper quartile, and maximum abdominal circumference values (n = 6 and 7 mice, respectively). (E) Gross images of LAP-MYC livers injected with Ad-Cre or Ad-ARID1A. Liver weights and liver to body weight ratios quantified on the right (n = 6 and 6 mice). Scale bar = 10 mm. (F) Kaplan-Meier curve of LAP-MYC mice injected with Ad-Cre or Ad-ARID1A. (G) Kaplan-Meier curve of immunodeficient Rag1−/−; LAP-MYC mice injected with Ad-Cre or Ad-ARID1A. (H)ARID1A expression in Rag1−/−; LAP-MYC livers 14 days after adenovirus injection, as measured by qPCR. (I) ARID1A protein expression in H2.35 cells as measured by V5 and ARID1A antibodies. Sleeping Beauty transposase (SB2) construct and pT3-hARID1A transposon were co-transfected using standard methods. (J) V5 Immunostaining for V5-ARID1A 7 days after HDT in WT livers. Scale bar = 50 µm. (K) Gross images from pT3-β-Catenin + pT3-MET +/− pT3-hARID1A experiment 23 days after HDT (n = 4 pT3-empty and 10 pT3-hARID1A). Scale bar = 10 mm. V5 staining shows exogenous ARID1A expression. Scale bar = 100 µm. On the right, box plots show the minimum, lower quartile, median, upper quartile, and maximum liver vs. body weight ratios. (L) Images from pT3-β-Catenin + pT3-YAP +/− pT3-hARID1A experiment 23 days after HDT (n =7 and 7). Scale bar = 10 mm. V5 staining shows exogenous ARID1A expression. Scale bar =100 µm. On the right, box plots show the minimum, lower quartile, median, upper quartile, and maximum liver vs. body weight ratios. (M) Images from pT3-Myr-Akt1 + pT3-Nras(V12) +/− pT2-mArid1a experiment 28 days after HDT (n = 9 pT2-empty and 10 pT2-mArid1a). Scale bar = 10 mm. On the right, box plots show the minimum, lower quartile, median, upper quartile, and maximum liver vs. body weight ratios. Two-tailed Student’s t-tests (two-sample equal variance) were used to test the significance of differences between two groups. Kaplan-Meier method was used to estimate survival curves, which were compared using the log-rank test. All data in this figure are represented as mean ± SEM, * (p < 0.05), ** (p < 0.01). See also Figure S2.
Figure 3
Figure 3. ARID1A drives oxidative stress via CYP450 expression, thereby promoting MYC induced liver cancers
(A) Differentially expressed genes from an RNA-seq experiment comparing normal liver tissues from Rag1−/−; LAP-MYC + Ad-Cre and Ad-ARID1A overexpression (n = 3 and 3 mice, red is higher and blue is lower expression). (B) GSEA for Hnf4a target gene enrichment in ARID1A overexpressing livers. (C) Differentially expressed CYP450 family genes. (D)CYP450 mRNA levels in LAP-MYC; Arid1a WT and Homo livers (n = 6 and 6 livers), as measured by qPCR. (E)CYP450 mRNA levels in ARID1A overexpressing livers that are expressing MYC (n = 6 and 6 livers), as measured by qPCR. (F) ChIP-seq tracks on the murine Cyp2e1 locus for H3K27ac (marking active enhancers and promoters), V5-ARID1A, and Cebpα (a known transcriptional activator of CYPs). Red and blue mark significant peaks over input. (G) ROS levels in LAP-MYC + Ad-Cre vs. Ad-ARID1A livers, as measured by the DHE assay. Scale bar = 50 µm. (H) ROS intensity fold change from DCFH-DA assays performed in normal hepatocytes from LAP-MYC; Arid1a WT, Het, and Homo mice. (I) Representative gross images of LAP-MYC; Arid1a WT livers treated with vehicle or NAC and sacrificed at p45. Scale bar = 10 mm. Histology of LAP-MYC; Arid1a WT livers treated with vehicle or NAC. Tumor are outlined (n = 6 and 6 mice). Scale bar = 500 µm. (J) Kaplan-Meier plot of LAP-MYC; WT and Arid1a Het mice treated with vehicle or NAC. (K) Kaplan-Meier plot of LAP-MYC; WT and Arid1a Het mice treated with AAV-GFP or AAV-Cyp2e1. (L) Liver to body weight ratios for LAP-MYC; Arid1a WT and Het mice treated with AAV-GFP or AAV-Cyp2e1 and sacrificed at p56. (M) Representative gross images of LAP-MYC; Arid1a Het mice + AAV-GFP or AAV-Cyp2e1, sacrificed at p56. Scale bar = 10 mm. (N) Representative fluorescent images of livers from these mice, as measured by DHE assay. Scale bar = 50 µm. Two-tailed Student’s t-tests (two-sample equal variance) were used to test the significance of differences between two groups. Kaplan-Meier method was used to estimate survival curves, which were compared using the log-rank test. All data in this figure are represented as mean ± SEM, * (p < 0.05), ** (p < 0.01), *** (p < 0.001). See also Figure S3 and Table S1.
Figure 4
Figure 4. ARID1A expression in human HCC
(A) Representative H&E histology and ARID1A staining in human HCC samples, scored as 0 (none), 1+ (weak), 2+ (moderate), and 3+ (strong). Scale bar = 100 µm. (B) Representative picture of adjacent non-malignant liver showing 1 to 2+ ARID1A staining. Scale bar = 100 µm. (C) Proportion of human HCC with each level of ARID1A staining. (D) ARID1A staining in human primary HCC and metastatic samples. 21 paired samples were analyzed, and four representative pairs with loss of expression in metastases are shown. Scale bar = 100 µm. See also Figure S4 and Table S2.
Figure 5
Figure 5. Homozygous and heterozygous loss of Arid1a in established liver cancers promoted progression and metastasis
(A) Schema for assessing the influence of Arid1a loss in established tumors. LAP-MYC; Arid1a+/+ or Arid1aFl/Fl mice were given Ad-Cre (2 × 10⁹ PFU/mouse delivered IV) after tumors were established in the endogenous model. Tumor fragments were transplanted into NSG flanks and growth was measured. A second approach involved transplanting established LAP-MYC; Arid1a WT or Arid1a Homo (Alb-Cre mediated) tumors. (B) Growth rate of tumor fragments (n = 10 tumors in each group were measured and each line represents one tumor). Tumor genotyping for Arid1a locus shown below for the Ad-Cre experiment. (C) Kaplan-Meier plot of LAP-MYC; WT and Arid1a Het mice in the mixed strain background. (D)LAP-MYC; Arid1a Het mice developed metastases to the peritoneum, mesenteric lymph nodes, and lungs (yellow arrowheads). Scale bar = 10 mm. (E) Histology of gut (40x, scale bar = 500 µm) and lung (200x, scale bar = 100 µm) metastases from LAP-MYC; Arid1a Het mice. (F) Mice with distant metastases in the LAP-MYC model. Intrahepatic metastases were not included. (G) Gross (Scale bar = 5 mm) and H&E images (Scale bar = 200 µm) of lung metastases from NSG mice injected IV with LAP-MYC; Arid1a WT or Het cancer cells. (H) Tumor burden in livers and lungs of Arid1a+/+ and Arid1aFl/+ mice given DEN at p14 and AAV-Cre at p28. Mice were examined at 11 months of age. Scale bar = 10 mm for livers and scale bar = 5 mm for lungs. (I) Mice with distant metastases in the DEN model. Intrahepatic metastases were not included. Kaplan-Meier method was used to estimate survival curves, which were compared using the log-rank test. All data in this figure are represented as mean ± SEM, ** (p < 0.01). See also Figure S5.
Figure 6
Figure 6. Partial and complete Arid1a loss increased chromatin occupancy and altered gene expression to similar extents
(A) ARID1A protein expression in LAP-MYC tumors. (B) ATAC-seq peaks in LAP-MYC; Arid1a WT (n = 4), Het (n = 4), and Homo (n = 3) tumors. Total peaks called are in parentheses. (C) 3256 ATAC-seq peaks uniquely called in WT tumors are visualized here. (D) The global view of chromatin accessibility for these 3256 tracks. (E) RNA-seq of LAP-MYC; Arid1a WT (n = 4), Het (n = 4), and Homo (n = 4) tumors from pure FVB mice. Of 634 differentially expressed genes, 193 were up and 442 were downregulated. (F) ATAC-seq peaks for 153 genes that are differentially expressed after Arid1a loss. See also Table S3.
Figure 7
Figure 7. Arid1a haploinsufficiency promoted gene expression programs that supported cell migration, invasion, and distant lung colonization
(A) GSEA for upregulation of cell cycle and E2F target gene pathways and downregulation of liver-specific genes. (B) GSEA showed upregulation of metastasis and cell migration pathways. (C) Differentially expressed genes associated with metastasis from mixed strain background LAP-MYC; Arid1a WT and Het tumors (n = 8 and 8 mice, red is higher and blue is lower expression). (D) Knockdown of ARID1A protein with shRNAs in human Huh7 HCC cells. (E) In vitro migration assay for shGFP and shARID1A in Huh7, with empty vector and EMILIN1 cDNA lentiviral overexpression. 40x images show wound size at time 0 and 48 hr after scratch. Scale bar = 500 µm. (F) Relative change in area covered by cells between time 0 and 48 hr. (G) ChIP-Seq data showing binding of EMILIN1 MAT1A, LCN2, and IL1R1 loci by ARID1A and SNF5 over input in human HepG2 hepatoma cells (data from Raab et al.). (H) Schema for evaluation of metastasis suppressor genes. Murine Hepa1c1c7 cells with shARID1A knockdown and lentiviral rescue were transplanted IV into NSG mice, then organs were harvested and luciferase imaged after 6 weeks. (I) Gross images of tumor burden in the livers and lungs of NSG mice 6 weeks after Hepa1c1c7 cells were injected IV. On right, number of gross tumors on organ surfaces (n = 5 mice for shGFP, n = 8 mice for shARID1A). Scale bar = 10 mm for livers and scale bar = 5 mm for lungs. (J) Quantification of lung macromets from n = 5 (shGFP) and 7 (shARID1A) mice per group. Two-tailed Student’s t-tests (two-sample equal variance) were used to test the significance of differences between two groups. All data in this figure are represented as mean ± SEM, * (p < 0.05), ** (p < 0.01), *** (p < 0.001). See also Figure S6 and Table S4.
Figure 8
Figure 8. Model for oncogenic and tumor suppressive activities of ARID1A

Comment in

Similar articles

Cited by

References

    1. Beer S, Komatsubara K, Bellovin DI, Kurobe M, Sylvester K, Felsher DW. Hepatotoxin-induced changes in the adult murine liver promote MYC-induced tumorigenesis. PLoS ONE. 2008;3:e2493. doi: 10.1371/journal.pone.0002493. - DOI - PMC - PubMed
    1. Chow EK-H, Fan L-L, Chen X, Bishop JM. Oncogene-specific formation of chemoresistant murine hepatic cancer stem cells. Hepatology. 2012;56:1331–1341. doi: 10.1002/hep.25776. - DOI - PMC - PubMed
    1. Dagenais M, Dupaul-Chicoine J, Douglas T, Champagne C, Morizot A, Saleh M. The Interleukin (IL)-1R1 pathway is a critical negative regulator of PyMT-mediated mammary tumorigenesis and pulmonary metastasis. Oncoimmunology. 2017;6:e1287247. doi: 10.1080/2162402X.2017.1287247. - DOI - PMC - PubMed
    1. Danussi C, Petrucco A, Wassermann B, Modica TME, Pivetta E, Del Bel Belluz L, Colombatti A, Spessotto P. An EMILIN1-negative microenvironment promotes tumor cell proliferation and lymph node invasion. Cancer Prev Res (Phila) 2012;5:1131–1143. doi: 10.1158/1940-6207.CAPR-12-0076-T. - DOI - PubMed
    1. Fujimoto A, Totoki Y, Abe T, Boroevich KA, Hosoda F, Nguyen HH, Aoki M, Hosono N, Kubo M, Miya F, Arai Y, Takahashi H, Shirakihara T, Nagasaki M, Shibuya T, Nakano K, Watanabe-Makino K, Tanaka H, Nakamura H, Kusuda J, Ojima H, Shimada K, Okusaka T, Ueno M, Shigekawa Y, Kawakami Y, Arihiro K, Ohdan H, Gotoh K, Ishikawa O, Ariizumi S-I, Yamamoto M, Yamada T, Chayama K, Kosuge T, Yamaue H, Kamatani N, Miyano S, Nakagama H, Nakamura Y, Tsunoda T, Shibata T, Nakagawa H. Whole-genome sequencing of liver cancers identifies etiological influences on mutation patterns and recurrent mutations in chromatin regulators. Nature Genetics. 2012;44:760–764. doi: 10.1038/ng.2291. - DOI - PubMed

MeSH terms