. 2017 Nov 13;32(5):608-623.e9.
doi: 10.1016/j.ccell.2017.10.004.

A Paradoxical Tumor-Suppressor Role for the Rac1 Exchange Factor Vav1 in T Cell Acute Lymphoblastic Leukemia

Affiliations

A Paradoxical Tumor-Suppressor Role for the Rac1 Exchange Factor Vav1 in T Cell Acute Lymphoblastic Leukemia

Javier Robles-Valero et al. Cancer Cell. .

Abstract

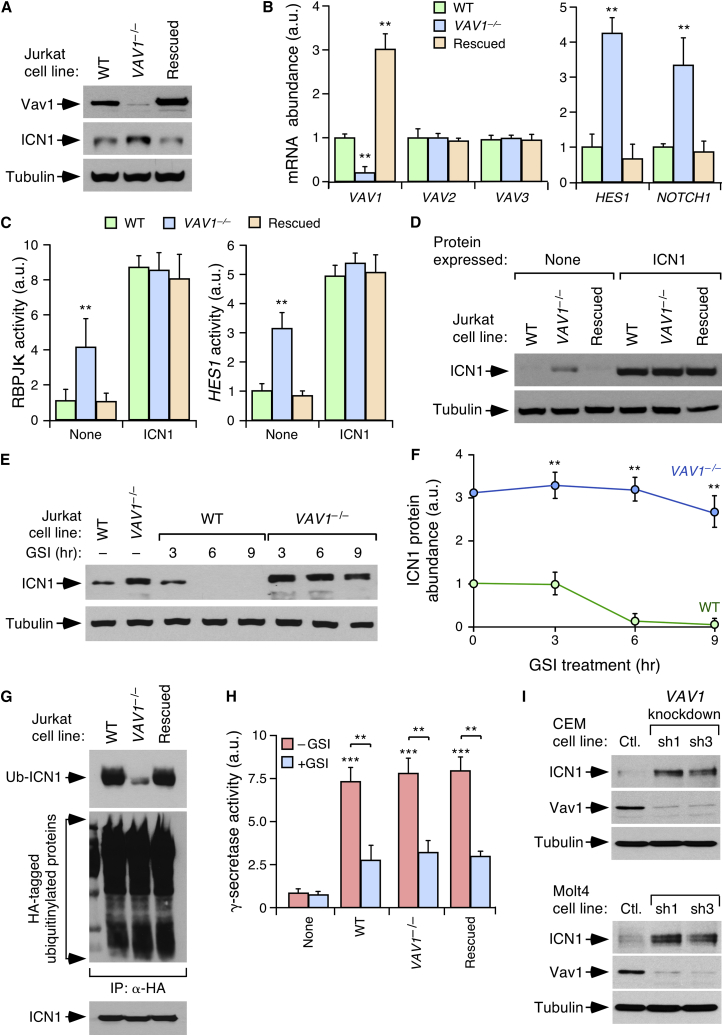
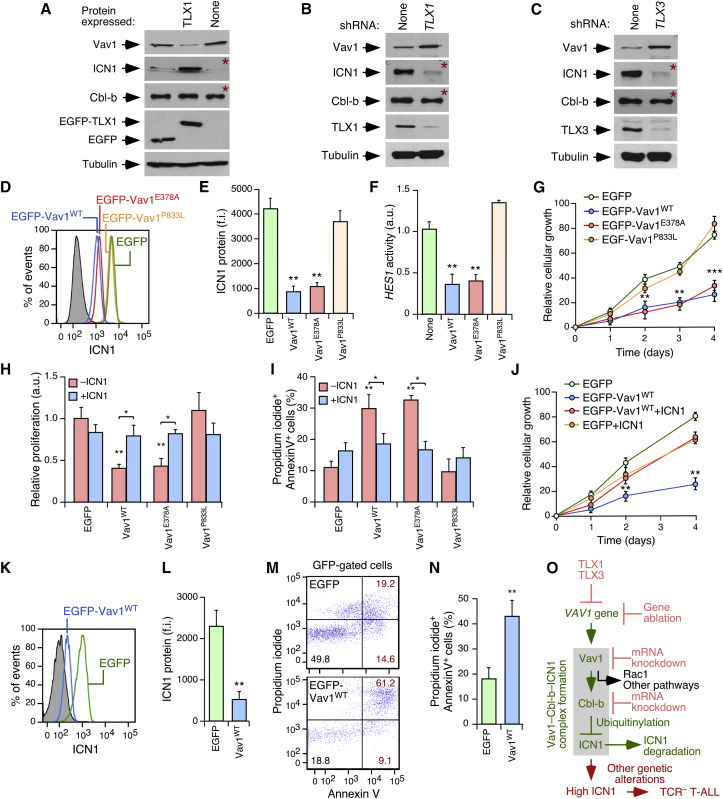
Rho guanine exchange factors (GEFs), the enzymes that stimulate Rho GTPases, are deemed as potential therapeutic targets owing to their protumorigenic functions. However, the understanding of the spectrum of their pathobiological roles in tumors is still very limited. We report here that the GEF Vav1 unexpectedly possesses tumor-suppressor functions in immature T cells. This function entails the noncatalytic nucleation of complexes between the ubiquitin ligase Cbl-b and the intracellular domain of Notch1 (ICN1) that favors ICN1 ubiquitinylation and degradation. Ablation of Vav1 promotes ICN1 signaling and the development of T cell acute lymphoblastic leukemia (T-ALL). The downregulation of Vav1 is essential for the pathogenesis of human T-ALL of the TLX+ clinical subtype, further underscoring the suppressor role of this pathway.

Keywords: Cbl-b; Notch1; Rho GTPases; TLX; animal models; gene expression profiling; lymphoma.


Figures

None
Graphical abstract
Figure 1
Figure 1
Vav1 Deficiency Promotes Immature T Cell Tumors in Mice (A) Survival rates of mice of indicated genotypes upon DMBA administration. (B) Surface immunophenotype of thymocytes from control and Vav1−/− mice (top two panels) and from representative cases of the main pathological classes found in tumor-bearing Vav1−/− mice (other panels). Numbers in each quadrant indicate the relative percentage of each cell population. (C) Summary of tumor types obtained at the time of the death of mice. (D) Flow cytometry of DN-gated thymocytes from a healthy (not treated with DMBA) and a DN tumor-bearing (DMBA-treated) Vav1−/− mouse upon staining with antibodies to CD44 and CD25. Similar data were obtained in 15 independent determinations. (E) Flow cytometry showing percentages of cells staining positive for intracellular TCRβ (ic, blue) and membrane TCRβ (m, red) in the DN2 (two left panels) and the total DN population (right panel) from a healthy (not treated with DMBA) and a DN tumor-bearing (DMBA-treated) Vav1−/− mouse. Similar data were obtained in 15 independent determinations of DN tumor-bearing mice. (F) Flow cytometry of CD8-gated thymocytes from a healthy (not treated with DMBA) and a CD8+ tumor-bearing (DMBA-treated) Vav1−/− mouse upon staining with antibodies to CD24 and TCRβ. Similar data were obtained in 40 independent determinations of CD8+ tumor-bearing mice. Imm, immature ISP cells; Mat, mature cytotoxic T cells. (G) Flow cytometry showing percentage of immature single positive (ISP) and CD8+ cytotoxic T (Tc) cells staining positive for icTCRβ (blue) and mTCRβ (red) in indicated cell populations of a healthy (not treated with DMBA) and a CD8+ tumor-bearing (DMBA-treated) Vav1−/− mouse. Similar data were obtained in 40 independent determinations of CD8+ tumor-bearing mice. (H) Scheme of T cell differentiation showing stages (red) and developmental blocks (crosses) detected in tumors from Vav1−/− mice. The steps dependent on canonical Vav1 functions are in green. DP, double-positive (CD4+CD8+) cells; TH, CD4+ helper T cells. See also Figures S1 and S2.
Figure 2
Figure 2
Vav1−/− Tumors Show Notch1-like Functional Features (A) Transcripts commonly upregulated (red) and downregulated (blue) in the DN and CD8+ tumors arising in DMBA-treated Vav1−/− mice. As comparative control, we used thymocytes from untreated Vav1−/− mice (No tumor). Rows represent independent replicas. Total number of transcripts is indicated at the bottom. (B) Heatmap of upregulated and downregulated “common” Vav1−/− tumor gene signatures enrichment scores calculated using ssGSEA for transcriptomes of thymocytes from WT mice or from nontumorigenic (NT) and preleukemic (PL) Zfp36l1−/−;Zfp36l2−/− mice. Samples with a high signature fit are indicated by vertical black bars. Enrichment scores are depicted on a dark blue (lowest) to dark red (highest) scale. (C) Box plot of the “common” Vav1−/− tumor gene signature fit score in indicated experimental groups. Boxes represent the central 50% of the data (from the lower 25th percentile to the upper 75th percentile), lines inside boxes represent the median (50th percentile), and whiskers are extended to the most extreme data point that is no more than 1.5 times the interquartile range from the box edge. ∗∗∗p ≤ 0.001 (according to Tukey's honest significance difference [HSD] test). (D and E) GSEA for the “common” Vav1−/− tumor gene expression matrix (D and E; left graphs) using as gene sets the differentially expressed genes from Zfp36l1−/−; Zfp36l2−/− mice (D) and ICN1-transformed CD4+CD8+TCRα/β+ cells (E). The expression profile of the top 25 leading-edge genes in the upregulated (D and E; right top clusters) and downregulated (D and E; right bottom clusters) gene sets in the transcriptome of thymocytes from healthy (No tumor), DN tumor-bearing (DN tumor), and CD8+ tumor-bearing (CD8+ tumor) Vav1−/− mice is shown. The normalized enrichment scores (NES) and false discovery rate values (FDR, using q values) are indicated inside each GSEA graph. q-val, q value. (F) Abundance of indicated transcripts (bottom) in unfractionated thymic cells from control and tumor-bearing mice (segregated according to the immunophenotype of tumor cells). Values are given relative to the expression of each transcript in samples obtained from WT controls (n = 15 animals per class analyzed). (G) Flow-cytometry determination of ICN1 abundance in samples from indicated mouse cohorts. Each point represents the measurement of an individual mouse (n = 13 [WT − DMBA], 13 [Vav1−/− − DMBA], 9 [WT + DMBA, no tumor], 7 [WT + DMBA, tumor positive], and 13 [Vav1−/− + DMBA, tumor positive] animals). (H) Western blot (WB) showing abundance of ICN1 (top) and tubulin α (loading control, bottom) in total thymic extracts from indicated mice and experimental conditions. (I) Flow-cytometry determination of ICN1 abundance in indicated cell populations (bottom) and animal cohorts (inset). f.i., mean fluorescence intensity relative to the isotype-matched control antibody. In (F), (G), and (I), data represent the mean ± SEM. Statistical values obtained using either the Student’s t test (F and I) or Mann-Whitney test (G) are given relative to untreated WT controls or indicated experimental pairs (in brackets). p ≤ 0.05, ∗∗p ≤ 0.01, ∗∗∗p ≤ 0.001. See also Figure S3; Tables S1 and S2.
Figure 3
Figure 3
Vav1−/− T-ALL Is Notch1 Dependent (A) Survival curves of DMBA-treated Vav1−/− mice with (n = 5) and without (n = 4) DAPT administration (treatment period shaded in gray). (B) Proliferation of indicated tumor cell clones (Cl1–Cl4, see inset for color code) from Vav1−/− mice in the presence of either OP9-GFP or OP9-DL1 cell layers. The immunophenotype of each clone is indicated in the inset. Similar results were obtained with 3 and 6 independent clones of the DN and CD8+ immunophenotype, respectively. (C) Scheme of the experiments performed in (D). (D) Survival curves of WT mice upon serial injections of indicated Vav1−/− T-ALL clones (n = 5 per clone). Clones 1–4 are those shown in (B). Clone 5 (Cl5) is an additional CD8+ tumor cell clone. The number (x) and cycle of injection (y) of each clone are indicated using the notation Clx.y. (E) Number and percentage of Vav1−/− DN and CD8+ T-ALL clones that recreated the T-ALL in passage 1 according to flow-cytometry analyses carried out in indicated tissues of terminally ill recipient animals. (F) Detection of T-ALL in mice injected with DN (n = 9) and CD8+ (n = 11) tumor cells in the indicated tissues based on CD4 and CD8 expression. (G) Survival of Vav1−/− T-ALL cell clones cultured on OP9-DL1 cells either in the absence (+DMSO) or presence of Compound E (+Comp. E). Inset shows the abundance of ICN1 in one of these clones (Cl3) upon isolation from mice (1), culturing on OP9-DL1 cells (2), and after 5 days of Compound E treatment (3). In (B) and (G), data represent mean ± SEM. p ≤ 0.05, ∗∗p ≤ 0.01, ∗∗∗p ≤ 0.001 relative to time-0 controls (Student's t test).
Figure 4
Figure 4
Vav1 Regulates ICN1 Degradation (A) Abundance of Vav1, ICN1, and tubulin α in total cellular lysates (TCL) from indicated cells. Rescued, a stable pool of VAV1−/− Jurkat cells in which Vav1WT was re-expressed. (B) Abundance of selected mRNAs in indicated Jurkat cells (n = 3). (C) Activity of RBPJκ-responsive (left) and HES1 (right) promoters in indicated cells. Values are given relative to WT cells (n = 3). (D) Abundance of endogenous and ectopic ICN1 in TCLs from cells used in (C) (upper panel). Endogenous tubulin α was used as loading control (bottom panel). (E) Abundance of ICN1 (top) and tubulin α (bottom) in TCLs from indicated cells and conditions (n = 3). (F) Quantification of ICN1 abundance according to the data gathered in (E) (n = 3). (G) Cellular extracts from Jurkat cells coexpressing HA-ubiquitin and ICN1 were immunoprecipitated (IP) with antibodies to HA to determine the amount of ubiquitinylation of ectopic ICN1 (top) and endogenous proteins (middle) by immunoblot. Equal amounts of ICN1 expression in cells were confirmed by WB analysis using TCLs (bottom) (n = 3). Top and bottom panels were blotted with antibodies to ICN1. Middle panel was blotted with antibodies to the HA epitope. Ub, ubiquitinylated. (H) Presenilin activity in indicated Jurkat cells (bottom) and assay conditions (inset) (n = 3). (I) Abundance of endogenous ICN1 in TCLs from CEM (top panels) and Molt4 (bottom panels) cells expressing a control (Ctl.) or two independent (sh1 and sh3) VAV1 shRNAs (n = 3). In (B), (C), (F), and (H), data represent mean ± SEM. ∗∗p ≤ 0.01, ∗∗∗p ≤ 0.001 using Student's t test (B, C, and F) and Mann-Whitney test (H). See also Figure S4.
Figure 5
Figure 5
Vav1 Modulates ICN1 in a Cbl-b-Dependent Manner (A) Vav1 mutants used (point mutations depicted as open circles). The minimal region for the Vav1-dependent regulation of the Notch1 route is shaded in blue. (B) HES1 promoter activity of VAV1−/− Jurkat cells expressing the indicated EGFPs (bottom) (n = 5). (C) HES1 promoter activity in nonstimulated (−α-CD3) and stimulated (+α-CD3) WT and TCRmut Jurkat cells expressing the indicated EGFPs (bottom) (n = 3). (D) Abundance of ICN1, tubulin α, and Cbl-b in Jurkat cells expressing a control (Ctl.) and four independent (sh1 to sh4) CBLB shRNAs. Determinations were done by WB using either TCLs (ICN1, tubulin α) or immunoprecipitated Cbl-b. +Cbl-b, WT Jurkat cells ectopically expressing Cbl-bWT (n = 3). (E) Abundance of indicated transcripts in cells used in these experiments (n = 3). Cells are designated as in (D). (F) Structure of Cbl-b and localization of the Y363F mutation. TKB, tyrosine kinase binding domain; RING, RING domain; UBA, ubiquitin-associated region. (G) HES1 promoter activity in indicated cells upon transfection with an empty vector (None) or plasmids expressing indicated Cbl-b proteins (n = 3). Cells are designated as in (D). (H) ICN1 ubiquitinylation in indicated cells following the approach described in Figure 4G (n = 3). KD, knockdown. (I) Detection of endogenous Vav1 (top panel) and Cbl-b (middle panel) in immunoprecipitates of ICN1 (bottom panel) in indicated Jurkat cells. In (B), (C), (E), and (G), data represent mean ± SEM. ∗∗p ≤ 0.01 (Student’s t test). See also Figure S5.
Figure 6
Figure 6
Structural Requirements for Vav1-Cbl-b-ICN1 Complex Formation (A) CoIP of Vav1 proteins with Cbl-b in Jurkat cells ectopically expressing the indicated combinations of proteins (top). Amount of immunoprecipitated Cbl-b was assessed by reblotting the same filter with antibodies to Cbl-b (third panel from top). Expression of ectopic Vav1 proteins (fourth and fifth panels from top) and endogenous tubulin α (loading control, bottom panel) was determined by WB using aliquots of the TCLs used in the immunoprecipitation step. (B) Depiction of the Cbl-b mutants used in these experiments. Mutations are shown as open circles. (C) CoIP of Vav1 with indicated Cbl-b proteins (top) in Jurkat cells. Controls for the immunoprecipitation and expression of proteins were done as indicated in (A). (D) CoIP of Vav1 proteins with ICN1 in Jurkat cells ectopically expressing the indicated combinations of proteins (top). Amount of immunoprecipitated ICN1 was assessed by reblotting the same filter with antibodies to ICN1. Expression of ectopic Vav1 proteins and endogenous tubulin α (loading control) was determined as in (A). Asterisk marks the tubulin α band from the previous immunoblot of the same filter. (E) Depiction of ICN1 mutants used in these experiments. TM, transmembrane; NLS, nuclear localization signal; TAD, transactivation domain. The domain whose deletion leads to loss of Vav1 binding is shaded in light blue. (F) CoIP of Vav1 with ICN1 mutant proteins in Jurkat cells expressing the indicated combinations of proteins (top). Controls for the immunoprecipitation and expression of proteins were done as indicated in previous panels. Asterisks in the second and third panels from the top indicate the immunoglobulin G band of the antibody to ICN1 and the ICN1 band remaining from the previous immunoblot of the same filter, respectively. (G) CoIP of Cbl-b and indicated Vav1 mutant proteins with ICN1 in WT and VAV1−/− Jurkat cells. Controls for the immunoprecipitation and expression of proteins were done as indicated in previous panels. lo and hi refer to a low and a high exposure of the same film, respectively. (H) CoIP of Vav1 with ICN1 in WT and CBLB knockdown (clone #sh1) Jurkat cells. Controls for the immunoprecipitation and expression of proteins were done as in previous panels. (I) Summary of the interactions found in these experiments. Direct coIP and catalytic interactions are shown using black and gray arrows, respectively. Ub, ubiquitinylation. See also Figure S6.
Figure 7
Figure 7
Vav1 Is Downmodulated in TLX+ T-ALL (A) Heatmap of indicated mRNAs (left) in T-ALL dataset 1. The identification number (left) and molecular subtype of patients (top) are indicated. Signal log ratio abundance is depicted as in Figure 2A. (B) Scatterplot showing VAV1 expression across indicated human T-ALL subtypes (bottom) using microarray dataset 1. Dots represent values from an individual sample. Bars represent the mean expression value ± SEM for the overall sample set. ∗∗∗p ≤ 0.001 (Tukey's HSD test). (C) Scatterplot showing VAV1 abundance against the combined amount of TLX1/TLX3 expression using dataset 1. Dots represent values from individual samples. (D) ssGSEA-generated heatmap of the up- and downregulated genes of the “tumor-specific” Vav1−/−/Zfp36l1−/−;Zfp36l2−/− signature in T-ALL cases from dataset 1. ssGSEA enrichment scores are depicted on a dark blue (lowest) to dark red (highest) scale. Samples with moderate and high signature fits are highlighted by gray and black bars, respectively. TS, tumor-specific. (E) Box plot of the tumor-specific Vav1−/−/Zfp36l1−/−;Zfp36l2−/− gene signature fit score for indicated T-ALL subtype samples (bottom) and microarray datasets (top). Data are presented as indicated in Figure 2C. ∗∗p ≤ 0.01, ∗∗∗p ≤ 0.001 (Tukey's HSD test). (F) Expression correlation matrix from TLX+ T-ALL samples positive for the “tumor-specific” Vav1−/−/Zfp36l1−/−;Zfp36l2−/− gene signature using dataset 1. Positive and negative correlation is shown in red and blue, respectively. The size of circles and color intensity are proportional to the Pearson correlation coefficient found for each transcript pair. Correlations with p values below the significance threshold of 0.05 (which relates with a Pearson correlation coefficient above 0.39 for dataset 1) have been considered as statistically significant and labeled with asterisks. Negative regulators of the Notch1 route and ICN1 targets are shown in red and blue letters, respectively. (G) Pearson correlation coefficient of the HES1 mRNA with indicated transcripts (inset) and microarray datasets (top). The horizontal blue broken lines depict the p-value threshold used (0.05) to consider a correlation statistically significant. TLXSP, TLX+ T-ALL signature positive; T-ALLSN, T-ALL signature negative. (H and I) Expression of endogenous Vav1 in TCLs from indicated T-ALL cell lines (H) and patient-derived tumor cells (I) (n = 3). TLX and HOXA status of cells is shown on top. See also Figure S7.
Figure 8
Figure 8
The TLX-Mediated Downmodulation of Vav1 Is Important for TLX+ T-ALL Pathogenesis (A) Effect of ectopic expression of EGFP-TLX1 in the abundance of Vav1, ICN1 and Cbl-b in Jurkat cells. Detection of EGFP-TLX1 and EGFP control was carried out using antibodies to GFP (fourth panel from top). (B) Effect of TLX1 knockdown in the abundance of Vav1, ICN1 and Cbl-b in ALL-SIL cells. (C) Effect of TLX3 knockdown in the abundance of Vav1, ICN1 and Cbl-b in HPB-ALL cells. Red asterisks indicate panels generated using electrophoresed TCLs transferred to an independent nitrocellulose filter. (D and E) Example (D) and quantification (E) of the effect of the ectopic expression of indicated EGFP-Vav1 proteins in ICN1 abundance in HPB-ALL cells (n = 3). (F) Effect of indicated Vav1 proteins on HES1 promoter activity (n = 3). (G) Effect of indicated EGFP-Vav1 proteins in the growth of HPB-ALL cells (n = 3). (H and I) Effect of indicated EGFP-Vav1 proteins in the proliferation (H) and apoptosis (I) of HBP-ALL cells in the absence or presence of ectopically expressed ICN1 (n = 3). (J) Effect of the expression of EGFP-Vav1WT and ICN1 in the growth of HPB-ALL cells (n = 3). (K and L) Example (K) and quantification (L) of the effect of EGFP-Vav1WT on ICN1 levels in tumor cells from a TLX1+ T-ALL patient (n = 3). (M and N) Example (M) and quantification (N) of the effect of EGFP-Vav1WT in the apoptosis of tumor cells from a TLX1+ patient (n = 3). (O) The pathway unveiled in this work. The Vav1 suppressor and canonical routes are shown in green and black, respectively. The Vav1-Cbl-b-ICN1 complex is depicted as a gray box. Disease and experimental conditions disrupting this signaling axis are in red. Data shown in (E–J), (L), and (N) represent mean ± SEM. p ≤ 0.05, ∗∗p ≤ 0.01, ∗∗∗p ≤ 0.001 (Student's t test). See also Figure S8.

Comment in

  • Vav1: Friend and Foe of Cancer.
    Guo F, Zheng Y. Guo F, et al. Trends Cell Biol. 2017 Dec;27(12):879-880. doi: 10.1016/j.tcb.2017.10.004. Epub 2017 Oct 30. Trends Cell Biol. 2017. PMID: 29097023 Free PMC article.

References

    1. Abate F., da Silva-Almeida A.C., Zairis S., Robles-Valero J., Couronne L., Khiabanian H., Quinn S.A., Kim M.Y., Laginestra M.A., Kim C. Activating mutations and translocations in the guanine exchange factor VAV1 in peripheral T-cell lymphomas. Proc. Natl. Acad. Sci. USA. 2017;114:764–769. - PMC - PubMed
    1. Alcover A., Alberini C., Acuto O., Clayton L.K., Transy C., Spagnoli G.C., Moingeon P., Lopez P., Reinherz E.L. Interdependence of CD3-Ti and CD2 activation pathways in human T lymphocytes. EMBO J. 1988;7:1973–1977. - PMC - PubMed
    1. Barreira M., Fabbiano S., Couceiro J.R., Torreira E., Martinez-Torrecuadrada J.L., Montoya G., Llorca O., Bustelo X.R. The C-terminal SH3 domain contributes to the intramolecular inhibition of Vav family proteins. Sci. Signal. 2014;7:ra35. - PubMed
    1. Boddicker R.L., Razidlo G.L., Dasari S., Zeng Y., Hu G., Knudson R.A., Greipp P.T., Davila J.I., Johnson S.H., Porcher J.C. Integrated mate-pair and RNA sequencing identifies novel, targetable gene fusions in peripheral T-cell lymphoma. Blood. 2016;128:1234–1245. - PMC - PubMed
    1. Bustelo X.R. Vav family exchange factors: an integrated regulatory and functional view. Small GTPases. 2014;5:1–12. - PMC - PubMed

Publication types

MeSH terms

Substances