. 2017 Nov 14;12(11):e0187703.
doi: 10.1371/journal.pone.0187703. eCollection 2017.

Transcriptional profiling of Toll-like receptor 2-deficient primary murine brain cells during Toxoplasma gondii infection

Affiliations

Transcriptional profiling of Toll-like receptor 2-deficient primary murine brain cells during Toxoplasma gondii infection

Kousuke Umeda et al. PLoS One. .

Erratum in

Abstract

Background: Toxoplasma gondii is capable of persisting in the brain, although it is efficiently eliminated by cellular immune responses in most other sites. While Toll-like receptor 2 (TLR2) reportedly plays important roles in protective immunity against the parasite, the relationship between neurological disorders induced by T. gondii infection and TLR2 function in the brain remains controversial with many unknowns. In this study, primary cultured astrocytes, microglia, neurons, and peritoneal macrophages obtained from wild-type and TLR2-deficient mice were exposed to T. gondii tachyzoites. To characterize TLR2-dependent functional pathways activated in response to T. gondii infection, gene expression of different cell types was profiled by RNA sequencing.

Results: During T. gondii infection, a total of 611, 777, 385, and 1105 genes were upregulated in astrocytes, microglia, neurons, and macrophages, respectively, while 163, 1207, 158, and 1274 genes were downregulated, respectively, in a TLR2-dependent manner. Overrepresented Gene Ontology (GO) terms for TLR2-dependently upregulated genes were associated with immune and stress responses in astrocytes, immune responses and developmental processes in microglia, metabolic processes and immune responses in neurons, and metabolic processes and gene expression in macrophages. Overrepresented GO terms for downregulated genes included ion transport and behavior in astrocytes, cell cycle and cell division in microglia, metabolic processes in neurons, and response to stimulus, signaling and cell motility in macrophages.

Conclusions: To our knowledge, this is the first transcriptomic study of TLR2 function across different cell types during T. gondii infection. Results of RNA-sequencing demonstrated roles for TLR2 varied by cell type during T. gondii infection. Our findings facilitate understanding of the detailed relationship between TLR2 and T. gondii infection, and elucidate mechanisms underlying neurological changes during infection.


Conflict of interest statement

Competing Interests: The authors have declared that no competing interests exist.

Figures

Fig 1
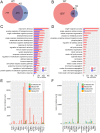
Fig 1. Comparison of transcriptional profiles for Tlr2-/- and wild-type astrocytes during T. gondii infection.
Upregulated (A, C, E) and downregulated (B, D, F) genes were identified as genes with 2-fold change and < 0.05 FDR in DESeq analysis comparing infected and uninfected cells. (A, B) Venn diagrams were created to compare DEGs with increased and decreased abundance between Tlr2-/- and wild-type. (C, D) To explore the function of DEGs analyzed in the Venn diagram, GO term enrichment analysis was performed. Asterisks represent significant differences with p < 0.05 in Fisher’s exact test. (E, F) Expression of top 20 highly upregulated or downregulated TLR2-dependent genes. TLR2-dependent DEGs were ranked according to fold-changes between infected and uninfected wild-type. WT, wild-type; KO, Tlr2-/-.
Fig 2
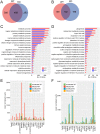
Fig 2. Comparison of transcriptional profiles of Tlr2-/- and wild-type microglia during T. gondii infection.
Upregulated (A, C, E) and downregulated (B, D, F) genes were identified as genes with 2-fold change and < 0.05 FDR in DESeq analysis comparing infected and uninfected cells. (A, B) Venn diagrams comparing DEGs with increased and decreased abundance between Tlr2-/- and wild-type mice. (C, D) To explore the function of DEGs analyzed in the Venn diagram, GO term enrichment analysis was performed. Asterisks represent significant differences with p < 0.05 in Fisher’s exact test. (E, F) Expression of top 20 genes highly upregulated or downregulated in a TLR2-dependent manner. TLR2-dependent DEGs were ranked according to fold-changes between infected and uninfected wild-type. WT, wild-type; KO, Tlr2-/-.
Fig 3
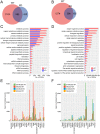
Fig 3. Comparison of transcriptional profiles of Tlr2-/- and wild-type neurons during T. gondii infection.
Upregulated (A, C, E) and downregulated (B, D, F) genes were identified as genes with 2-fold change and < 0.05 FDR in DESeq analysis comparing infected and uninfected cells. (A, B) Venn diagrams comparing DEGs with increased and decreased abundance between Tlr2-/- and wild-type neurons. (C, D) To explore the function of DEGs analyzed in the Venn diagram, GO term enrichment analysis was performed. Asterisks represent significant differences with p < 0.05 in Fisher’s exact test. (E, F) Expression of top 20 genes highly upregulated or downregulated in a TLR2-dependent manner. TLR2-dependent DEGs were ranked according to fold-changes between infected and uninfected wild-type. WT, wild-type; KO, Tlr2-/-.
Fig 4
Fig 4. Comparison of transcriptional profiles of Tlr2-/- and wild-type macrophages during T. gondii infection.
Upregulated (A, C, E) and downregulated (B, D, F) genes were identified as genes with 2-fold change and < 0.05 FDR in DESeq analysis comparing infected and uninfected cells. (A, B) Venn diagrams comparing DEGs with increased and decreased abundance between Tlr2-/- and wild-type macrophages. (C, D) To explore the function of DEGs analyzed in the Venn diagram, GO term enrichment analysis was performed. Asterisks represent significant differences with p < 0.05 in Fisher’s exact test. (E, F) Expression of top 20 highly upregulated or downregulated TLR2-depdent genes. TLR2-dependent DEGs were ranked according to fold-changes between infected and uninfected wild-type. WT, wild-type; KO, Tlr2-/-.
Fig 5
Fig 5. Comparison of TLR2-dependent genes among different CNS cell types.
Venn diagrams comparing TLR2-dependent DEGs in T. gondii infection among astrocytes, microglia, and neurons. A, upregulated; B, downregulated.
Fig 6
Fig 6. GO analysis of TLR2-dependent DEGs in different CNS cell types.
GO analysis was performed to overview the functions of TLR2-dependent DEGs upregulated or downregulated specifically in astrocytes (A, B), microglia (C, D), or neurons (E, F) during T. gondii infection. Top 20 GO terms associated with biological process are listed. A, C, and E, upregulated; B, D and F, downregulated.
Fig 7
Fig 7. Comparison of TLR2-dependent genes between different phagocytic cell types.
Venn diagrams were created to compare TLR2-dependent DEGs in T. gondii infection between macrophages and microglia. A, upregulated; B, downregulated.
Fig 8
Fig 8. GO analysis of TLR2-dependent DEGs in different phagocytic cell types.
GO analysis was performed to overview the functions of TLR2-dependent DEGs upregulated or downregulated specifically in macrophages (A, B), microglia (C, D), or commonly in both cell types (E, F) during T. gondii infection. Top 20 GO terms associated with biological process are listed. A, C, and E, upregulated; B, D, and F, downregulated.
Fig 9
Fig 9. Production of cytokines and PGE2 by astrocytes, microglia, and peritoneal macrophages after T. gondii infection.
Primary astrocytes (A), microglia (B), and peritoneal macrophages (C) from wild-type (white) and Tlr2-/- mice (black) were infected with T. gondii tachyzoites. Each bar represents the mean ± SD of triplicate wells for each group. This is a representative result of two independent experiments. Asterisks represent significant differences with p < 0.05 in Student’s t-test.
Fig 10
Fig 10. Production of NO and IL-12p40 from microglia stimulated with IFN-γ.
Microglia from wild-type (white) and Tlr2-/- mice (black) were infected with T. gondii tachyzoites. Each bar represents the mean ± SD of triplicate wells for each group. This is a representative result of two independent experiments. Asterisks represent significant differences with p < 0.05 in Student’s t-test.

Similar articles

Cited by

References

    1. Montoya J, Liesenfeld O. Toxoplasmosis. The Lancet. 2004;363: 1965–1976. doi: 10.1016/S0140-6736(04)16412-X - DOI - PubMed
    1. Luft BJ, Conley F, Remington JS, Laverdiere M, Wagner KF, Levine JF, et al. Outbreak of central-nervous-system toxoplasmosis in western Europe and North America. Lancet Lond Engl. 1983;1: 781–784. - PubMed
    1. Jones J, Lopez A, Wilson M. Congenital toxoplasmosis. Am Fam Physician. 2003;67: 2131–2138. - PubMed
    1. Black MW, Boothroyd JC. Lytic Cycle of Toxoplasma gondii. Microbiol Mol Biol Rev. 2000;64: 607–623. - PMC - PubMed
    1. Skariah S, McIntyre MK, Mordue DG. Toxoplasma gondii: determinants of tachyzoite to bradyzoite conversion. Parasitol Res. 2010;107: 253–260. doi: 10.1007/s00436-010-1899-6 - DOI - PMC - PubMed

LinkOut - more resources