. 2017 Nov 14;13(11):e1005862.
doi: 10.1371/journal.pcbi.1005862. eCollection 2017 Nov.

A free-boundary model of a motile cell explains turning behavior

Affiliations

A free-boundary model of a motile cell explains turning behavior

Masoud Nickaeen et al. PLoS Comput Biol. .

Abstract

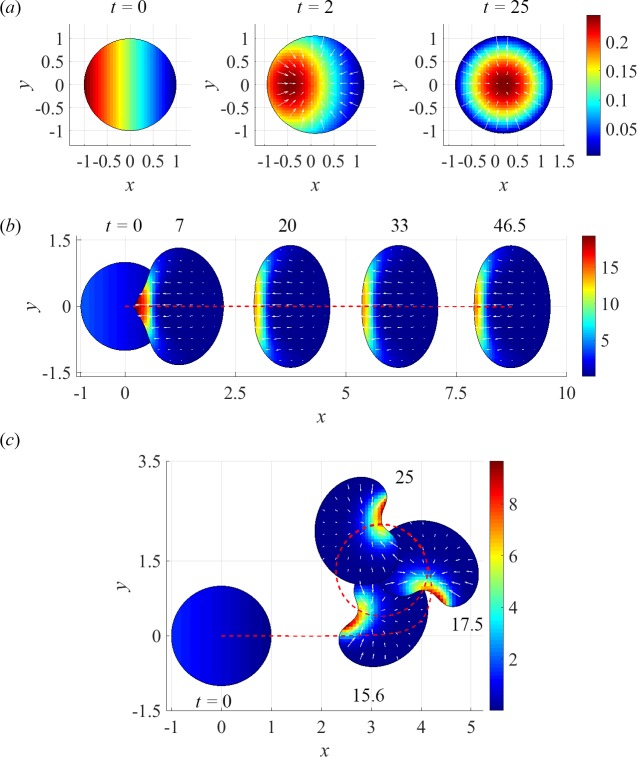
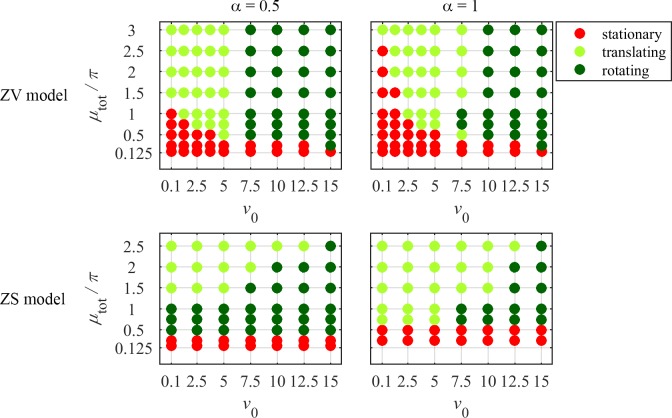
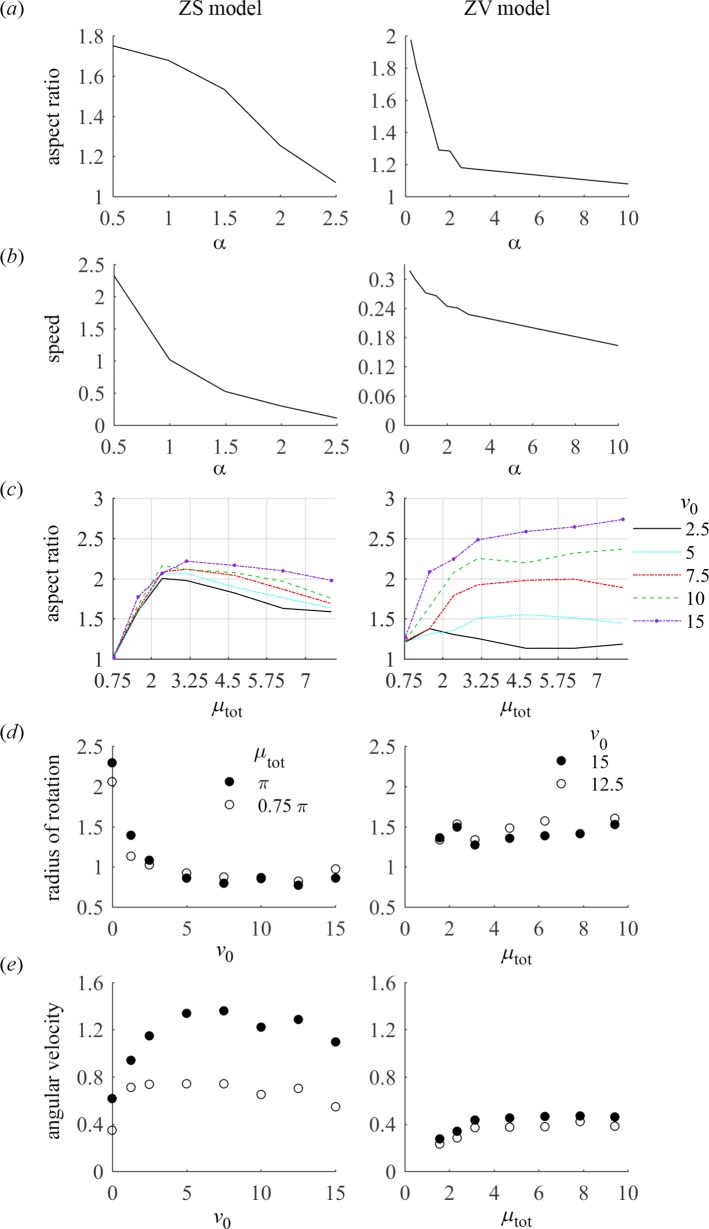
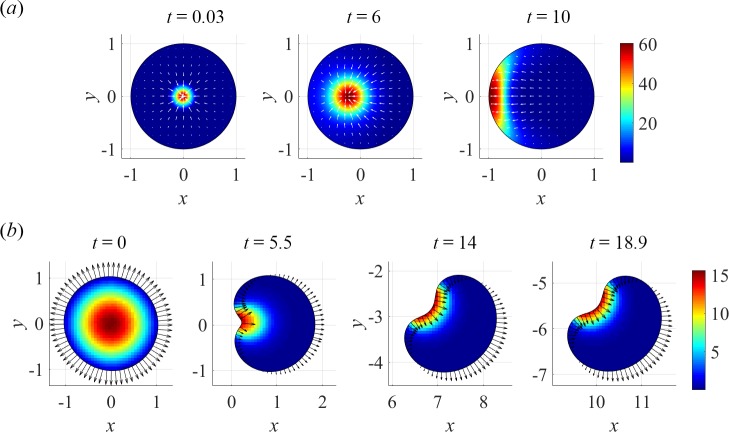
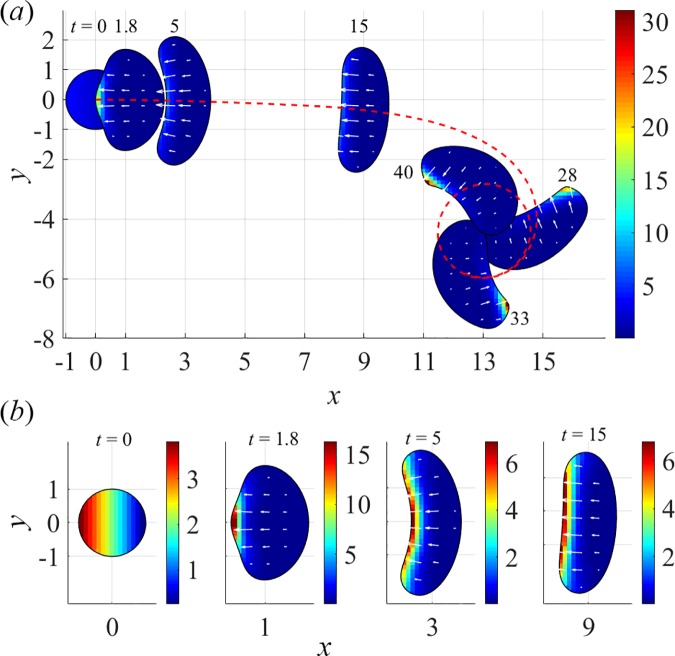
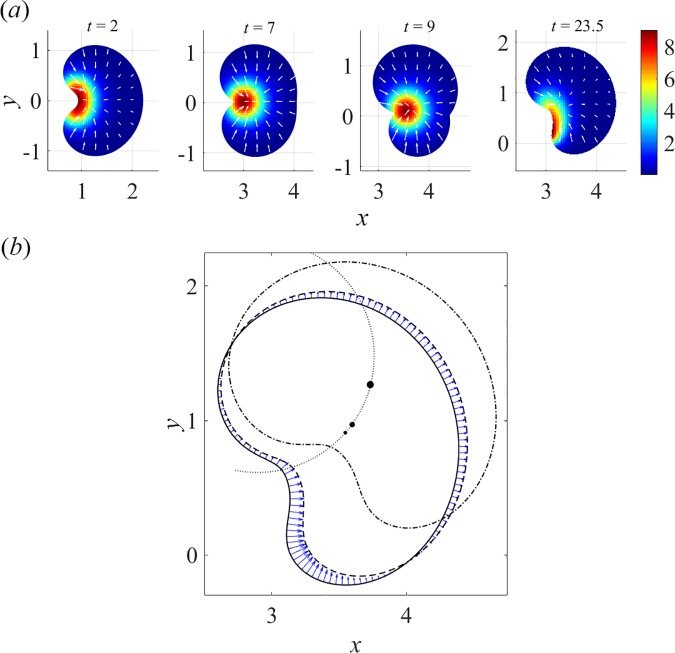
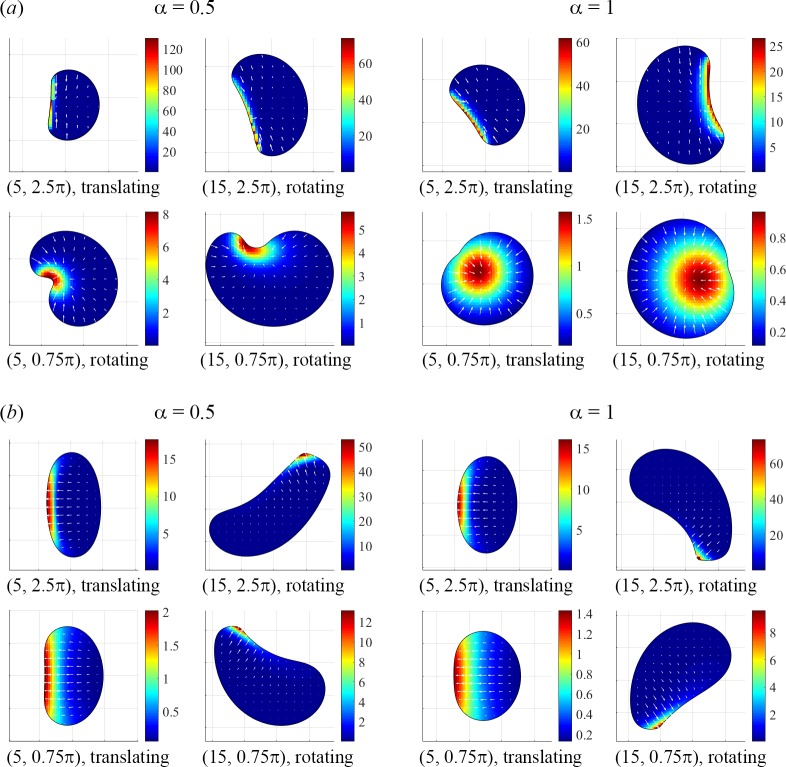
To understand shapes and movements of cells undergoing lamellipodial motility, we systematically explore minimal free-boundary models of actin-myosin contractility consisting of the force-balance and myosin transport equations. The models account for isotropic contraction proportional to myosin density, viscous stresses in the actin network, and constant-strength viscous-like adhesion. The contraction generates a spatially graded centripetal actin flow, which in turn reinforces the contraction via myosin redistribution and causes retraction of the lamellipodial boundary. Actin protrusion at the boundary counters the retraction, and the balance of the protrusion and retraction shapes the lamellipodium. The model analysis shows that initiation of motility critically depends on three dimensionless parameter combinations, which represent myosin-dependent contractility, a characteristic viscosity-adhesion length, and a rate of actin protrusion. When the contractility is sufficiently strong, cells break symmetry and move steadily along either straight or circular trajectories, and the motile behavior is sensitive to conditions at the cell boundary. Scanning of a model parameter space shows that the contractile mechanism of motility supports robust cell turning in conditions where short viscosity-adhesion lengths and fast protrusion cause an accumulation of myosin in a small region at the cell rear, destabilizing the axial symmetry of a moving cell.


Conflict of interest statement

The authors have declared that no competing interests exist.

Figures

Fig 1
Fig 1
Asymptotically stable mechanical states (in all cases, α = 0.5): (a) a stationary state of ZS model, (v0, μtot) = (2.5, 0.125π); (b) unidirectional translation in ZV model, (v0, μtot) = (2.5, 2π); (c) rotations in ZS model, (v0, μtot) = (2.5, 0.75π). Pseudo-colors depict distributions of myosin; arrows are actin velocities; a red dashed line/curve shows the trajectory of a centroid.
Fig 2
Fig 2. Mechanical states of ZV and ZS models for varying sets (v0, μtot) and α = 0.5 and 1.
Fig 3
Fig 3. Aspect ratios and translational or linear rotational speeds of steadily moving cells.
(a) Aspect ratio as a function of viscosity-adhesion length α; the results were obtained with (v0, μtot) = (2.5, 1.5π) for ZS model, and with (v0, μtot) = (5, 1.5π) for ZV model; aspect ratios were computed as ratios of the longest to shortest distances between cell boundary and cell centroid. (b) Dimensionless translational or linear rotational speed of a cell centroid as a function of viscosity-adhesion length α; model parameters are as in panel (a). (c) Aspect ratio as a function of v0 and μtot; the results were obtained with α = 1 for ZV model and with α = 0.5 for ZS model. (d) Radius of rotation of a cell centroid as a function of v0 and μtot, with values of α as in (c). (e) Dimensionless angular velocity of a cell centroid as a function of v0 and μtot, with values of α as in (c).
Fig 4
Fig 4. Symmetry breaking in a fixed circle and in a free-boundary problem.
(a) Instability of a symmetric steady state of ZV model in a fixed circle: snapshots of dimensionless myosin density (pseudo-color) and actin velocities (arrows) at specified times t after myosin was slightly shifted left of center; computations were done for μtot = 1.5π and α = 0.5. (b) Transition to unidirectional motility in ZS model; dimensionless myosin concentration (pseudo-colors) and boundary velocities (arrows) are shown for the solution obtained with α = 1, v0 = 5, and μtot = 1.5π; the cell assumes steady unidirectional motility after t = 14 (S2 Movie).
Fig 5
Fig 5. Cell speeds and areas as functions of v0 and μtot.
(a) Dimensionless translational or linear rotational speed of a cell centroid were obtained with α = 1 for ZV model and α = 0.5 for ZS model. (b) Dimensionless steady-state areas for values of α as in panel (a). Insets in both panels: corresponding level sets.
Fig 6
Fig 6. Onset of steady rotations in ZV model, (v0, μtot, α) = (12.5, 2π, 1).
(a) Entire cell trajectory and cell centroid track (red dashed curve). (b) Snapshots of transient myosin distributions with individual color scales during a transient, and with white arrows representing actin velocities (S3 Movie).
Fig 7
Fig 7. Steady rotations in ZS model, (v0, μtot, α) = (2.5, 0.75π, 0.5) (see also S4 Movie).
(a) Transient distributions of myosin (pseudo-colors) and actin velocities (arrows): t = 2, an initially symmetric cell with centroid at (x, y) = (0,0) self-polarizes and assumes fast unidirectional motility, myosin accumulates in a semi-circular band, pulling the rear inwards to form a ‘dip’; t = 7, the cell slows down and becomes unstable, as myosin is now close enough to cell front to be able to pull it in as well; t = 9, loss of axial symmetry, as the lower part of the cell with steeper myosin gradients is pulled inwards faster than the upper one; t = 23.5: emergence of stable asymmetric myosin distribution and cell shape, as the cell locks in rotations (see Fig 1C). (b) Cell shape and boundary velocities in steady rotations. Positions of the cell boundary and centroid at t = 23.5, 23.6, and 24 (solid, dashed, and dotted-dashed contours, respectively, and filled circles with larger size corresponding to later time). Faster boundary velocities (arrows) in the high curvature region, consistent with the location of steep myosin gradients (panel (a)), ensure rotational motility with a circular trajectory of the centroid (dotted arc), see also Fig 1C.
Fig 8
Fig 8
Steady-state cell shapes, myosin distributions (pseudo-colors), actin velocities (arrows), and motility types from solutions of the ZS (a) and ZV (b) models obtained for specified parameter values (v0, μtot). Gridlines are spaced uniformly with h = 1.

Similar articles

Cited by

References

    1. Ridley AJ, Schwartz MA, Burridge K, Firtel RA, Ginsberg MH, Borisy G, et al. Cell migration: integrating signals from front to back. Science 2003. December 5;302(5651):1704–9. doi: 10.1126/science.1092053 - DOI - PubMed
    1. Lämmermann T, Sixt M. Mechanical modes of 'amoeboid' cell migration. Curr Opin Cell Biol. 2009. October;21(5):636–44. doi: 10.1016/j.ceb.2009.05.003 - DOI - PubMed
    1. Verkhovsky AB. The mechanisms of spatial and temporal patterning of cell-edge dynamics. Curr Opin Cell Biol. 2015. October;36: 113–21. doi: 10.1016/j.ceb.2015.09.001 - DOI - PubMed
    1. Keren K, Pincus Z, Allen GM, Barnhart EL, Marriott G, Mogilner A, et al. Mechanism of shape determination in motile cells. Nature 2008. May 22;453(7194):475–80. doi: 10.1038/nature06952 - DOI - PMC - PubMed
    1. Barnhart EL, Lee KC, Keren K, Mogilner A, Theriot JA. An adhesion-dependent switch between mechanisms that determine motile cell shape. PLoS Biol. 2011. May;9(5): e1001059 doi: 10.1371/journal.pbio.1001059 - DOI - PMC - PubMed

LinkOut - more resources