. 2017 Jul 19;8(47):81737-81753.
doi: 10.18632/oncotarget.19387. eCollection 2017 Oct 10.

Functional characterization of lysine-specific demethylase 2 (LSD2/KDM1B) in breast cancer progression

Affiliations

Functional characterization of lysine-specific demethylase 2 (LSD2/KDM1B) in breast cancer progression

Lin Chen et al. Oncotarget. .

Abstract

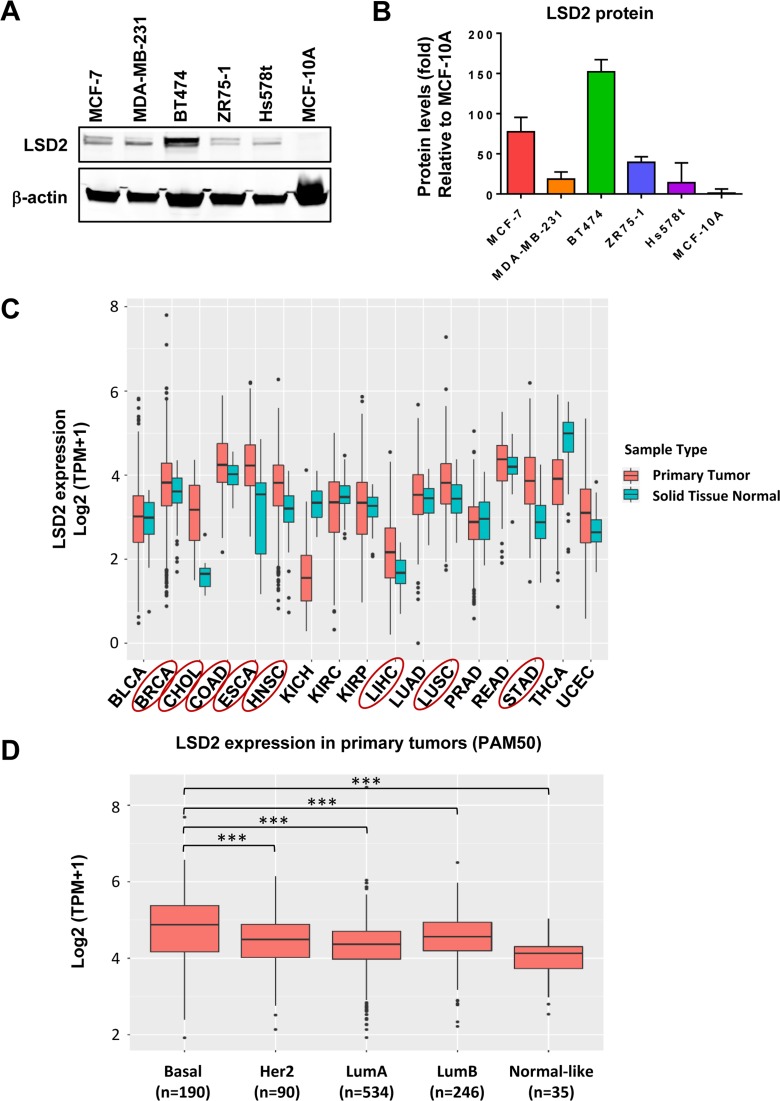
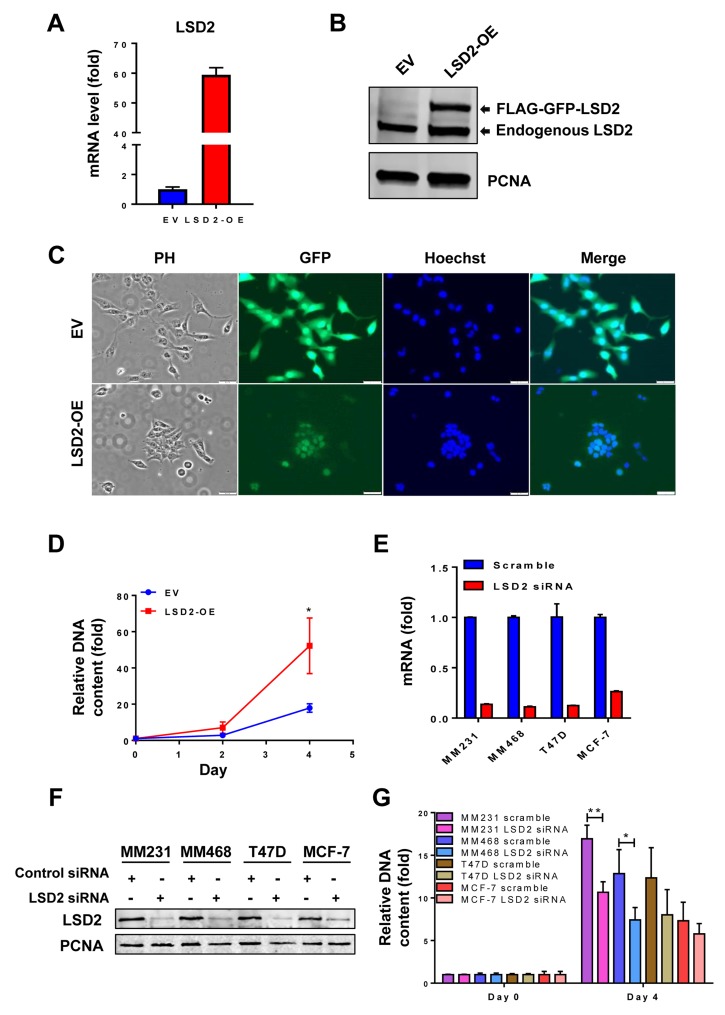
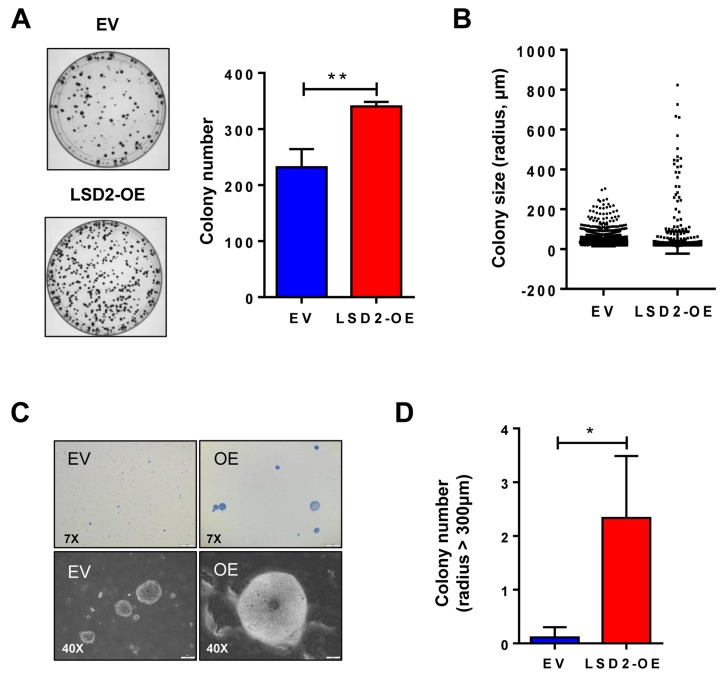
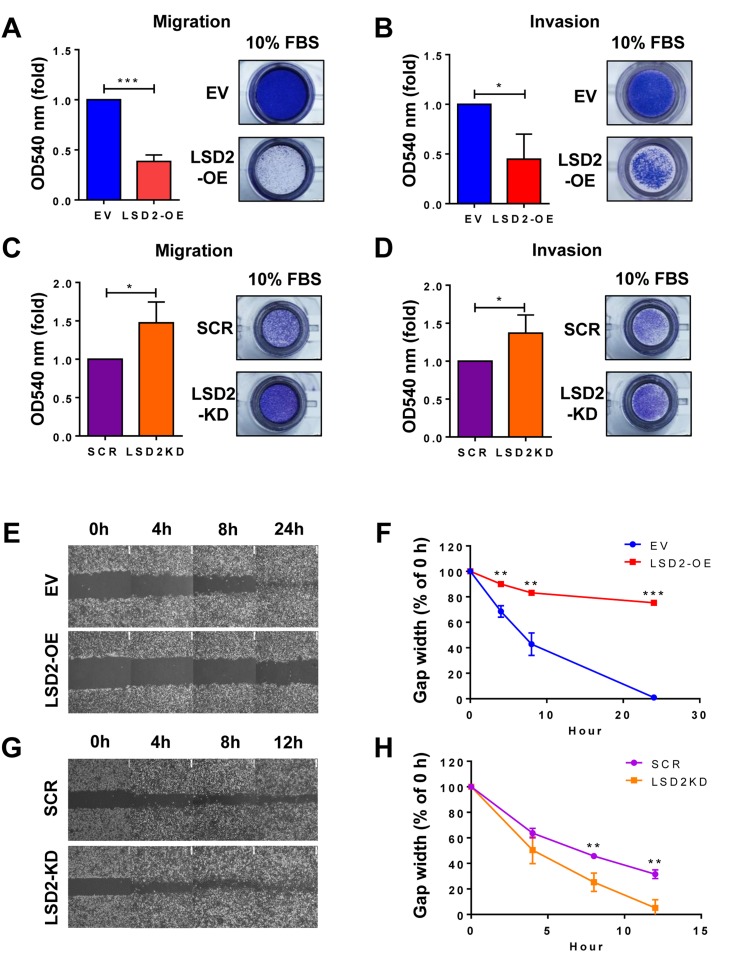
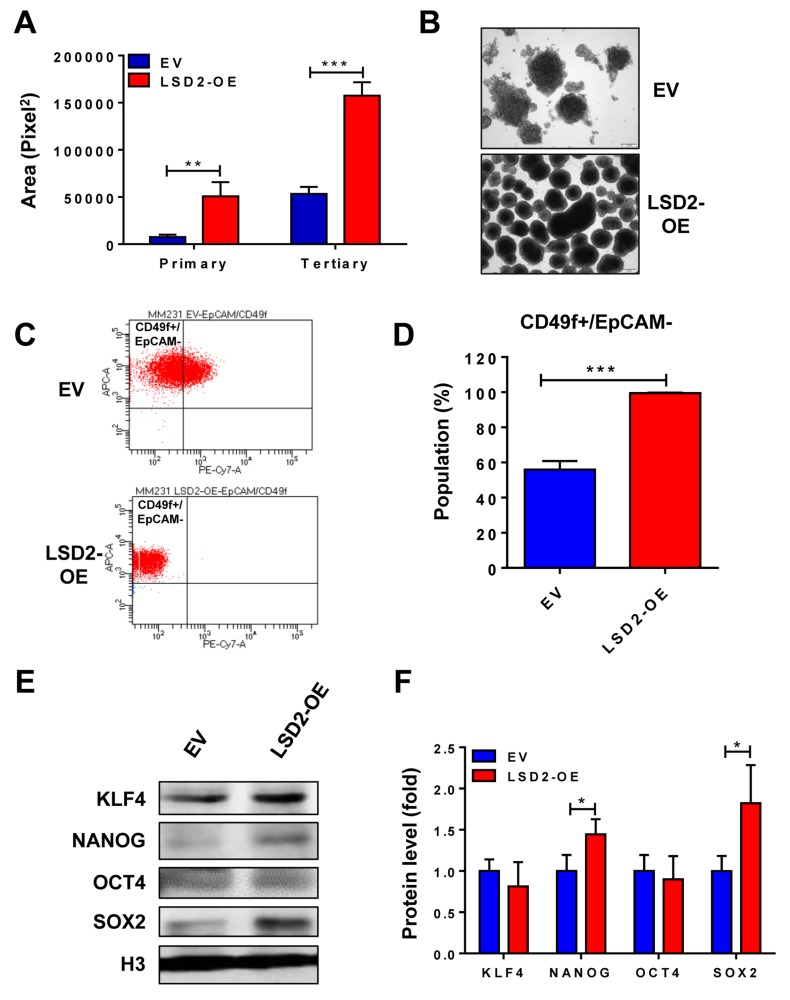
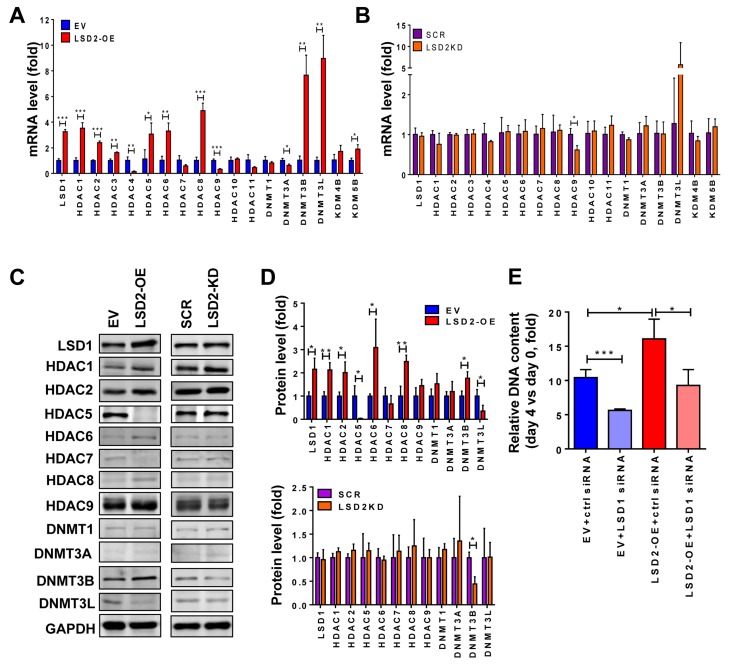
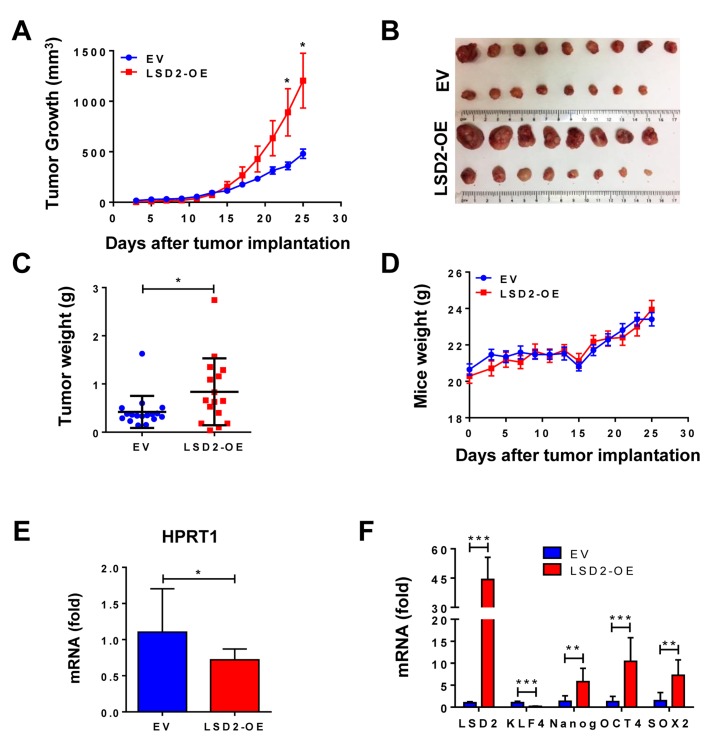
Flavin-dependent histone demethylases govern histone H3K4 methylation and act as important chromatin modulators that are extensively involved in regulation of DNA replication, gene transcription, DNA repair, and heterochromatin gene silencing. While the activities of lysine-specific demethylase 1 (LSD1/KDM1A) in facilitating breast cancer progression have been well characterized, the roles of its homolog LSD2 (KDM1B) in breast oncogenesis are relatively less understood. In this study, we showed that LSD2 protein level was significantly elevated in malignant breast cell lines compared with normal breast epithelial cell line. TCGA- Oncomine database showed that LSD2 expression is significantly higher in basal-like breast tumors compared to other breast cancer subtypes or normal breast tissue. Overexpression of LSD2 in MDA-MB-231 cells significantly altered the expression of key important epigenetic modifiers such as LSD1, HDAC1/2, and DNMT3B; promoted cellular proliferation; and augmented colony formation in soft agar; while attenuating motility and invasion. Conversely, siRNA-mediated depletion of endogenous LSD2 hindered growth of multiple breast cancer cell lines while shRNA-mediated LSD2 depletion augmented motility and invasion. Moreover, LSD2 overexpression in MDA-MB-231 cells facilitated mammosphere formation, enriched the subpopulation of CD49f+/EpCAM- and ALDHhigh, and induced the expression of pluripotent stem cell markers, NANOG and SOX2. In xenograft studies using immune-compromised mice, LSD2-overexpressing MDA-MB-231 cells displayed accelerated tumor growth but significantly fewer lung metastases than controls. Taken together, our findings provide novel insights into the critical and multifaceted roles of LSD2 in the regulation of breast cancer progression and cancer stem cell enrichment.

Keywords: LSD2/KDM1B; breast cancer; cell growth; invasion; migration.


Conflict of interest statement

CONFLICTS OF INTEREST The authors declare no conflict of interest.

Figures

Figure 1
Figure 1. Expression level of LSD2 in breast cancer cell lines and clinical tumor specimens
A. Western blot examination of LSD2 protein expression in breast cancer and MCF10A cell lines. B. Quantification of western blot results of LSD2 expression. C. TCGA data analysis of mRNA level of LSD2 in different types of cancer. Cancer types with significantly elevated LSD2 mRNA level were highlighted with Red circle. P-values were calculated using Mann-Whitney U test and corrected for multiple comparisons using Benjamini-Hochberg. D. mRNA levels of LSD2 in different subtypes of breast cancer. Tukey multiple comparisons of means, *** p < 0.001.
Figure 2
Figure 2. Effect of LSD2 overexpression or depletion on proliferation of breast cancer cells
A. MDA-MB-231 cells were transfected with control empty vector (EV) or LSD2 overexpression vector (OE) for 48 h followed by selection with G418. mRNA expression of LSD2 was measured by quantitative real-time PCR with GAPDH as an internal control. B. Cellular nuclear proteins were extracted, and LSD2 protein expression in MDA-MB-231-EV or LSD2-OE cells was examined by Western blots using anti-LSD2 antibody with proliferating cell nuclear antigen (PCNA) as an internal control. C. MDA-MB-231 cells transfected with control empty vector (EV) or LSD2 overexpression vector (LSD2-OE) were fixed with 4% PFA followed by Hoechst 33258 staining. Bright field and fluorescent images were taken to observe cellular morphology and LSD2-GFP protein expression. PH, Phase Contrast. D. MDA-MB-231 cells transfected with control empty vector (EV) or LSD2 overexpression vector (LSD2-OE) were analyzed for growth using fluorometric dsDNA quantitation method. E. Human breast cancer MDA-MB-231, MDA-MB-468, MCF-7 and T47D cells were transfected with scramble or LSD2 siRNA for 96 h followed by qPCR examination of LSD2 mRNA expression level. β-actin was used as an internal control. F. Cells transfected with scramble or LSD2 siRNA were examined for LSD2 protein expression by western blots with PCNA as an internal control. G. Fluorometric dsDNA quantitation assays were performed to evaluate growth of breast cancer cells which were transfected with scramble or LSD2 siRNA for 96 h. All experiments were performed at least three times and bars represent the means of three independent experiments ± s.d. * p < 0.05, ** p < 0.01, Student’s t-test.
Figure 3
Figure 3. LSD2 enhances the colony formation capacity of MDA-MB-231 cells
A. 500 cells stably transfected with empty vector or LSD2 expression plasmids were plated in 10cm dish. After 14 days, colonies formed were stained with 0.5% crystal violet and counted. B. 10,000 cells per dish were seeded in 0.4% soft agar in 35mm dish. After 3 weeks, colonies were stained with 0.005% crystal violet and counted using CellSens software. Individual colonies formed by empty vector control or LSD2 overexpressing MDA-MB-231 cells were plotted based to colony size (μm). C. Representative microscopy images (7× and 40×) of cellular colonies after 3 weeks of seeding the cells on soft agar coated wells. D. Average numbers of colony whose radius is over 300 mm. Error bar represents ± s.d. from three independent experiments. * p < 0.05, ** p < 0.01, Student’s t-test.
Figure 4
Figure 4. LSD2 regulates migration and invasion in MDA-MB-231 cells
A. Transwell migration assay was performed to detect the migratory capacity of MDA-MB-231 EV and LSD2-OE cells. Quantification of the migrated cells was done by solubilization of crystal violet and spectrophotometric reading at OD 540. B. Quantification of the invasive MDA-MB-231 EV and LSD2-OE cells. Transwell invasion assay was performed and the invasive cells were quantified by solubilization of crystal violet and spectrophotometric reading at OD 540. C. Quantification of the migratory MDA-MB-231 cells transfected with scramble and LSD2 shRNA plasmids. D. Quantification of the invasive MDA-MB-231 cells transfected with scramble and LSD2 shRNA plasmids. E. Confluent monolayers of EV and LSD2-OE MDA-MB-231 cells were wounded by scratch with a pipette tip. Cells were then incubated for 24 h. Images were taken at the end points to be compared to 0 h to measure wound healing. F. The average of wound closure rate during the first 24 h of wound healing was calculated. G. Confluent monolayers of scramble shRNA and LSD2-KD MDA-MB-231 cells were wounded by scratch. Cells were then incubated for 12h. Images were taken at the end points to be compared to 0 h to measure wound healing. H. The average of wound closure rate during the first 12 h of wound healing was measured and quantified. All experiments were independently performed at least three times and values represent the mean ± s.d. * p < 0.05, ** p < 0.01, *** p < 0.001, Student’s t-test.
Figure 5
Figure 5. Overexpression of LSD2 facilitates breast cancer stem cell characteristics
A. MDA-MB-231 EV or LSD2-OE cells were suspended in tumor sphere medium and seeded in 6-well plate with ultra-low attachment surface. After 7-day incubation, spheres were collected and digested into single cells. Same density of digested cells was seeded for secondary mammosphere and tertiary mammosphere formation. Quantification of primary and tertiary mammospheres was performed using CellSens software. B. Representative pictures of tertiary mammospheres formed by EV and LSD2-OE cells. C. Flow cytometry analysis of cell surface marker CD49f and EpCAM in EV and LSD2-OE cells. D. The percentage of CD49f+/EpCAM- cells was quantified from three independent experiments. E. Western blot examinations on nuclear protein levels of KLF4, NANOG, OCT4 and SOX2 in EV and LSD2-OE cells. Histone 3 (H3) was used as internal control. F. The experiments were performed three times with similar results. Values represent means ± s.d. * p < 0.05, *** p < 0.001, Student’s t-test.
Figure 6
Figure 6. Effect of LSD2 on expression of key epigenetic modifiers
A. RNA was extracted from MDA-MB-231 EV and LSD2-OE cells and cDNA was synthesized and subjected to quantitative real-time PCR for the indicated genes using TaqMan probes. GAPDH expression was used as an internal standard. B. mRNA expression of chromatin modifying factors in MDA-MB-231 cells stably transfected with scramble (SCR) or LSD2 shRNA (LSD2-KD). GAPDH expression was used as an internal standard. C. Indicated chromatin modifying factors were analyzed for their protein levels by western blots in MDA-MB-231 EV, LSD2-OE, scramble shRNA and LSD2-KD cells. GAPDH was used as a loading control. D. Histograms represent the average protein levels of indicated chromatin modifiers in three independent experiments relative to GAPDH protein ± s.d. as determined by quantitative immunoblots. E. MDA-MB-231 EV and LSD2-OE cells were transfected with scramble or LSD1 targeting siRNA for 96 h followed by growth assay using fluorometric dsDNA quantitation. Column with error bar represents mean ± s.d. from three independent experiments. * p < 0.05, ** p < 0.01, *** p < 0.001, Student’s t-test.
Figure 7
Figure 7. In vivo effect of LSD2 on proliferation and metastasis in mice bearing MDA-MB-231 xenograft
A. MDA-MB-231 cells transfected with empty vectors (n = 17) or LSD2 expression vectors (n = 16) were transplanted into the mammary fat pad of nude mice. Tumor volumes were regularly assessed every two days. Shown are average tumor volumes ± s.e. B. Orthotopically implanted tumors were removed after terminating the experiments. Shown are pictures of implanted tumors. C. Weight of individual animal tumor was measured at the end of experiment. D. Weights of mice were measured on the indicated days. Points, mean mouse weight (g); bars, mean ± s.d. E. Tumor cells metastasized to mice lung were assessed by quantification of mRNA expression of human HPRT1 gene (EV, n = 10; LSD2-OE, n = 16). Mouse b-actin was used as internal control. Graph was plotted as fold change with normalization to EV. F. Total RNA was extracted from 7 randomly selected tumors from each group and mRNA levels of the four embryonic stem cell markers were evaluated by qPCR. *p < 0.05, **p <0.01, ***p < 0.001, Student’s t-test.

Similar articles

Cited by

References

    1. Shi Y. Histone lysine demethylases: emerging roles in development, physiology and disease. Nat Rev Genet. 2007;8:829–33. - PubMed
    1. Højfeldt JW, Agger K, Helin K. Histone lysine demethylases as targets for anticancer therapy. Nat Rev Drug Discov. 2013;12:917–30. - PubMed
    1. Karytinos A, Forneris F, Profumo A, Ciossani G, Battaglioli E, Binda C, Mattevi A. A novel mammalian flavin-dependent histone demethylase. J Biol Chem. 2009;284:17775–82. - PMC - PubMed
    1. Shi Y, Lan F, Matson C, Mulligan P, Whetstine JR, Cole PA, Casero RA, Shi Y. Histone demethylation mediated by the nuclear amine oxidase homolog LSD1. Cell. 2004;119:941–53. - PubMed
    1. Garcia RN, D’Avila MF, Robe LJ, Loreto EL, Panzera Y, de Heredia FO, Valente VL. First evidence of methylation in the genome of Drosophila willistoni. Genetica. 2007;131:91–105. - PubMed