

Implications of mutational spectrum in myelodysplastic syndromes based on targeted next-generation sequencing
- PMID: 29137279
- PMCID: PMC5669905
- DOI: 10.18632/oncotarget.19628
Implications of mutational spectrum in myelodysplastic syndromes based on targeted next-generation sequencing
Abstract
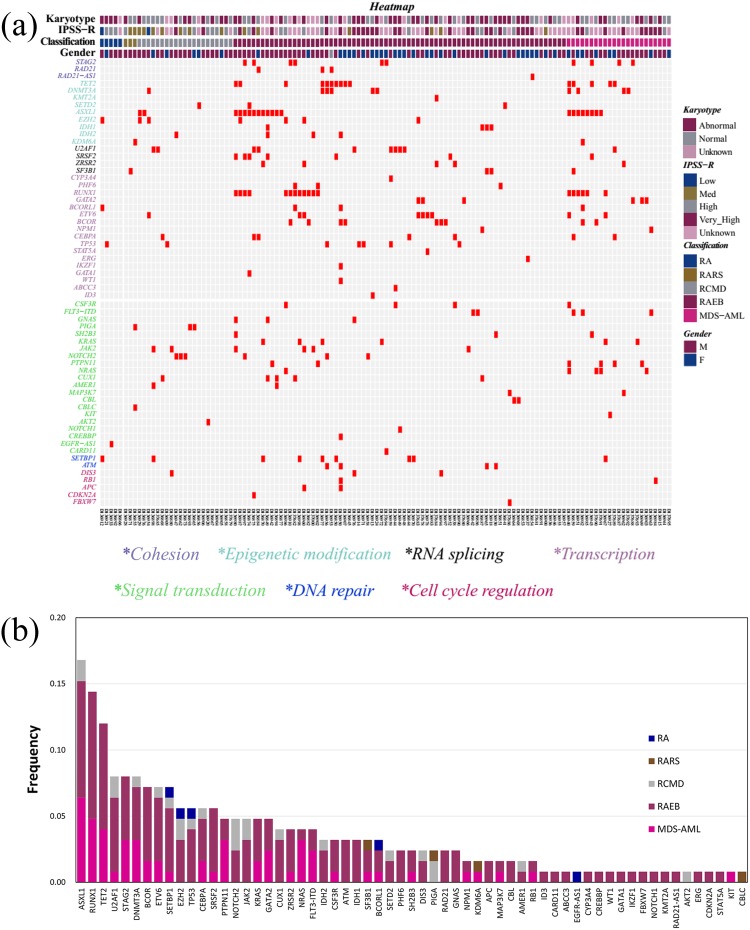
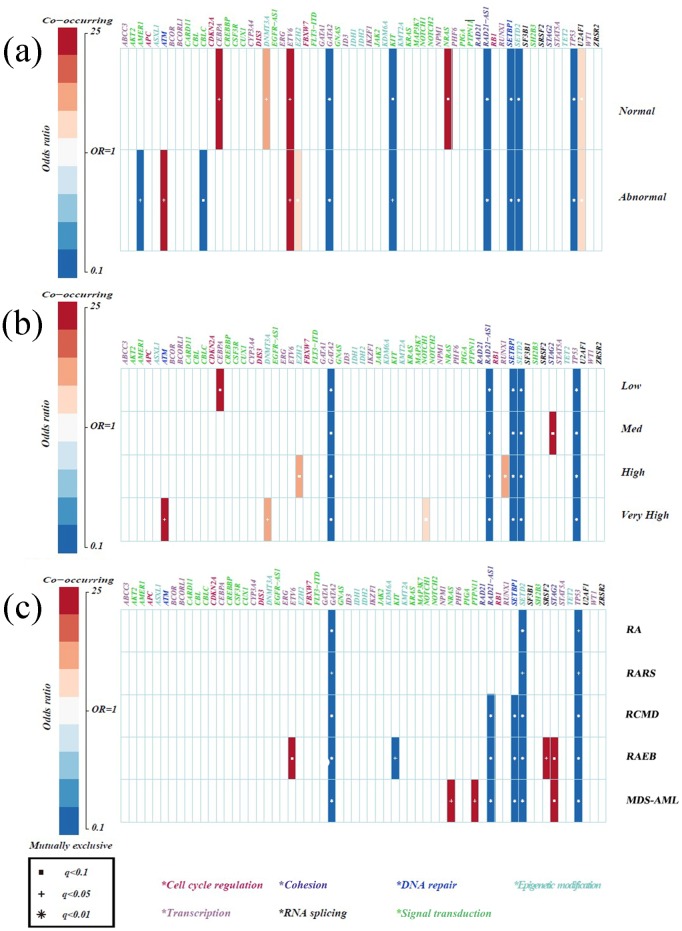
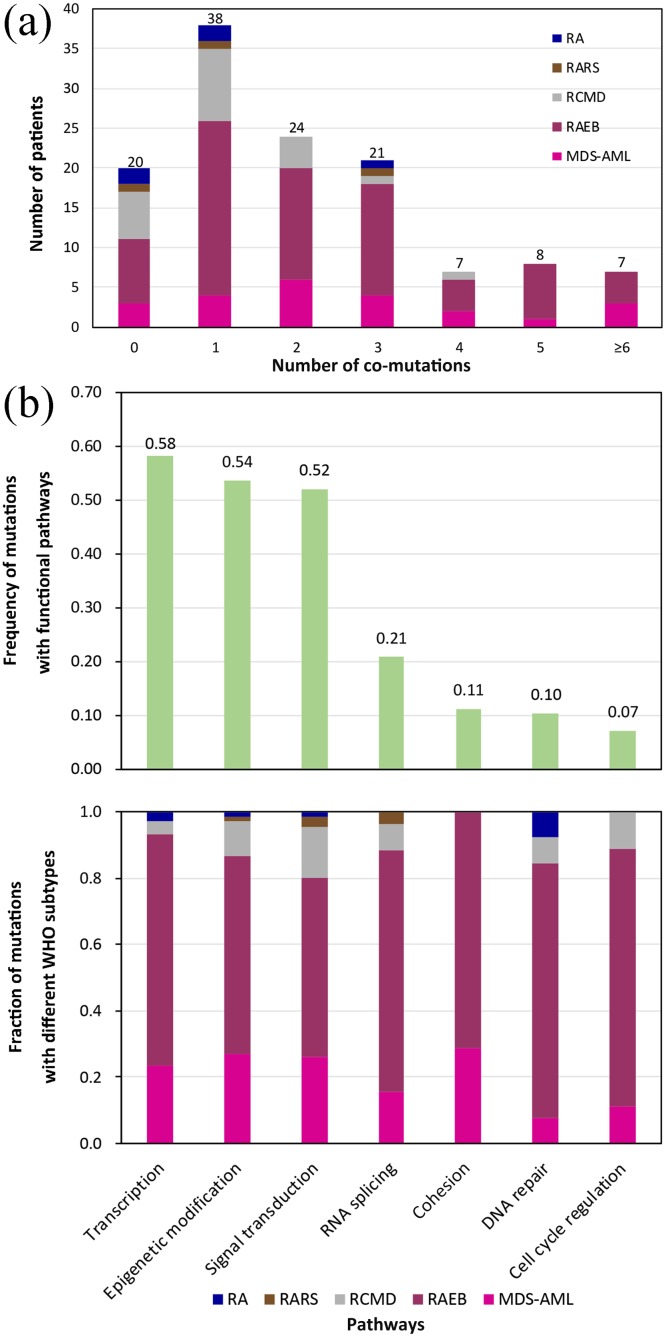
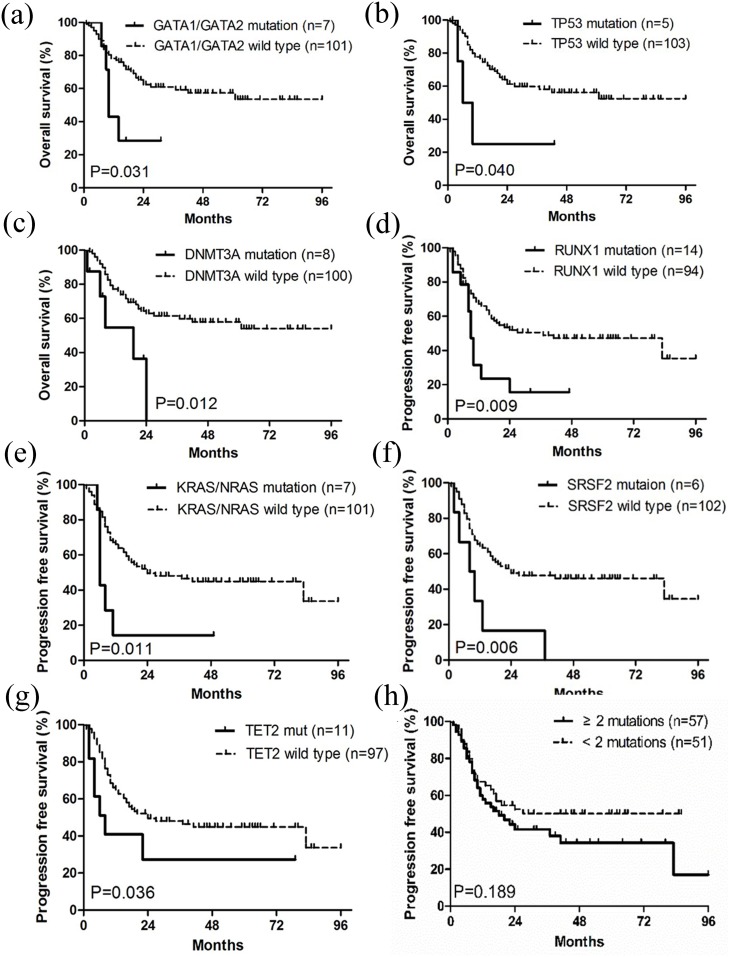
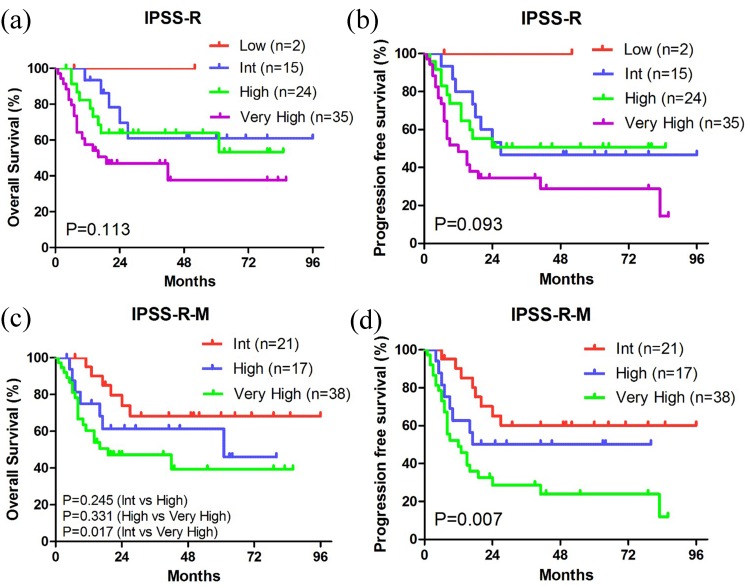
Myelodysplastic syndromes (MDS) are a group of myeloid hematological malignancies, with a high risk of progression to acute myeloid leukemia (AML). To explore the role of acquired mutations in MDS, 111 MDS-associated genes were screened using next-generation sequencing (NGS), in 125 patients. One or more mutations were detected in 84% of the patients. Some gene mutations are specific for MDS and were associated with disease subtypes, and the patterns of mutational pathways could be associated with progressive MDS. The patterns, frequencies and functional pathways of gene mutations are different, but somehow related, between MDS and AML. Multivariate analysis suggested that patients with ≥ 2 mutations had poor progression-free survival, while GATA1/GATA2, DNMT3A and KRAS/NRAS mutations were associated with poor overall survival. Based on a novel system combining IPSS-R and molecular markers, these MDS patients were further divided into 3 more accurate prognostic subgroups. A panel of 11 target genes was proposed for genetic profiling of MDS. The study offers new insights into the molecular signatures of MDS and the genetic consistency between MDS and AML. Furthermore, results indicate that MDS could be classified by mutation combinations to guide the administration of individualized therapeutic interventions.
Keywords: mutational spectrum; myelodysplastic syndromes; next-generation sequencing; risk stratification.
Conflict of interest statement
CONFLICTS OF INTEREST The authors declare there is no conflicts of interests.
Figures
References
-
- Tefferi A, Vardiman JW. Myelodysplastic syndromes. N Engl J Med. 2009;361:1872–85. https://doi.org/10.1056/NEJMra0902908. - DOI - PubMed
-
- Arber DA, Orazi A, Hasserjian R, Thiele J, Borowitz MJ, Le Beau MM, Bloomfield CD, Cazzola M, Vardiman JW. The 2016 revision to the World Health Organization classification of myeloid neoplasms and acute leukemia. Blood. 2016;127:2391–405. https://doi.org/10.1182/blood-2016-03-643544. - DOI - PubMed
-
- Cazzola M, Della Porta MG, Travaglino E, Malcovati L. Classification and prognostic evaluation of myelodysplastic syndromes. Semin Oncol. 2011;38:627–34. https://doi.org/10.1053/j.seminoncol.2011.04.007. - DOI - PubMed
-
- Greenberg P, Cox C, LeBeau MM, Fenaux P, Morel P, Sanz G, Sanz M, Vallespi T, Hamblin T, Oscier D, Ohyashiki K, Toyama K, Aul C, et al. International scoring system for evaluating prognosis in myelodysplastic syndromes. Blood. 1997;89:2079–88. - PubMed
-
- Miyazaki Y. [Revised international prognostic scoring system (IPSS-R) for myelodysplastic syndromes] Rinsho Ketsueki. 2013;54:545–51. - PubMed
LinkOut - more resources
Full Text Sources
Other Literature Sources
Research Materials
Miscellaneous
