. 2017 Sep 19;8(48):84006-84018.
doi: 10.18632/oncotarget.21061. eCollection 2017 Oct 13.

Downregulation of the Sonic Hedgehog/Gli pathway transcriptional target Neogenin-1 is associated with basal cell carcinoma aggressiveness

Affiliations

Downregulation of the Sonic Hedgehog/Gli pathway transcriptional target Neogenin-1 is associated with basal cell carcinoma aggressiveness

Bárbara S Casas et al. Oncotarget. .

Abstract

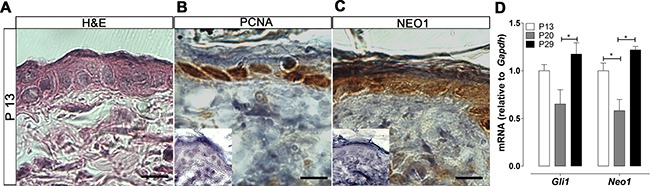
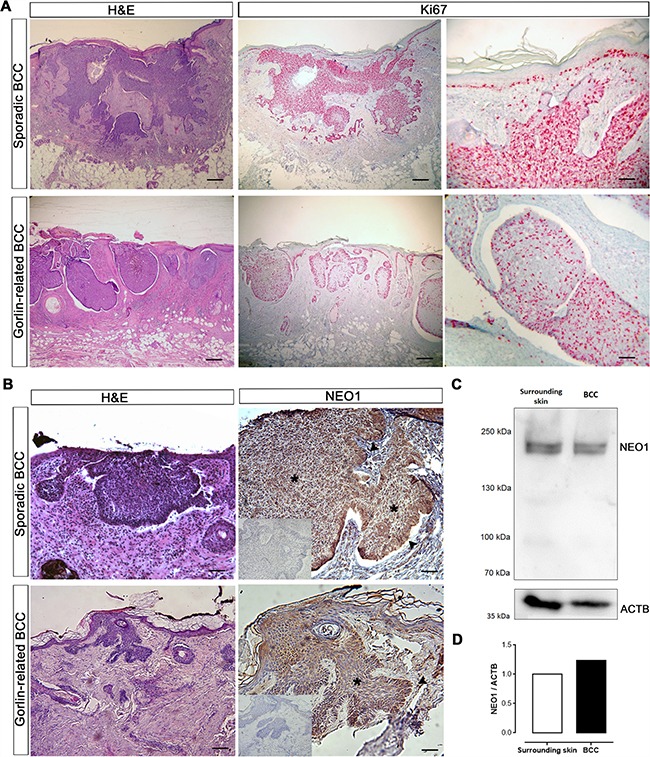
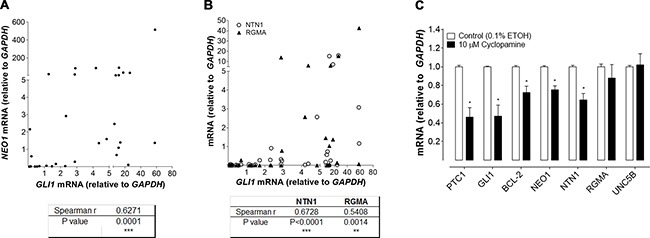
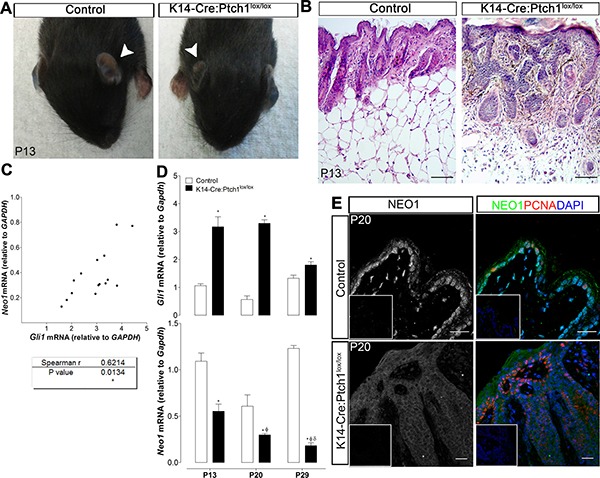
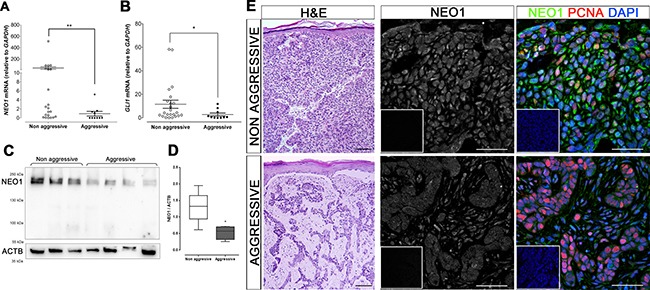
Basal Cell Carcinoma (BCC) is one of the most diagnosed cancers worldwide. It develops due to an unrestrained Sonic Hedgehog (SHH) signaling activity in basal cells of the skin. Certain subtypes of BCC are more aggressive than others, although the molecular basis of this phenomenon remains unknown. We have previously reported that Neogenin-1 (NEO1) is a downstream target gene of the SHH/GLI pathway in neural tissue. Given that SHH participates in epidermal homeostasis, here we analyzed the epidermal expression of NEO1 in order to identify whether it plays a role in adult epidermis or BCC. We describe the mRNA and protein expression profile of NEO1 and its ligands (Netrin-1 and RGMA) in human and mouse control epidermis and in a broad range of human BCCs. We identify in human BCC a significant positive correlation in the levels of NEO1 receptor, NTN-1 and RGMA ligands with respect to GLI1, the main target gene of the canonical SHH pathway. Moreover, we show via cyclopamine inhibition of the SHH/GLI pathway of ex vivo cultures that NEO1 likely functions as a downstream target of SHH/GLI signaling in the skin. We also show how Neo1 expression decreases throughout BCC progression in the K14-Cre:Ptch1lox/lox mouse model and that aggressive subtypes of human BCC exhibit lower levels of NEO1 than non-aggressive BCC samples. Taken together, these data suggest that NEO1 is a SHH/GLI target in epidermis. We propose that NEO1 may be important in tumor onset and is then down-regulated in advanced BCC or aggressive subtypes.

Keywords: BCC; Neogenin-1; Netrin-1; SHH/GLI pathway; tumor aggressiveness.


Conflict of interest statement

CONFLICTS OF INTEREST The authors of this paper declare no conflicts of interest.

Figures

Figure 1
Figure 1. NEO1 is expressed in human epidermal basal cells
(A) H&E of human skin showing stratum corneum (s.c), granulosum (s.g.) squamous (s.s.), and basale (s.b) of epidermis (scale bar = 250 μm). IHC analysis of NEO1 (B), PTCH1 (C), NTN1 (D) and RGMA (E) shows expression (brown staining) in the basal cell population of human skin epidermis. Hematoxylin (blue) counterstain used to distinguish nuclei. All images are representative photographs from n = 3 (bar = 25 μm). Negative controls are shown as insets.
Figure 2
Figure 2. Neo1 expression and Shh/Gli pathway activity cycle in post-natal mouse skin
(A) H&E of mouse epidermis. IHC analysis of the proliferation marker PCNA (B) and NEO1 (C) shows expression (brown stain) in the proliferative basal cell population. Images are representative photographs of n = 3 on P13 (bar = 25 μm). Negative controls are shown as insets. (D) mRNA levels of both Gli1 and Neo1 were assessed by qPCR, the expression of Gli1 and Neo1 cycle across different ages (n = 8). Data is shown as Mean ± SEM and normalized against mean value for P13 with *p < 0.05 according to Mann-Whitney test.
Figure 3
Figure 3. NEO1 is expressed in human BCC
(A) H&E of sporadic and Gorlin syndrome-related BCC biopsies (bar = 1000 μm). IHC of Ki67 (pink stain) shows highly proliferative tumor cells (bar = 1000 μm and 250 μm). Images are representative photographs of n = 32. (B) H&E of sporadic and Gorlin syndrome-related BCC biopsies (bar = 1000 μm). IHC analysis of NEO1 shows expression (brown staining) in nodules of human BCC biopsies both in the bulk of tumors (asterisk) and palisade (arrow). Hematoxylin (blue) counterstain was used to distinguish nuclei. Negative control of IHC is shown as an insert. Images are representative photographs from n = 32 for sporadic BCC and n = 4 for Gorlin syndrome-related BCC (bar = 500 μm). (C) NEO1 expression in a non-aggressive sporadic human BCC and its healthy surrounding skin was evaluated by WB, ACTB is shown as a loading control. (D) Graph depicting the levels of NEO1 in BCC compared to its surrounding skin evaluated in (c) and normalized by ACTB expression.
Figure 4
Figure 4. Positive correlation between NEO1 signaling and SHH/GLI pathway activation
(AB) mRNA levels of NEO1, GLI1, NTN1 and RGMA were quantified by qPCR in sporadic human BCC samples. (A) mRNA levels of NEO1 have a positive and significant correlation with GLI1 levels in human BCC samples (n = 32). Spearman r and P values were calculated and are shown in the table, ***p ≤ 0.001. (B) mRNA levels of NEO1 ligand: NTN1(○) and RGMA(▲) also correlate with GLI1 levels. For each ligand, Spearman r and P values were calculated and are shown in the table, **p < 0.01; ***p ≤ 0.001. (C) Five human BCC samples were cultured as explants and treated with 10 μM cyclopamine or vehicle control (ETOH 0.1%) for 48 h. Cyclopamine treatment decreases the expression of downstream targets such as GLI1, PTCH1, BCL2 and also NEO1. Of NEO1 ligands only NTN1 expression was diminished after inhibitor treatment. Levels of UNC5B, another reported NTN1 receptor with no-known relationship to the SHH/GLI pathway is shown as control. Data are represented as mean ± SEM with * p < 0.05 according to Mann-Whitney test.
Figure 5
Figure 5. Neo1 decreases with BCC tumor progression
(A) K14-Cre:Ptch1lox/lox mouse generate skin lesions, being the phenotype at early ages mostly evident in ears (white arrows indicate ears of control and K14-Cre:Ptch1lox/lox mice on P13) (B) H&E staining of ear skin showing micronodular BCC-like lesions in comparison to control skin on P13 mouse (bar = 100 μm). (C) mRNA levels were quantified by qPCR, showing a significant correlation between Gli1 and Neo1 levels on K14-Cre:Ptch1lox/lox skin (n = 7). (D) Gli1 mRNA levels of K14-Cre:Ptc1lox/lox skin (n = 7) are upregulated in comparison to age-matched controls skin (n = 8) at postnatal days P13, P20 and P29. Neo1 mRNA levels are downregulated in K14-Cre:Ptch1lox/lox in comparison to age-matched controls skin. Levels of Neo1 diminish significantly with tumor progression. Data is represented as mean ± SEM with p < 0.05 vs. age-matched control (*), K14-Cre:Ptc1lox/lox P13 (ϕ), or K14-Cre:Ptc1lox/lox P20 (δ); according to Mann-Whitney test. (E) NEO1 IF shows localization on basal cells of P20 control skin and dimmer staining on P20 K14-Cre:Ptch1lox/lox skin, both on tumor nodules and epidermis. Proliferating tumor and basal cells are identified by PCNA staining (red). DAPI (blue) was used for nuclei staining (bar = 20 μm). Negative controls are shown as insets.
Figure 6
Figure 6. Low levels of NEO1 are related with BCC aggressiveness
(AE) Subtypes of sporadic human BCC samples were assessed by histomorphological analysis. mRNA levels of both NEO1 (A) and GLI1 (B) of aggressive BCC subtypes (n = 10) are significantly lower than levels of non-aggressive BCC (n = 22). Data is represented as mean ± SEM with *p < 0.05, **p< 0.01; according to Mann-Whitney test. (C) Representative WB membrane of NEO1 expression in non-aggressive and aggressive BCC subtypes, ACTB is shown as a loading control. (D) The levels of NEO1 in non-aggressive BCC is higher than in aggressive BCC subtypes. Data correspond to n = 8 for non-aggressive BCC samples and n = 4 for aggressive BCC samples and are normalized against ACTB expression. *p < 0.05, according to Mann-Whitney test. (E) H&E of representative BCC biopsies (left column, bar = 250 μm) show histological differences between aggressive and non-aggressive BCC subtypes. IF for NEO1 (green) and PCNA (red) of tumor nodules of these samples show strong staining on non-aggressive tumor cells and dimmer staining for aggressive tumor cells. DAPI (blue) was used for nuclei staining (bar = 50 μm). Negative controls are shown as insets.

Similar articles

Cited by

References

    1. Madan V, Lear JT, Szeimies R. Non-melanoma skin cancer. Lancet. 2010;375:673–85. https://doi.org/10.1016/S0140-6736(09)61196-X. - DOI - PubMed
    1. Aszterbaum M, Epstein J, Oro A, Douglas V, LeBoit PE, Scott MP, Epstein EH. Ultraviolet and ionizing radiation enhance the growth of BCCs and trichoblastomas in patched heterozygous knockout mice. Nat Med. 1999;5:1285–91. https://doi.org/10.1038/15242. - DOI - PubMed
    1. Yu M, Zloty D, Cowan B, Shapiro J, Haegert A, Bell RH, Warshawski L, Carr N, McElwee KJ. Superficial, nodular, and morpheiform basal-cell carcinomas exhibit distinct gene expression profiles. J Invest Dermatol. 2008;128:1797–805. https://doi.org/10.1038/sj.jid.5701243. - DOI - PubMed
    1. Kasper M, Jaks V, Hohl D, Toftgård R. Review series basal cell carcinoma: molecular biology and potential new therapies. J Clin Invest. 2012;122:455–63. https://doi.org/10.1172/JCI58779. - DOI - PMC - PubMed
    1. Crowson AN. Basal cell carcinoma: biology, morphology, and clinical implications. Mod Pathol. 2006;19:S127–47. https://doi.org/10.1038/modpathol.3800512. - DOI - PubMed