. 2017 Nov 14;15(1):48.
doi: 10.1186/s12964-017-0204-z.

Human hyaluronic acid synthase-1 promotes malignant transformation via epithelial-to-mesenchymal transition, micronucleation and centrosome abnormalities

Affiliations

Human hyaluronic acid synthase-1 promotes malignant transformation via epithelial-to-mesenchymal transition, micronucleation and centrosome abnormalities

Nguyet Nguyen et al. Cell Commun Signal. .

Abstract

Background: Human hyaluronic acid (HA) molecules are synthesized by three membrane spanning Hyaluronic Acid Synthases (HAS1, HAS2 and HAS3). Of the three, HAS1 is found to be localized more into the cytoplasmic space where it synthesizes intracellular HA. HA is a ubiquitous glycosaminoglycan, mainly present in the extracellular matrix (ECM) and on the cell surface, but are also detected intracellularly. Accumulation of HA in cancer cells, the cancer-surrounding stroma, and ECM is generally considered an independent prognostic factors for patients. Higher HA production also correlates with higher tumor grade and more genetic heterogeneity in multiple cancer types which is known to contribute to drug resistance and results in treatment failure. Tumor heterogeneity and intra-tumor clonal diversity are major challenges for diagnosis and treatment. Identification of the driver pathway(s) that initiate genomic instability, tumor heterogeneity and subsequent phenotypic/clinical manifestations, are fundamental for the diagnosis and treatment of cancer. Thus far, no evidence was shown to correlate intracellular HA status (produced by HAS1) and the generation of genetic diversity in tumors.

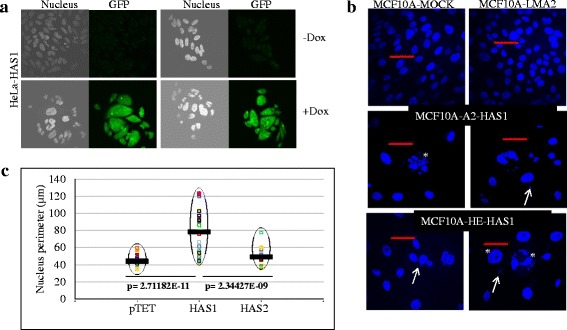
Methods: We tested different cell lines engineered to induce HAS1 expression. We measured the epithelial traits, centrosomal abnormalities, micronucleation and polynucleation of those HAS1-expressing cells. We performed real-time PCR, 3D cell culture assay, confocal microscopy, immunoblots and HA-capture methods.

Results: Our results demonstrate that overexpression of HAS1 induces loss of epithelial traits, increases centrosomal abnormalities, micronucleation and polynucleation, which together indicate manifestation of malignant transformation, intratumoral genetic heterogeneity, and possibly create suitable niche for cancer stem cells generation.

Conclusions: The intracellular HA produced by HAS1 can aggravate genomic instability and intratumor heterogeneity, pointing to a fundamental role of intracellular HA in cancer initiation and progression.

Keywords: Chromosomal instability and Centrosome abnormalities; Epithelial-to-Mesenchymal transition; Genetic heterogeneity; Genomic instability; Hyaluronic acid Synthase-1; Malignant transformation; Micronucleus.


Conflict of interest statement

Ethics approval and consent to participate

Not applicable.

Consent for publication

Not applicable.

Competing interests

The authors declare that they have no competing interests.

Publisher’s Note

Springer Nature remains neutral with regard to jurisdictional claims in published maps and institutional affiliations.

Figures

Fig. 1
Fig. 1
Overexpression of epitope-tagged human HAS1 increases cytoplasmic HA concentration in MCF10A cells. a Non-tumorogenic mammary cell line (MCF10A) expressing HAS1 shows significantly more HA staining (green) in comparison to protozoa-gene transfected MCF10A-LMA2 (control). The punctate localization of HAS1-synthesized HA inside the cell was observed. MCF10A-HE-HAS1: HAS1 in pCDNA3 with N-terminal hemagglutinin fusion-tag, MCF10A-A2-HAS1: HAS1 in pCDNA3 with N-terminal A2 fusion-tag, and MCF10A-LMA2: a Leishmania major (protozoa) gene (Lm2415) in pCDNA3 with C-terminal A2 fusion tag. The HAS1 in pCEP4 with N-terminal A2 fusion-tag is shown as ‘MCF10A-A2-HAS1 (in pCEP4). b MCF10A-A2-HAS1 and MCF10A-HE-HAS1 cells are brightly stained for HA (green) and CD44 (red) in comparison to MCF10A-LMA2 cells. The cells indicated in (A) were subjected to both HA and CD44 immunofluorescence staining. The middle panel shows the bright-field image to identify the edge of the cells. Nuclei were stained with DAPI (blue). Multiple focused- or Z-stacking images were used to compile these composite images for complete top-vision across the thickness of the cells
Fig. 2
Fig. 2
Overexpression of HAS1 induces Epithelial-to-Mesenchymal Transition (EMT) in MCF10A cells. a The normal mammary cell line MCF10A was mock transfected (left), or transfected with a plasmids that express HAS1 (middle) or an unrelated protozoa gene LMA2 (right). The selected populations were cultured in 3D reconstituted basement-membrane model. Both control panels (right and left) show acini structure in contrast to middle panel. b MCF10A cells were transfected as described in (a) and subjected to EMT analysis using the common EMT markers E-cadherin (Epithelial) and N-cadherin (Mesenchymal) using RT-qPCR. The relative expression of E-cadherin is diminished, however N-cadherin is over-expressed in MCF10A-HAS1 cells
Fig. 3
Fig. 3
Prolonged expression of HAS1 increases clonal diversity. a A spectrum of clonal diversities was observed in the Dox-induced populations (lower panels) varying widely in nuclear/cytoplasmic sizes and shapes. The Dox induction was verified with higher GFP expression in +Dox cells (lower panel) then the –Dox controls (upper panel). This figure is representative of at least 5 individual induction experiments. b MCF10A cells were transfected with plasmids as indicated in Fig. 1a. HAS1 transfected cells show variation of the nuclear size and shapes demonstrating clonal variations. The resulted cell population were found homogenous in control mock transfected (upper left) as well as irrelevant control protein expressing (LMA2) cells (upper right). White arrows show micro-nucleus, asterisk indicate multi-nucleated or huge donut-shaped nucleus, and the red bar is 50 μm. c DLD1 colorectal adenocarcinoma cell line was transfected and selected with Tet-inducible HAS1 or HAS2 or control (pTET) systems, fixed and stained the nucleus with DAPI (blue). HAS1 and HAS2 cells showed much diversity in nuclear perimeter size in comparison to pTET cells (control). The cells were observed under confocal microscope and photographed for multiple fields from each slides. The nuclear perimeter (without micronucleus) were marked and measured with Olympus FV1000 software. The average perimeter is marked with thick horizontal bars. The range of nuclear size/morphological diversity is shown in dashed elliptical areas
Fig. 4
Fig. 4
HAS1 expression induces micronucleation. a A2-HAS1 and HE-HAS1 has more micro-nuclei than LMA2 and Mock transfected MCF10A cells. The average number of micronucleus / 100 nuclei from the cells are presented from 6 microscopic fields (40×) with respective standard errors. b HAS1 [but not pTET (control) or HAS2 cells] induced micronucleation in transfected DLD1 cells with short-term induction. Average numbers of micronucleus/100 nuclei are presented with standard error bar. c The long-term (4 weeks) culture of Dox-induced cells (from Fig. B) continue to produce micronuclei only when HAS1s were expressed but not for cell alone (DLD1, maintained in Tet-free media for 10 weeks), pTET-control cells or HAS2 transfected cells. Average number of micronucleus / 100 nuclei are presented with standard error bar. d Sample photographs of Tet-inducible DLD1-cells induced for 100 h. The micronuclei were observed in HAS1 expressing cells only (middle panel) and indicated with arrow-heads
Fig. 5
Fig. 5
HAS1 expression induces centrosomal abnormalities. a MCF10A cells transfected with indicated plasmids were selected followed by centrosome staining using an antibody against pericentrin. The nucleus was stained with DAPI (blue). The left column shows the composite image of pericentrin (white) and nucleus (blue). The red and green scale bars on the left-panels are 10 μm each. The right-top-panels show zoom-in of the indicated area from the left panels (pericentrin as green). Bottom right panels are the magnification of the indicated dotted area from the right-top panels to visualize only pericentrin staining (green). The white bar is 1 μm in lower right panels. b Representative images of centrosomal abnormalities in DLD1 cells (left panel) and HeLa cells (right panel). Cells expressing HAS1 (middle panels) for both cell lines show centrosomal abnormalities but no such event was observed in pTET (upper panels) and HAS2 (lower panels) expressing cells. The cells population were immunostained for pericentrin (red) and the nucleus stained with DAPI (blue). Tetracycline-inducible lines (DLD1 and HeLa) were passaged though continuous Dox exposure to induce HAS1 and HAS2 mediated HA synthesis for many generations (10 weeks). The pTET cells were used as controls. c The average fluorescence intensity of pericentrin staining per nucleus was calculated from at least four random regions of interest (ROI) and represented with the standard errors. The DLD1 cells expressing HAS1 has higher intensity than DLD1 cells alone, pTET and HAS2 expressing cells. Relative fluorescent intensity of the red channel (pericentrin) from the confocal images was collected for ROI and the total number of nucleus was counted. Multiple focused- or Z-stacking images were used to compile these composite images for complete coverage across the thickness of the cells
Fig. 6
Fig. 6
HAS1-synthesized HA interacts with RHAMM. a RHAMM and its splice variants are associated with cellular HA (synthesized from HAS1 overexpression) during mitosis and G1/S phase. HeLa cells were co-transfected with plasmids expressing A2-tagged HAS1 (A2-HAS1) and full-length GFP-tagged RHAMM (RHAMM-GFP) or the splice-variants of RHAMM (RHAMM-Ex4-GFP). Cell populations were synchronized in Mitosis or G1/S using thymidine block and synchronization was verified using flow cytometry (Supplementary Fig. 3B). Total cellular HA was isolated using biotinylated bovine HA-binding-protein and streptavidin-conjugated magnetic beads. The isolated beads were treated (+) with hyaluronidase (HAase). Samples were subjected to immunoblotting for RHAMM and HAS1. b BRCA1 interacted with RHAMM isoforms but not with the other HA-binding protein Neurocan. GFP-tagged RHAMM isoforms and GFP-ΔNeurocan were expressed in HeLa cells and HA-binding proteins were isolated from the cell lysates using biotinylated-HA as “bait”. Immunoblotting of pull-down material with and without HAase treatment revealed that endogenous BRCA1 were found to be associated with RHAMM isoforms (but not with Neurocan), suggesting that BRCA1 may interact directly with RHAMM

Similar articles

Cited by

References

    1. Auvinen P, Tammi R, Parkkinen J, Tammi M, Agren U, Johansson R, Hirvikoski P, Eskelinen M, Kosma VM. Hyaluronan in peritumoral stroma and malignant cells associates with breast cancer spreading and predicts survival. Am J Pathol. 2000;156:529–536. doi: 10.1016/S0002-9440(10)64757-8. - DOI - PMC - PubMed
    1. Auvinen P, Rilla K, Tumelius R, Tammi M, Sironen R, Soini Y, Kosma VM, Mannermaa A, Viikari J, Tammi R. Hyaluronan synthases (HAS1-3) in stromal and malignant cells correlate with breast cancer grade and predict patient survival. Breast Cancer Res Treat. 2014;143:277–286. doi: 10.1007/s10549-013-2804-7. - DOI - PubMed
    1. Siiskonen H, Oikari S, Pasonen-Seppanen S, Rilla K. Hyaluronan synthase 1: a mysterious enzyme with unexpected functions. Front Immunol. 2015;6:43. doi: 10.3389/fimmu.2015.00043. - DOI - PMC - PubMed
    1. Tammi MI, Day AJ, Turley EA. Hyaluronan and homeostasis: a balancing act. J Biol Chem. 2002;277:4581–4584. doi: 10.1074/jbc.R100037200. - DOI - PubMed
    1. Wernicke M, Pineiro LC, Caramutti D, Dorn VG, Raffo MM, Guixa HG, Telenta M, Morandi AA. Breast cancer stromal myxoid changes are associated with tumor invasion and metastasis: a central role for hyaluronan. Mod Pathol. 2003;16:99–107. doi: 10.1097/01.MP.0000051582.75890.2D. - DOI - PubMed

Publication types

MeSH terms

LinkOut - more resources