. 2017 Oct 15;31(20):2085-2098.
doi: 10.1101/gad.297796.117. Epub 2017 Nov 14.

Coupling shRNA screens with single-cell RNA-seq identifies a dual role for mTOR in reprogramming-induced senescence

Affiliations

Coupling shRNA screens with single-cell RNA-seq identifies a dual role for mTOR in reprogramming-induced senescence

Marieke Aarts et al. Genes Dev. .

Abstract

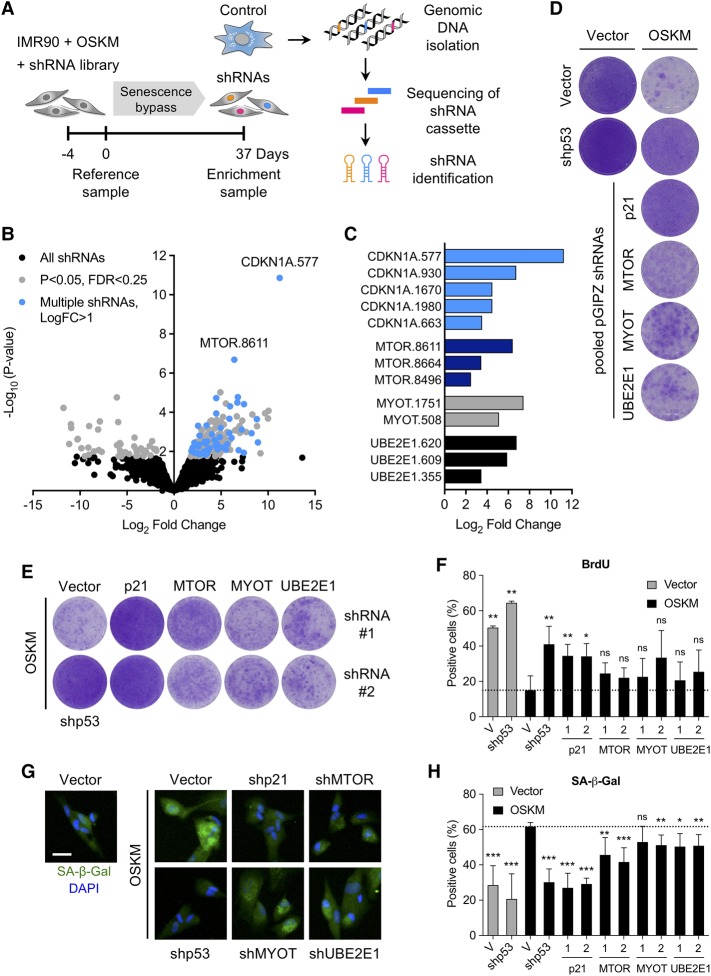
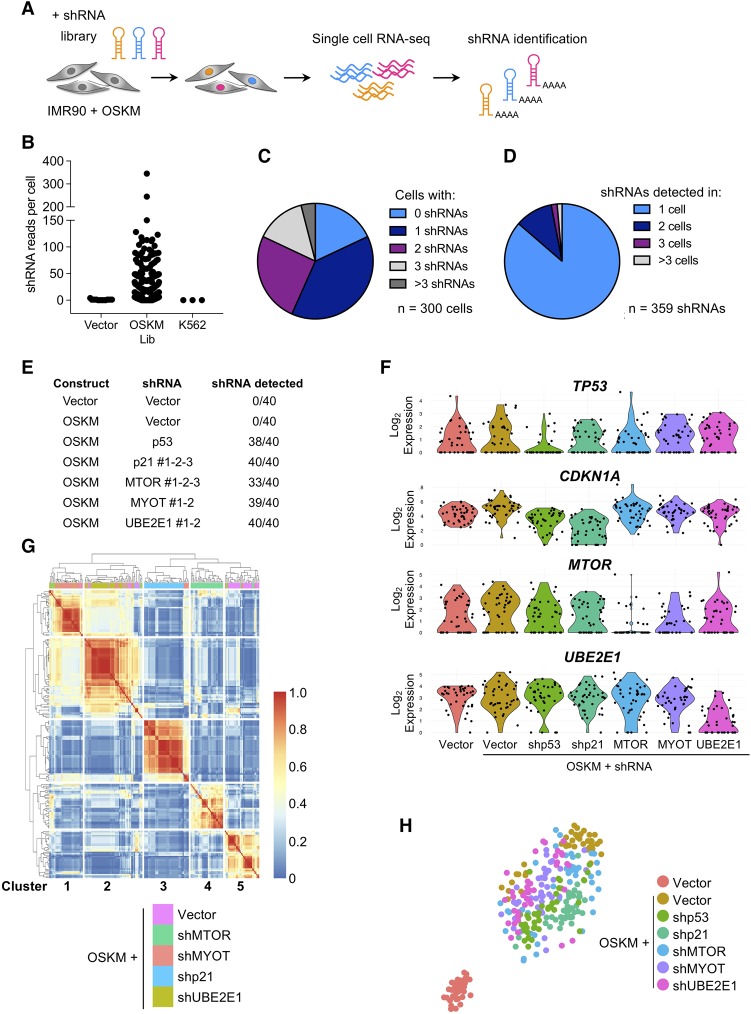
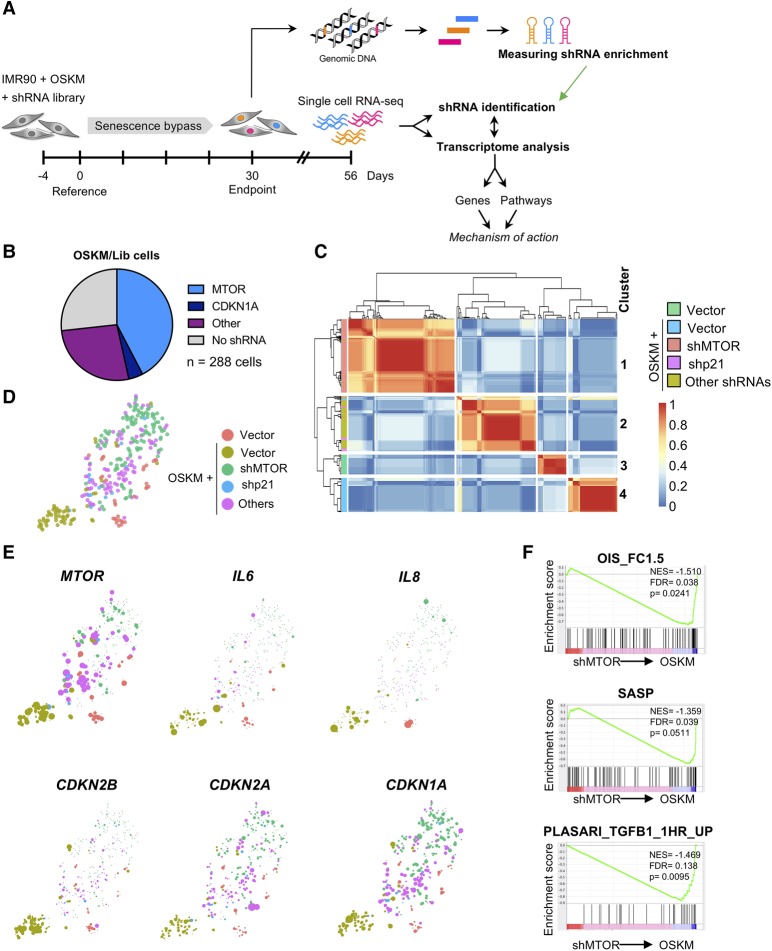
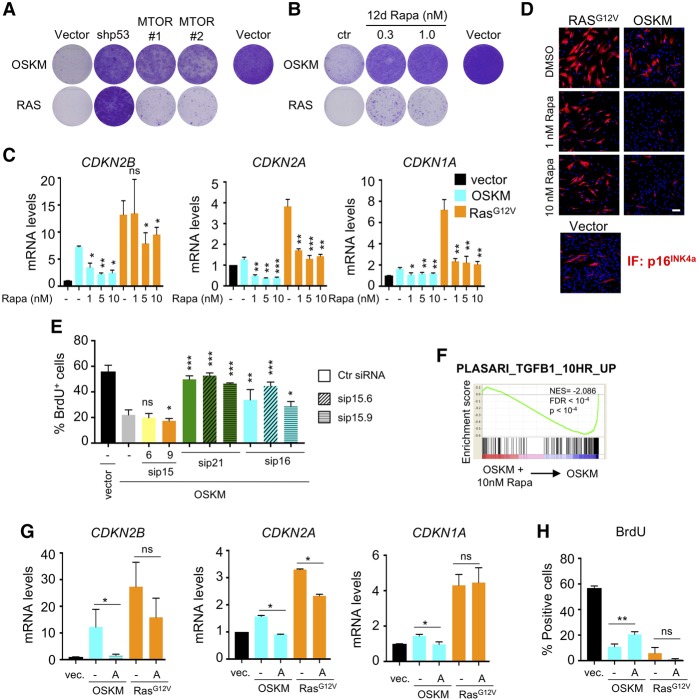
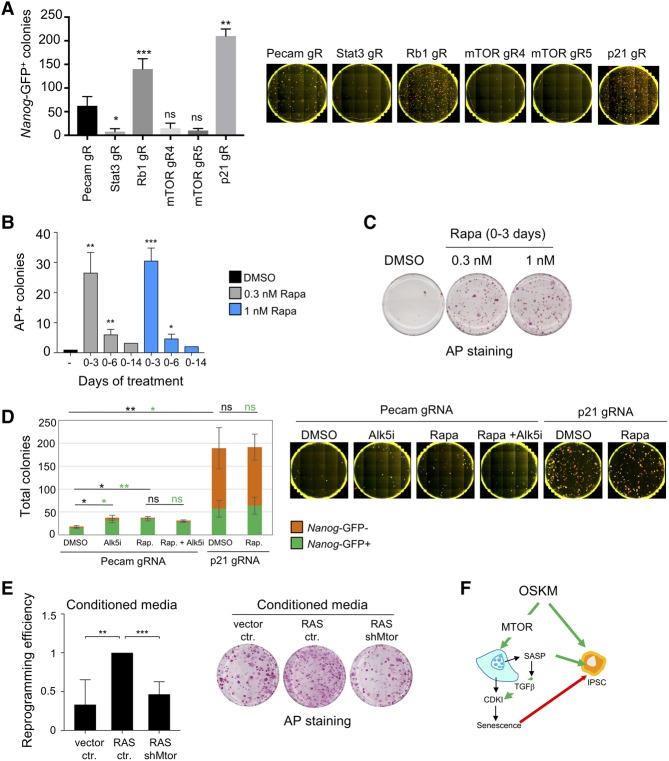
Expression of the transcription factors OCT4, SOX2, KLF4, and cMYC (OSKM) reprograms somatic cells into induced pluripotent stem cells (iPSCs). Reprogramming is a slow and inefficient process, suggesting the presence of safeguarding mechanisms that counteract cell fate conversion. One such mechanism is senescence. To identify modulators of reprogramming-induced senescence, we performed a genome-wide shRNA screen in primary human fibroblasts expressing OSKM. In the screen, we identified novel mediators of OSKM-induced senescence and validated previously implicated genes such as CDKN1A We developed an innovative approach that integrates single-cell RNA sequencing (scRNA-seq) with the shRNA screen to investigate the mechanism of action of the identified candidates. Our data unveiled regulation of senescence as a novel way by which mechanistic target of rapamycin (mTOR) influences reprogramming. On one hand, mTOR inhibition blunts the induction of cyclin-dependent kinase (CDK) inhibitors (CDKIs), including p16INK4a, p21CIP1, and p15INK4b, preventing OSKM-induced senescence. On the other hand, inhibition of mTOR blunts the senescence-associated secretory phenotype (SASP), which itself favors reprogramming. These contrasting actions contribute to explain the complex effect that mTOR has on reprogramming. Overall, our study highlights the advantage of combining functional screens with scRNA-seq to accelerate the discovery of pathways controlling complex phenotypes.

Keywords: SASP; iPSCs; senescence; shRNA screens; single-cell RNA-seq.


Figures

Figure 1.
Figure 1.
Expression of OSKM results in the induction of a characteristic senescence program in IMR90 human fibroblasts. (A) Senescence markers in IMR90 fibroblasts infected with control (vector), a polycistronic vector expressing OSKM or RAS. At 12 d after infection, senescence was assayed by crystal violet staining (top), senescence-associated β-galactosidase (SA-β-Gal) activity (middle), and BrdU incorporation after an 18-h pulse (bottom). Bar, 100 µM. (B) Quantification of BrdU and SA-β-Gal-positive cells after infection with the indicated vectors. (***) P < 0.001. (C) Quantitative RT–PCR (qRT–PCR) showing the mRNA expression levels of CDKN2B (encoding p15INK4b), CDKN2A (p16INK4a), and CDKN1A (p21CIP1) after infection with the indicated vectors. (*) P < 0.05; (***) P < 0.001. (D) Gene set enrichment analysis (GSEA) showing enrichment of signatures associated with senescence and the SASP in OSKM versus vector-expressing IMR90 cells. (NES) Normalized enrichment score. (E) Heat map showing gene expression of cell cycle genes (Chang et al. 2004) for IMR90 cells infected with vector, RAS, and OSKM. Log2 expression values (rlog) were row-normalized using Z-scores, and only genes that have higher expression in RAS or OSKM compared with vector are shown in the heat map. Both genes and samples were clustered using hierarchical clustering. (F) Scatter plot showing log2 fold change (FC) in gene expression between RAS versus vector and OSKM versus vector. Genes changing (false discovery rate [FDR] < 0.05; log2 fold change < −1 or log2 fold change > 1) are shown in color. (G) Venn diagram showing common down-regulated genes between RAS versus vector and OSKM versus vector. Down-regulated genes were defined as those with log2 fold change < −1 and FDR < 0.05. (H,I) Gene ontology (GO) term analysis of common genes down-regulated upon OSKM- and RAS-induced senescence (H) or down-regulated only in OSKM-induced senescence (I). First, for each senescence type, genes differentially regulated compared with control (vector) by log2 fold change < −1 (P < 0.05) were selected. Next, common genes were uploaded to the online bioinformatics database Metascape (http://metascape.org) for GO term detection and clustering. Same-colored dots fall into a function category similar to the given title. Only statistically significant categories (P < 0.05) are shown.
Figure 2.
Figure 2.
An shRNA screen identifies modulators of reprogramming-induced senescence. (A) Time line and strategy of a secondary shRNA enrichment screen. IMR90 fibroblasts were infected with an OSKM expression vector followed by a pooled shRNA library in duplicate. Samples for analysis of shRNA library representation were taken at regular intervals over a 37-d culture period. Two independent biological shRNA screens were performed. (B) Volcano plot depicting the changes in representation (log2 fold change; X-axis) and significance (−log10-converted P-value; Y-axis) of each shRNA in the library at day 37 versus day 0. Total library (black; 3153 shRNAs), enriched shRNAs (gray; P < 0.05; FDR < 0.25; 229 shRNAs), and candidates with multiple shRNAs (blue; log2 fold change > 1; 52 shRNAs) are shown. The top shRNAs targeting CDKN1A and MTOR are highlighted. EdgeR statistical analysis was used to combine and batch-correct data from two independent biological screens. (C) Significantly enriched (log2 fold change) shRNAs for CDKN1A, MTOR, MYOT, and UBE2E1. (D) Initial validation of candidates identified in the secondary screen. IMR90 fibroblasts were infected with control or OSKM expression vector and pooled pGIPZ shRNAs against the indicated candidates. Cell proliferation was assayed by crystal violet staining. (E) IMR90 fibroblasts were infected with OSKM followed by two different shRNAs against p21, MTOR, MYOT, and UBE2E1. At 12 d after infection, cells were seeded at low density. After 16 d, plates were stained with crystal violet. Images are from a representative experiment. (F) IMR90 fibroblasts were infected with empty vector (gray bars) or OSKM (black bars) followed by shp53 or two different shRNAs against p21, MTOR, MYOT, and UBE2E1 or control vector (V). At 12 d after infection, cells were seeded in 96-well plates and cultured for another 5 d. The percentage of BrdU-positive cells was determined by immunofluorescence after an 18-h pulse with BrdU. Error bars represent the SD of three independent experiments. (*) P < 0.05; (**) P < 0.01; (ns) not significant. (G) IMR90 fibroblasts were treated as described in F. At 12 d after infection, cells were seeded in 96-well plates. The next day, SA-β-Gal activity was determined by fluorescence staining. Representative images are shown for cells infected with the indicated vectors. Bar, 30 µm. (H) Quantification of SA-β-Gal-positive cells treated as described in G. (Gray bars) Cells infected with empty vector control (V); (black bars) cells infected with OSKM vector. Error bars represent the SD of at least three independent experiments. (*) P < 0.05; (**) P < 0.01; (***) P < 0.001; (ns) not significant.
Figure 3.
Figure 3.
Coupling scRNA-seq with shRNA assignment identifies expression profiles associated with gene knockdown. (A) Strategy of scRNA-seq analysis of IMR90 cells infected with OSKM and an shRNA library. RNA-seq libraries were prepared using the ICELL8 single-cell system. (B) The number of shRNA-specific reads plotted for IMR90 cells infected with empty shRNA vector (no shRNA-specific insert; n = 50), OSKM and shRNA library cells (OSKM/Lib; n = 300), and K562 control cells that were not exposed to shRNA vectors (n = 50). (C) Pie chart showing the number of different shRNAs that could be detected per cell. One or more shRNAs could be detected in 82% of the single-cell libraries (246 out of 300), while 18% (54 out of 300) had no detectable shRNA reads. (D) Pie chart showing the occurrence of the 359 different shRNAs that were detected in 300 OSKM/Lib RNA-seq libraries. Overall, 86% (310 out of 359) of the shRNAs were found uniquely in one cell, while 14% (49 out of 359) of the hairpins were detected in two or more cells. (E) Experimental setup of the scRNA-seq experiment. Vector or OSKM-expressing IMR90 cells were infected with the indicated shRNAs. For each condition, 40 single cells were used for scRNA-seq analysis. RNA-seq libraries were prepared using the ICELL8 single-cell system (WaferGen Biosystems). (F) Violin plots of TP53, CDKN1A, MTOR, and UBE2E1 mRNA expression of single cells infected with the indicated constructs. (G) Heat map and clustering analysis of differentially expressed genes of OSKM-expressing cells infected with vector, shp21, shMTOR, shMYOT, and shUBE2E1 resulted in five clusters, each enriched for cells containing shRNAs targeting a different gene. (H) The t-distributed stochastic neighbor embedding (t-SNE) plot of the 280 single cells depicts the separation into shp53, shMTOR, shCDKN1A, shMYOT, and shUBE2E1 relative to vector and OSKM control cells.
Figure 4.
Figure 4.
Integrating scRNA-seq analysis with an shRNA screen. (A) Time line and strategy of a secondary shRNA enrichment screen combined with scRNA-seq. IMR90 fibroblasts were infected as described in Figure 2A. From the second repeat screen, 288 single cells were sorted from one replicate at day 56 for transcriptome analysis by RNA-seq in parallel with genomic DNA isolation for shRNA enrichment analysis. scRNA-seq libraries were prepared using the Smart-seq2 protocol (Picelli et al. 2014). (B) Pie chart representing the shRNA occurrence among 288 single-cell libraries. The shRNA read count threshold was set at ≥10 for identification of shRNAs. (C) Heat map and clustering analysis of differentially expressed genes of OSKM/Lib cells compared with vector and OSKM cells results in separation of OSKM-expressing cells containing an shRNA against MTOR versus other shRNAs. (D) The t-SNE plot of the 288 single OSKM/Lib cells depicts the separation into shMTOR, shCDKN1A, and other shRNAs relative to vector and OSKM control cells. (E) Projection of MTOR, IL6, IL8, CDKN1A, CDKN2A, and CDKN2B onto the t-SNE plot from D is shown. (F) GSEA showing loss of signatures associated with senescence, the SASP, and TGF-β in OSKM–shMTOR cells versus OSKM control cells. (NES) Normalized enrichment score.
Figure 5.
Figure 5.
Investigating how mTOR inhibition affects OSKM-induced senescence. (A) Knockdown of MTOR by two different shRNAs prevented the growth arrest induced by OSKM (top row), but not by RAS (bottom row), as measured by crystal violet staining. (B) Inhibition of mTOR by rapamycin prevents the growth arrest induced by OSKM (top row) but not by RAS (bottom row). IMR90 fibroblasts were infected with OSKM or RAS and treated with 0.3 and 1.0 nM rapamycin (Rapa) the next day. At 12 d after infection, cells were seeded at low density and cultured for 16 more days in the absence of rapamycin before plates were stained with crystal violet. (C,D) Inhibition of mTOR by rapamycin blunts the induction of CDKIs, but the levels revert back to basal only in OSKM-induced senescence. IMR90 fibroblasts were infected with empty vector or OSKM- or RAS-expressing vectors and were treated the next day with DMSO (−) or increasing doses of rapamycin. At day 10 after infection, the cells were collected for qRT–PCR analysis of mRNA expression (C) or immunofluorescence (D) of the indicated CDKIs. Error bars represent the SD of three independent experiments. (*) P < 0.05; (**) P < 0.01; (***) P < 0.001; (ns) not significant. Bar, 100 μm. (E) CDKN2B, CDKN2A, and CDKN1A are up-regulated by OSKM expression, but only the latter two are necessary for OSKM-induced growth arrest. IMR90 fibroblasts were infected with empty vector or OSKM-expressing vector and, 2 d later, transfected with scramble siRNA (−), the indicated siRNAs, or combinations of siRNAs. BrdU quantification was performed at day 7 after infection. Error bars represent the SD of three independent experiments. (*) P < 0.05; (**) P < 0.01; (***) P < 0.001; (ns) not significant. (F) GSEA showing loss of a TGF-β signature in OSKM cells treated with 10 nM rapamycin versus OSKM cells. (NES) Normalized enrichment score. (G) Signaling via TGF-β RI kinase is necessary for the induction of the three CDKIs in OSKM-induced senescence but not RAS-induced senescence. IMR90 fibroblasts were infected with empty vector or OSKM- or RAS-expressing vectors and treated the next day with DMSO (−) or 23 nM TGF-β RI kinase inhibitor II (A; Calbiochem, 616452). At day 10 after infection, the cells were collected for qRT–PCR analysis of mRNA expression of the indicated CDKIs. Error bars represent the SD of three independent experiments. (*) P < 0.05; (ns) not significant. (H) Signaling via TGF-β RI kinase is necessary for OSKM-induced growth arrest but not RAS-induced growth arrest. IMR90 fibroblasts were infected with empty vector or OSKM- or RAS-expressing vectors and treated with DMSO (−) or 23 nM TGF-β RI kinase inhibitor II (A; Calbiochem, 616452). BrdU quantification was performed at day 9 after infection. Error bars represent the SD of three independent experiments (**) P < 0.01; (ns) not significant.
Figure 6.
Figure 6.
Dual effect of mTOR inhibition in iPSC reprogramming. (A) Reprogramming of Cas9-expressing TNG MKOS MEFs was initiated 1 d after transfection with a piggyBac transposon carrying an inducible MKOS cassette and the indicated gRNA expression gRNA expression cassette. Numbers of total and Nanog-GFP+ colonies were counted on day 14. See Supplemental Figure S7, B and C, for an expanded version of this figure. Error bars represent the SD of three independent experiments. (*) P < 0.05; (**) P < 0.01; (***) P < 0.001; (ns) not significant. (B) Dose- and time-dependent effect of rapamycin on reprogramming. Rapamycin (0.3 and 1.0 nM) was added for 3, 6, or 14 d after MKOS induction. Resulting iPSC colonies were stained for alkaline phosphatase (AP) after 14 d. Data were normalized to untreated cells. Error bars represent the SD of three independent experiments (days 0–3 and 0–6). Data from one experiment are shown for days 0–14. (*) P < 0.05; (**) P < 0.01; (***) P < 0.001. (C) Dose-dependent effect of rapamycin on reprogramming. Rapamycin (0.3 and 1.0 nM) was added for 3 d after MKOS induction. Resulting iPSC colonies were stained for alkaline phosphatase after 14 d. (D) Reprogramming of Cas9-expressing Nanog-GFP MEFs was performed after transfection of a piggyBac transposon carrying inducible MKOS-ires-mOrange and U6-driven gRNA expression cassettes in the presence or absence of 500 nM TGF-β RI inhibitor (Alk5i; Tocris, A83-01) and 5 nM rapamycin (Rap). Numbers of total and Nanog-GFP+ colonies were counted on day 14. Error bars represent the SD of three independent experiments. (*) P < 0.05; (**) P < 0.01; (ns) not significant. (Green) Statistics for Nanog+ colonies; (black) statistics for total number of colonies. (E) Reprogramming efficiency of transgenic MKOS MEFs treated with conditioned medium (CM) from MEFs infected with control vector, RAS, or RAS and shRNAs against Mtor. CM was collected after 3 d and reconstituted with 4× concentrated reprogramming medium before being added to the transgenic MEFs. Alkaline phosphatase-positive (AP+) colonies were counted, and data were normalized to cells treated with CM from RAS/ctr. Error bars represent the SD of four independent experiments. (**) P < 0.01; (***) P < 0.001. Representative images are shown. (F) Scheme summarizing the dual action of MTOR on regulation of senescence and reprogramming of iPSCs. (Green arrows) induction; (red arrow) inhibition.

References

    1. Acosta JC, O'Loghlen A, Banito A, Guijarro MV, Augert A, Raguz S, Fumagalli M, Da Costa M, Brown C, Popov N, et al. 2008. Chemokine signaling via the CXCR2 receptor reinforces senescence. Cell 133: 1006–1018. - PubMed
    1. Adamson B, Norman TM, Jost M, Cho MY, Nunez JK, Chen Y, Villalta JE, Gilbert LA, Horlbeck MA, Hein MY, et al. 2016. A multiplexed single-cell CRISPR screening platform enables systematic dissection of the unfolded protein response. Cell 167: 1867–1882 e1821. - PMC - PubMed
    1. Baker DJ, Childs BG, Durik M, Wijers ME, Sieben CJ, Zhong J, Saltness RA, Jeganathan KB, Verzosa GC, Pezeshki A, et al. 2016. Naturally occurring p16(Ink4a)-positive cells shorten healthy lifespan. Nature 530: 184–189. - PMC - PubMed
    1. Banito A, Gil J. 2010. Induced pluripotent stem cells and senescence: learning the biology to improve the technology. EMBO Rep 11: 353–359. - PMC - PubMed
    1. Banito A, Rashid ST, Acosta JC, Li S, Pereira CF, Geti I, Pinho S, Silva JC, Azuara V, Walsh M, et al. 2009. Senescence impairs successful reprogramming to pluripotent stem cells. Genes Dev 23: 2134–2139. - PMC - PubMed