. 2017 Oct 15;31(20):2023-2038.
doi: 10.1101/gad.305888.117. Epub 2017 Nov 14.

The secreted neurotrophin Spätzle 3 promotes glial morphogenesis and supports neuronal survival and function

Affiliations

The secreted neurotrophin Spätzle 3 promotes glial morphogenesis and supports neuronal survival and function

Jaeda C Coutinho-Budd et al. Genes Dev. .

Abstract

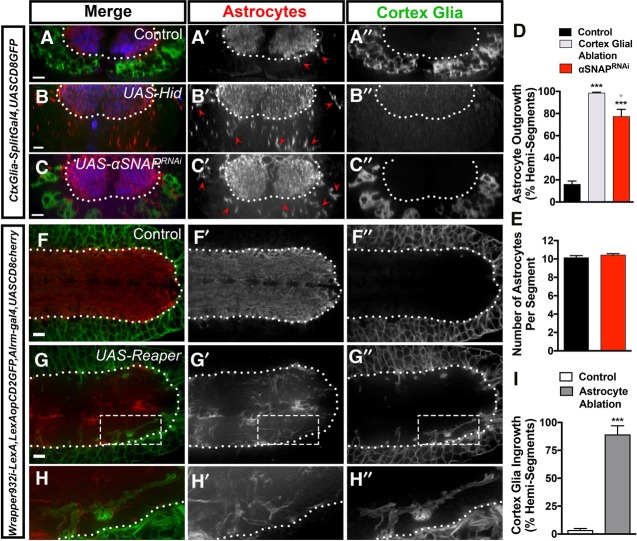
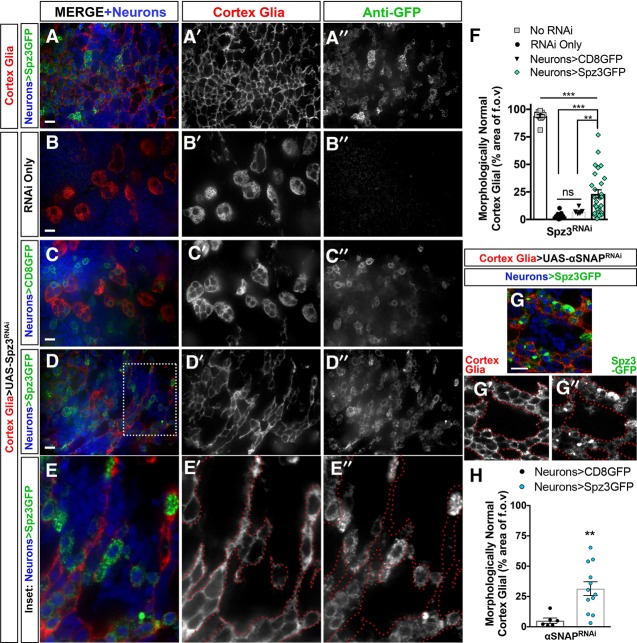
Most glial functions depend on establishing intimate morphological relationships with neurons. Significant progress has been made in understanding neuron-glia signaling at synaptic and axonal contacts, but how glia support neuronal cell bodies is unclear. Here we explored the growth and functions of Drosophila cortex glia (which associate almost exclusively with neuronal cell bodies) to understand glia-soma interactions. We show that cortex glia tile with one another and with astrocytes to establish unique central nervous system (CNS) spatial domains that actively restrict glial growth, and selective ablation of cortex glia causes animal lethality. In an RNAi-based screen, we identified αSNAP (soluble NSF [N-ethylmalemeide-sensitive factor] attachment protein α) and several components of vesicle fusion and recycling machinery as essential for the maintenance of cortex glial morphology and continued contact with neurons. Interestingly, loss of the secreted neurotrophin Spätzle 3 (Spz3) phenocopied αSNAP phenotypes, which included loss of glial ensheathment of neuron cell bodies, increased neuronal cell death, and defects in animal behavior. Rescue experiments suggest that Spz3 can exert these effects only over very short distances. This work identifies essential roles for glial ensheathment of neuronal cell bodies in CNS homeostasis as well as Spz3 as a novel signaling factor required for maintenance of cortex glial morphology and neuron-glia contact.

Keywords: Drosophila; cortex glia; glia; neurotrophin; spz3; αSNAP.


Figures

Figure 1.
Figure 1.
CtxGlia-SplitGal4 allows for cortex glial-specific labeling and investigation of glia–neuron contacts throughout development. (AC) Cortex glia infiltrate the cortex during embryonic development. Cortex glia are established around embryonic stage 12 (A), extend processes to wrap neurons either in groups or individually as embryogenesis proceeds (B), and fully infiltrate the CNS around the first instar larval stage (C). Cortex glia are labeled with UAS-CD8GFP (green; anti-GFP), and neuronal nuclei are stained with anti-Elav (red). (D) CtxGlia-SplitGal4 labels cortex glia in the central brain and VNC, shown here at the third instar larval stage (L3). Bar, 50 µm. (E) Stochastic flp-out expression of GFP and RFP reveals that cortex glia form tiled domains with themselves (GMR54H02-gal4,UAS-CD8>GFP>RFP). Bar, 10 µm. (F) In the presence of flipase activity, Wrapper932i>LexA>Gal4 stochastically switches from the LexA driver to Gal4. Flp-out clones of cortex glia expressing the cell death gene reaper (UAS-rpr), marked by UAS-CD8Cherry (red), degenerate from Reaper activity. Neighboring control cortex glia that express only LexAop2-CD8GFP (green)—without UAS-rpr expression—grow to fill in empty space, leaving no unwrapped neurons. Bar, 10 µm. (GH′) Cortex glial nuclei (labeled with CtxGlia-SplitGal4,UAS-LacZNLS and stained with anti-βgal [red]) increase significantly from the second instar larval stage (L2) (G,–G′) to L3 larval stage (H,–H′), specifically in the thoracic (T1–T3) and first two abdominal (of A1–A7) segments. Bars, 20 µm. (I) Adult VNC showing that the cortex glial specificity of CtxGlia-SplitGal4 remains into adult stages. (J) Quantification of the numbers of Elav+ nuclei contained in each cortex glial cell from abdominal segments A3–A6 in L3 brains. n = 27 cells from 21 clones in 15 brains. (K) Quantification of cortex glial nuclei in L2 and L3 brains. n = 7 brains per time point. (***) P < 0.0001, two-way ANOVA with Sidak's multiple comparison test. (L) Quantification of cortex glial nuclei in each segment of the adult VNC. n = 5 brains.
Figure 2.
Figure 2.
Membrane fusion machinery is necessary for the maintenance of cortex glial morphology. (A) Control brain with CtxGlia-SplitGal4 driving UAS-CD8GFP (anti-GFP, green) stained for neuronal (anti-Elav, red) and glial (anti-repo, blue) nuclei to show normal cortex glia throughout the central brain and VNC. (B) High-magnification image of control cortex glia morphology in the VNC. (C) Cortex glia expressing RNAi against αSNAP result in globular morphology, leaving many neurons unwrapped by cortex glia. (D) High-magnification image of globular cortex glia induced by αSNAP knockdown. (E,F) Cortex glial RNAi knockdown of αSNAP-binding partners NSF2 (E) and Syx5 (F) mimics the αSNAP knockdown phenotype. Bars: A,C, 50 µm; B,DF, 10 µm. (G,H) EM of cortex glia pseudocolored in green with neuronal cell bodies outside the glial cell (*). (G) Control cortex glia between neuronal cell bodies with processes as thin as 50 nm (inset area; indicated by crimson arrow). (H) Globular cortex glial cell induced by cortex glia-specific αSNAPRNAi lacks processes between neurons. Bar: G,H, 1 µm. (I,J) Without αSNAP, cortex glial nuclei do not increase from L2 (I,I′) to L3 (J,J′). Bars, 20 µm. (K) Quantification of cortex glial nuclei. (n.s.) Not significant. (L) Fold increase from L2 to L3 is compared with controls. n = 7 brains each. (***) P = 0.0002, two-way ANOVA with Sidak's multiple comparison test.
Figure 3.
Figure 3.
Disruption of Rab1, Rab5, Rab11, and Rab35 impairs cortex glial morphology. (AD) Using the Rab-YFP collection that expresses YFP-tagged Rab proteins under the control of their endogenous promoter (Dunst et al. 2015), we determined that only RabX1 seems to be enriched in cortex glia (CtxGlia-SplitGal4,UAS-CD8mCherry, red) compared with surrounding cells (shown in A). (B) Most Drosophila Rab proteins are present to some extent in cortex glia but also seem to be fairly ubiquitous. For example, Rab35 can be seen in both cortex glia and the neurons they surround. (C) A few, such as the example of Rab26, were not found to be expressed in cortex glia. (D) Table of the Rab-YFP proteins listed by their expression relative to cortex glia. (EL) Interruption of Rab signaling with RNAi or dominant-negative (DN) constructs only recapitulated the globular cortex glial phenotype, with both dominant-negative and RNAi constructs targeting Rab1 (E,F), Rab11 (G,H), Rab35 (I,J), and, to a lesser extent, Rab5 (K,L). Like αSNAP, these defects arise between the L2 (E,G,I,K) and L3 (F,H,J,L) stages. Bars, 10 µm. The bar for AC is shown in C, and the bar for EL is shown in E.
Figure 4.
Figure 4.
Dysfunctional glia lead to aberrant growth of neighboring glial subtypes. (A) Cross-section of control L3 VNC with neuropil-restricted astrocytes (anti-GAT, red; A′) and cortex-restricted cortex glia (CtxGlia-SplitGal4,UAS-CD8GFP stained with anti-GFP, green; A″) costained for synapses (anti-Brp, blue). (A′) Arrowheads show small stray astrocytic processes. (B,C) Cortex glial ablation with UAS-hid (B) or morphological disruption via UAS-αSNAPRNAi (C) causes widespread invasion of astrocytes to the cortex (B′), whereas synapses remain in the neuropil (B), and cortex glia remain in the cortex in αSNAP (B″). (D) Quantification of the percentage of hemisegments with astrocytes crossing the neuropil–cortex boundary increases from 16.18% of segments in controls (n = 17) to 98.72% in UAS-hid (n = 13) and 77.43% in cortex glia-specific αSNAPRNAi animals (n = 12). (*) P = 0.0227; (***) P < 0.0001, one-way ANOVA with Tukey's multiple comparisons test (with Spz3RNAi shown in Fig. 6E, below). (E) Quantification of Prospero+ astrocytes shows no difference in astrocyte numbers during the outgrowth events. n = 7 control animals; n = 13 SNAPRNAi animals. (F) Longitudinal section of control L3 VNC with neuropil-restricted astrocytes (anti-GAT, red; F′) and cortex-restricted cortex glia (Wrapper932i-LexA,LexAop-CD2GFP stained with anti-GFP, green; F″). (G) Astrocyte ablation with Alrm-Gal4 driving UAS-reaper (anti-RFP, red; G′) results in cortex glial (anti-GFP, green; G″) infiltration into the neuropil. (H–H″) Close-up of inset in GG″. (I) Quantification of the percentage of hemisegments with aberrant cortex glia in the neuropil increases from 3.648% in controls to 89.26% in astrocyte ablated animals. n = 9 wild-type ablations; n = 14 astrocyte ablations. (***) P < 0.0001, unpaired t-test. Bars, 10 µm. The dashed line depicts the cortex/neuropil boundary in all images.
Figure 5.
Figure 5.
Disruption of cortex glial morphology results in increased neuronal cell death and behavioral impairment. (AB″) Calcium imaging in cortex glia at L2 in control (AA″) and cortex glia-specific αSNAP knockdown (BB″) using UAS-GCaMP5a driven by GMR54H02-Gal4. Bars, 10 µm. Images shown are at 5-sec intervals. White arrowheads show calcium transients in cortex glial processes. (C) Quantification of calcium transients per 400-µm2 area: control mean = 14.43 transients; αSNAPRNAi = 5.107 transients; n = 28 regions of interest; n = 4 brains each. (***) P < 0.0001, unpaired t-test. (D) Example traces of larval crawling from control (black) or cortex glial αSNAPRNAi (red) in L3 larva (CtxGlia-SplitGal4,UAS-CD8GFP crossed to wild type or UAS-αSNAPRNAi). (E) Quantification of larval crawling speed (centimeters per minute) shows a slight drop from 6.934 cm/min in control animals (n = 34) to 5.138 cm/min in αSNAPRNAi animals (n = 29). (***) P < 0.0001, unpaired t-test. (F) Quantification of linear distance traveled from the start to the end of the crawling path is reduced from 4.382 cm in control animals (n = 34) to 2.135 cm in αSNAPRNAi cortex glia animals (n = 29). (***) P < 0.0001, unpaired t-test. (G) DCP1+ (death caspase protein-1-positive) puncta increased from 198.2 in control VNCs to 269.9 in αSNAPRNAi animals. n = 12 brains per genotype. (***) P = 0.001, one-way ANOVA with Tukey's multiple comparison test (with Spz3RNAi shown in Fig. 6E). (H,I) Cell death (anti-DCP-1, red) in control L3 VNC (H) or in the presence of globular cortex glia induced by UAS-αSNAPRNAi (I). Cortex glia were visualized with CtxGlia-SplitGal4 driving UAS-CD8GFP (anti-GFP, green) and stained for neuronal nuclei (anti-Elav, blue).
Figure 6.
Figure 6.
Spz3 cell-autonomously regulates cortex glial morphology. (AD) Knockdown of Spz3 (Spz3RNAi) in cortex glia (visualized with CtxGlia-SplitGal4 driving UAS-CD8GFP) resulted in normal development through L1 (A) and early L2 (B). Progressive morphological disruption occurs between L2 and L3 stages (C,D). Neuronal nuclei are stained in red (anti-Elav). Bar, 20 µm. (E) Spz3RNAi in cortex glia increased aberrant astrocyte outgrowth from 16.18% (n = 17) to 79.17% (n = 9) of hemisegments in the VNC. (***) P < 0.0001, one-way ANOVA with Tukey's multiple comparison test (with hid and αSNAPRNAi shown in Fig. 4D). (F,G) Spz3RNAi affected L3 larval crawling with reduced crawling velocity from 7.136 cm/min (n = 49) to 5.908 cm/min (n = 38; [***] P = 0.0008, unpaired t-test; F) and decreased linear distance traveled from the starting to the ending points of the path from 4.145 cm in controls (n = 49) to 2.146 cm (n = 38; [***] P < 0.0001, unpaired t-test; G). (H) DCP1+ puncta increased from 198.2 in control VNCs to 268.7 in Spz3RNAi animals. n = 12 brains per genotype. (**) P = 0.0012, one-way ANOVA with Tukey's multiple comparison test (with αSNAPRNAi shown in Fig. 5G). (IM″) CtxGlia-SplitGal4,UAS-CD8Cherry crossed to the 40DUAS KK insertion control shows normal cortex glial morphology (red) in thoracic segments at L3 (shown in II″). RNAi targeted to Spz3 results in globular morphology at L3 (JJ″) that is not rescued by the addition of UAS-CD8GFP (KK″) or UAS-Spz3GFP (LL″). (MM″) UAS-driven RNAi-resistant Spz3GFP (UAS-Spz3iResGFP) ameliorates cortex glial morphology. Cortex glia are marked with UAS-CD8Cherry (anti-RFP, red) and stained for rescue constructs (anti-GFP, green) and neuronal nuclei (anti-Elav, blue). Bar, 10 µm. (N) Quantification of the area (from T2–T3 segments) covered by morphologically normal cortex glia reveals 97.8% in control (n = 13 brains), 5.8% in RNAi only (n = 18 brains), 7.2% in cortex glia expressing CD8GFP (n = 15 brains), 15.8% in cortex glia expressing Spz3GFP (n = 12 brains), and 40.76% in cortex glia expressing Spz3iResGFP (n = 32 brains). (***) P < 0.0003; (n.s.) P > 0.49, one-way ANOVA with Tukey's post hoc test.
Figure 7.
Figure 7.
Ectopic neuronal expression of Spz3 can locally regulate cortex glial morphology. (A) CtxGlia-SplitGal4 expressing UAS-CD8Cherry with Nsyb-QF driving expression of QUAS-Spz3GFP in a subset of neurons driven by Nsyb-QF2 results in relatively normal cortex glial morphology (red) at L3. (BE) Spz3RNAi in cortex glia results in globular morphology at L3 (BB″) that is not rescued by QUAS-CD8GFP in neurons (CC″). (DD″) Expression of QUAS-Spz3GFP in neurons can ameliorate cortex glial morphology in areas close to Spz3-expressing neurons. (E) Close-up of the inset in D demonstrating rescue of cortex glia along Spz3GFP-expressing neurons (the red line outlines cortex glial processes). Cortex glia are marked with UAS-CD8Cherry (anti-RFP, red), neurons expressing QF-driven CD8GFP or Spz3GFP for rescue constructs are shown in green (stained with anti-GFP), and all neuronal nuclei are shown in blue (stained with anti-Elav). (F) Quantification of the area (thoracic segments) covered by morphologically normal cortex glia reveals 94.0% in control (n = 12 brains), 2.7% in RNAi only (n = 13 brains), 7.2% in brains with neurons expressing CD8GFP (n = 7 brains), and 23.26% in brains expressing Spz3GFP (n = 28 brains). (**) P = 0.0194; (***) P < 0.0003; (ns) P > 0.40, one-way ANOVA with Tukey's post hoc test. (GG″) Expression of QUAS-Spz3GFP rescues cortex glial morphology caused by αSNAPRNAi near Spz3-expressing neurons. (H) Quantification of neuronal Spz3 rescue of cortex glial coverage in cortex glia driving αSNAPRNAi. n = 6; n = 12, respectively. (**) P = 0.0057, unpaired t-test. Bars, 10 µm.

References

    1. Akagawa H, Hara Y, Togane Y, Iwabuchi K, Hiraoka T, Tsujimura H. 2015. The role of the effector caspases drICE and dcp-1 for cell death and corpse clearance in the developing optic lobe in Drosophila. Dev Biol 404: 61–75. - PubMed
    1. Akiyama-Oda Y, Hosoya T, Hotta Y. 1999. Asymmetric cell division of thoracic neuroblast 6-4 to bifurcate glial and neuronal lineage in Drosophila. Development 126: 1967–1974. - PubMed
    1. Allen NJ, Barres BA. 2009. Glia - more than just brain glue. Nature 457: 675–677. - PubMed
    1. Avet-Rochex A, Kaul AK, Gatt AP, McNeill H, Bateman JM. 2012. Concerted control of gliogenesis by InR/TOR and FGF signalling in the Drosophila post-embryonic brain. Development 139: 2763–2772. - PMC - PubMed
    1. Awasaki T, Lai SL, Ito K, Lee T. 2008. Organization and postembryonic development of glial cells in the adult central brain of Drosophila. J Neurosci 28: 13742–13753. - PMC - PubMed

Publication types

Substances

LinkOut - more resources