

High Zika Virus Seroprevalence in Salvador, Northeastern Brazil Limits the Potential for Further Outbreaks
- PMID: 29138300
- PMCID: PMC5686533
- DOI: 10.1128/mBio.01390-17
High Zika Virus Seroprevalence in Salvador, Northeastern Brazil Limits the Potential for Further Outbreaks
Abstract
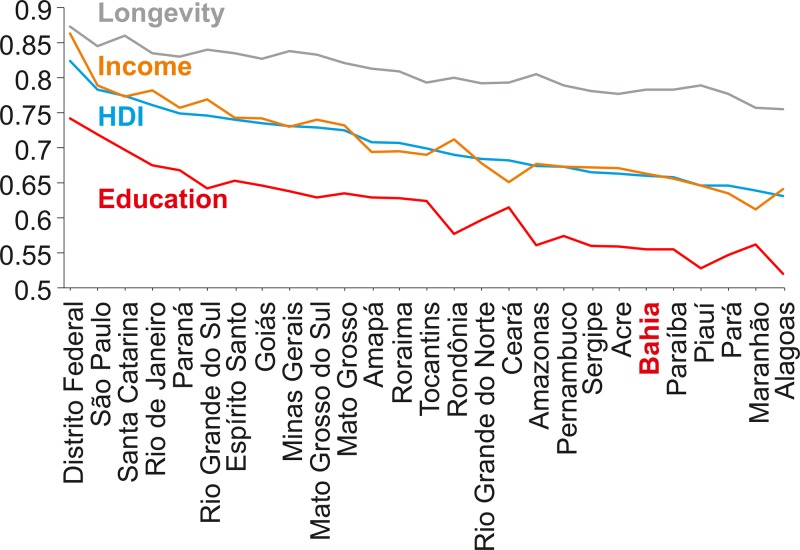
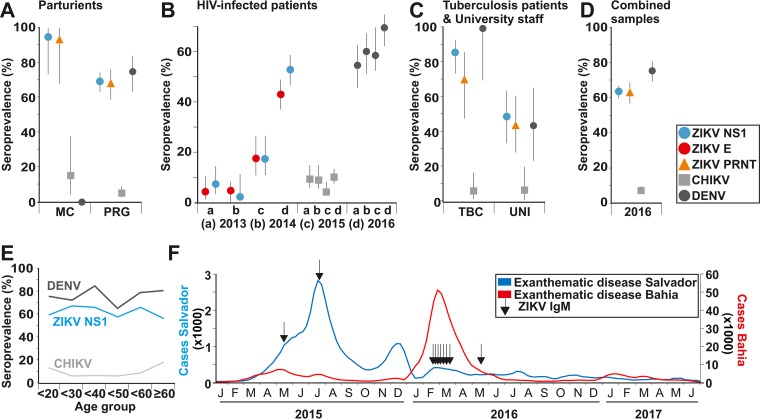
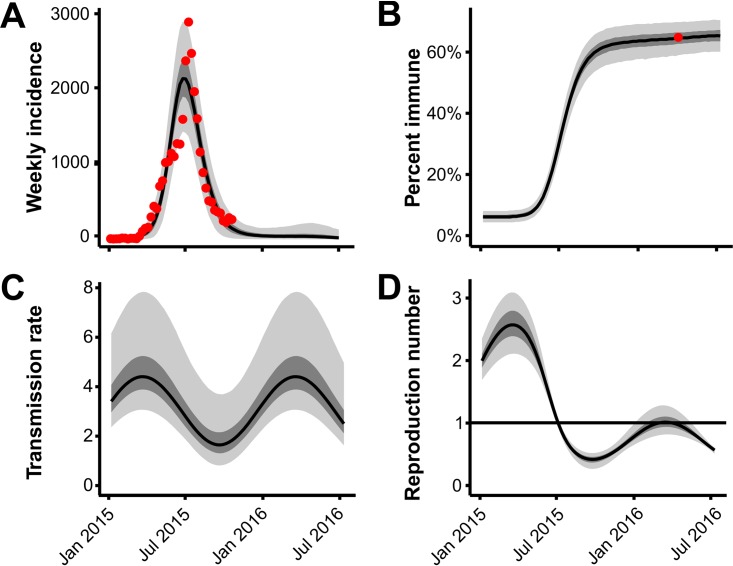
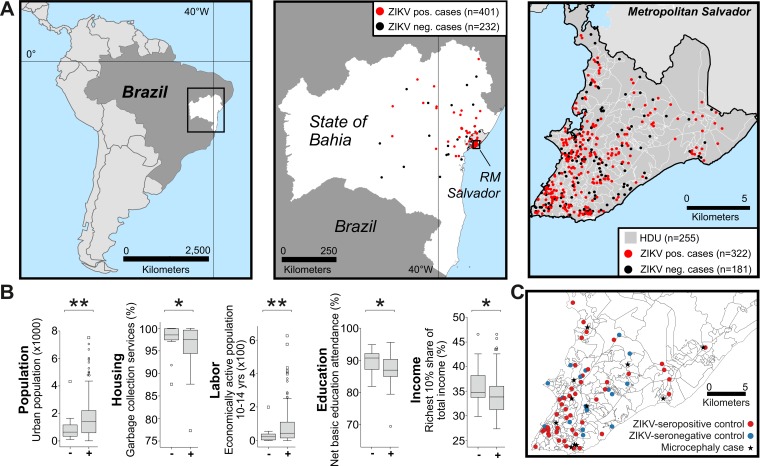
During 2015 to 2016, Brazil reported more Zika virus (ZIKV) cases than any other country, yet population exposure remains unknown. Serological studies of ZIKV are hampered by cross-reactive immune responses against heterologous viruses. We conducted serosurveys for ZIKV, dengue virus (DENV), and Chikungunya virus (CHIKV) in 633 individuals prospectively sampled during 2015 to 2016, including microcephaly and non-microcephaly pregnancies, HIV-infected patients, tuberculosis patients, and university staff in Salvador in northeastern Brazil using enzyme-linked immunosorbent assays (ELISAs) and plaque reduction neutralization tests. Sera sampled retrospectively during 2013 to 2015 from 277 HIV-infected patients were used to assess the spread of ZIKV over time. Individuals were georeferenced, and sociodemographic indicators were compared between ZIKV-positive and -negative areas and areas with and without microcephaly cases. Epidemiological key parameters were modeled in a Bayesian framework. ZIKV seroprevalence increased rapidly during 2015 to 2016, reaching 63.3% by 2016 (95% confidence interval [CI], 59.4 to 66.8%), comparable to the seroprevalence of DENV (75.7%; CI, 69.4 to 81.1%) and higher than that of CHIKV (7.4%; CI, 5.6 to 9.8%). Of 19 microcephaly pregnancies, 94.7% showed ZIKV IgG antibodies, compared to 69.3% of 257 non-microcephaly pregnancies (P = 0.017). Analyses of sociodemographic data revealed a higher ZIKV burden in low socioeconomic status (SES) areas. High seroprevalence, combined with case data dynamics allowed estimates of the basic reproduction number R0 of 2.1 (CI, 1.8 to 2.5) at the onset of the outbreak and an effective reproductive number Reff of <1 in subsequent years. Our data corroborate ZIKV-associated congenital disease and an association of low SES and ZIKV infection and suggest that population immunity caused cessation of the outbreak. Similar studies from other areas will be required to determine the fate of the American ZIKV outbreak.IMPORTANCE The ongoing American Zika virus (ZIKV) outbreak involves millions of cases and has a major impact on maternal and child health. Knowledge of infection rates is crucial to project future epidemic patterns and determine the absolute risk of microcephaly upon maternal ZIKV infection during pregnancy. For unknown reasons, the vast majority of ZIKV-associated microcephaly cases are concentrated in northeastern Brazil. We analyzed different subpopulations from Salvador, a Brazilian metropolis representing one of the most affected areas during the American ZIKV outbreak. We demonstrate rapid spread of ZIKV in Salvador, Brazil, and infection rates exceeding 60%. We provide evidence for the link between ZIKV and microcephaly, report that ZIKV predominantly affects geographic areas with low socioeconomic status, and show that population immunity likely caused cessation of the outbreak. Our results enable stakeholders to identify target populations for vaccination and for trials on vaccine efficacy and allow refocusing of research efforts and intervention strategies.
Keywords: Zika virus; microcephaly; risk factors; serology; socioeconomic status.
Copyright © 2017 Netto et al.
Figures

References
-
- World Health Organization 1 February 2016. WHO statement on the first meeting of the International Health Regulations (2005) (IHR 2005) Emergency Committee on Zika virus and observed increase in neurological disorders and neonatal malformations. World Health Organization, Geneva, Switzerland: http://www.who.int/mediacentre/news/statements/2016/1st-emergency-commit....
-
- Dos Santos T, Rodriguez A, Almiron M, Sanhueza A, Ramon P, de Oliveira WK, Coelho GE, Badaró R, Cortez J, Ospina M, Pimentel R, Masis R, Hernandez F, Lara B, Montoya R, Jubithana B, Melchor A, Alvarez A, Aldighieri S, Dye C, Espinal MA. 2016. Zika virus and the Guillain-Barre syndrome—case series from seven countries. N Engl J Med 375:1598–1601. doi:10.1056/NEJMc1609015. - DOI - PubMed
-
- Messina JP, Kraemer MU, Brady OJ, Pigott DM, Shearer FM, Weiss DJ, Golding N, Ruktanonchai CW, Gething PW, Cohn E, Brownstein JS, Khan K, Tatem AJ, Jaenisch T, Murray CJ, Marinho F, Scott TW, Hay SI. 2016. Mapping global environmental suitability for Zika virus. Elife 5:e15272. doi:10.7554/eLife.15272. - DOI - PMC - PubMed
-
- Duffy MR, Chen TH, Hancock WT, Powers AM, Kool JL, Lanciotti RS, Pretrick M, Marfel M, Holzbauer S, Dubray C, Guillaumot L, Griggs A, Bel M, Lambert AJ, Laven J, Kosoy O, Panella A, Biggerstaff BJ, Fischer M, Hayes EB. 2009. Zika virus outbreak on Yap Island, Federated States of Micronesia. N Engl J Med 360:2536–2543. doi:10.1056/NEJMoa0805715. - DOI - PubMed
-
- Corman VM, Rasche A, Baronti C, Aldabbagh S, Cadar D, Reusken CB, Pas SD, Goorhuis A, Schinkel J, Molenkamp R, Kümmerer BM, Bleicker T, Brünink S, Eschbach-Bludau M, Eis-Hübinger AM, Koopmans MP, Schmidt-Chanasit J, Grobusch MP, de Lamballerie X, Drosten C, Drexler JF. 2016. Assay optimization for molecular detection of Zika virus. Bull World Health Organ 94:880–892. doi:10.2471/BLT.16.175950. - DOI - PMC - PubMed
Publication types
MeSH terms
Substances
Grants and funding
LinkOut - more resources
Full Text Sources
Other Literature Sources
Medical
