. 2017 Nov 28;114(48):E10465-E10474.
doi: 10.1073/pnas.1705414114. Epub 2017 Nov 14.

Sparsity enables estimation of both subcortical and cortical activity from MEG and EEG

Affiliations

Sparsity enables estimation of both subcortical and cortical activity from MEG and EEG

Pavitra Krishnaswamy et al. Proc Natl Acad Sci U S A. .

Abstract

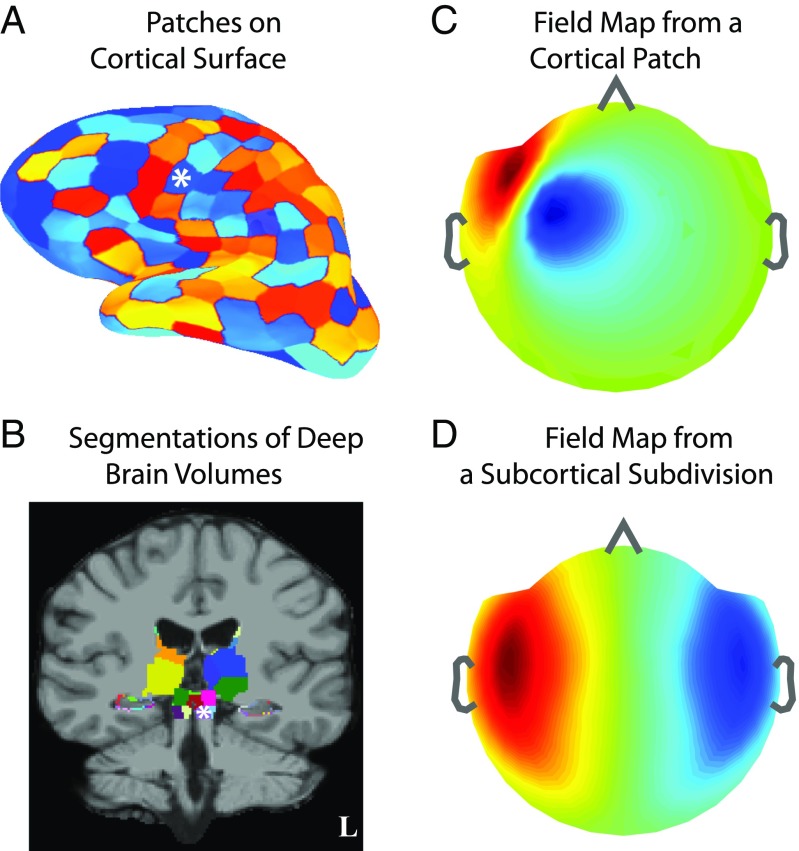
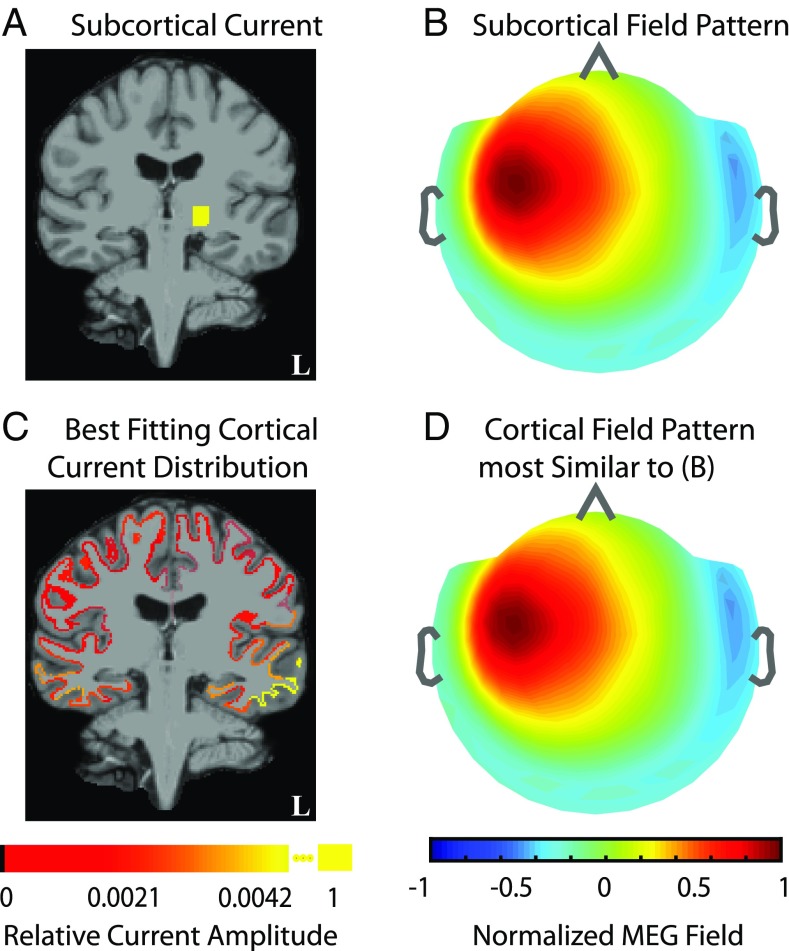
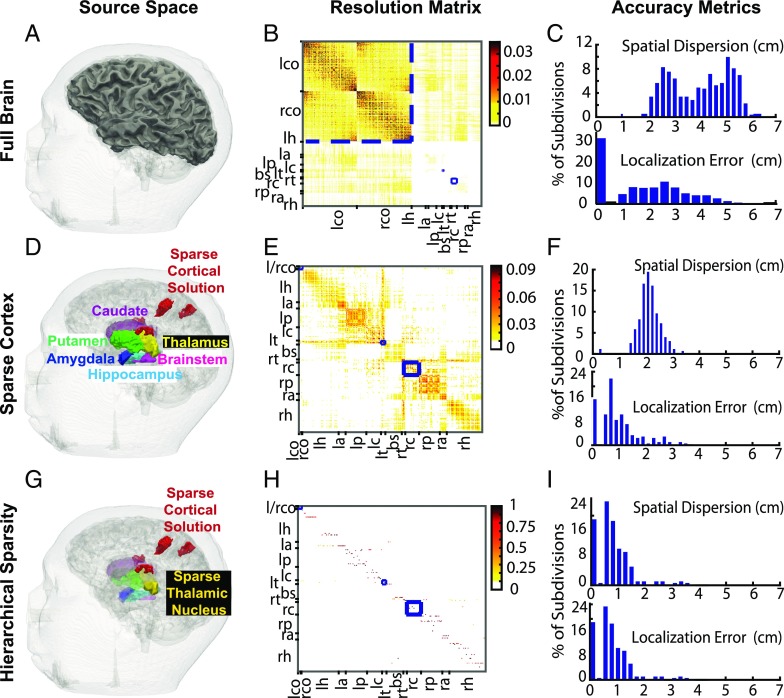
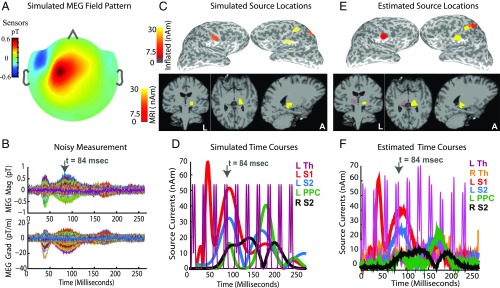
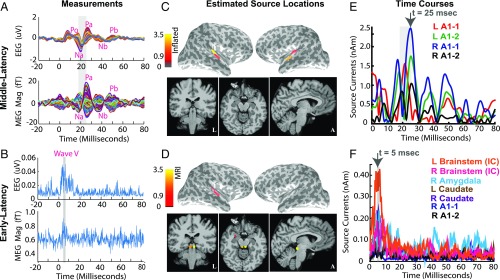
Subcortical structures play a critical role in brain function. However, options for assessing electrophysiological activity in these structures are limited. Electromagnetic fields generated by neuronal activity in subcortical structures can be recorded noninvasively, using magnetoencephalography (MEG) and electroencephalography (EEG). However, these subcortical signals are much weaker than those generated by cortical activity. In addition, we show here that it is difficult to resolve subcortical sources because distributed cortical activity can explain the MEG and EEG patterns generated by deep sources. We then demonstrate that if the cortical activity is spatially sparse, both cortical and subcortical sources can be resolved with M/EEG. Building on this insight, we develop a hierarchical sparse inverse solution for M/EEG. We assess the performance of this algorithm on realistic simulations and auditory evoked response data, and show that thalamic and brainstem sources can be correctly estimated in the presence of cortical activity. Our work provides alternative perspectives and tools for characterizing electrophysiological activity in subcortical structures in the human brain.

Keywords: EEG; MEG; source localization; sparsity; subcortical structures.


Conflict of interest statement

The authors declare no conflict of interest.

Figures

Fig. 1.
Fig. 1.
Illustration of source spaces and field patterns. (A) Cortical source space C comprising patches (sized 650mm2) on the gray–white matter surface interface. (B) Subcortical source space S comprising volume subdivisions (sized 1751,800mm3) in the caudate, putamen, amygdala, thalamus, brainstem, and surface patches (sized 47mm2) on hippocampus. (A and B) The set of cortical and subcortical divisions B=CS forms the full distributed source space. (C and D) Example of noiseless MEG field pattern arising from activity in a frontotemporal cortical patch and a brainstem subdivision, respectively (white asterisks in A and B). Inflated surfaces and field maps have a left–right convention opposite to the MRI views. (C vs. D) Cortical fields tend to have more focal spatial patterns, while subcortical fields tend to be more distributed.
Fig. 2.
Fig. 2.
Fields generated by subcortical sources can be explained by currents on the cortex. (A and B) Example of unit source current in left ventroposterolateral (VPL) thalamus (sized 1.5cm3) and the corresponding noiseless MEG field pattern. (C and D) Distribution of currents on cortical surface patches (sized 650mm2) that reproduce the MEG field pattern generated by the subcortical source. C and D show the fitted cortical currents and MEG field pattern. The source current plots in A vs. C are the resultant currents from dipoles within a subdivision. The field maps in B and D are normalized. The fitted cortical field pattern is indistinguishable from the simulated subcortical pattern. This analysis illustrates how a subcortically generated field can be explained by some distribution of cortical currents.
Fig. 3.
Fig. 3.
Sparsity makes it possible to distinguish fields from subcortical and cortical sources. (A) Sources of activity derived from stimulation of the right median nerve: left VPL thalamus, primary and secondary somatosensory areas (S1, bilateral S2), and posterior parietal cortex (PPC). (B) Normalized histogram of principal angles, which quantify the correlation between fields arising from all representative combinations of activity within this neurophysiological source space. The orange histogram shows the distribution of subcortical vs. cortical angles, while the green histogram shows the distribution of cortico-cortical angles. (C) MEG field pattern resulting from activity in VPL thalamus. (D) Representative fields from example cortical source sets, whose gain matrices have the indicated principal angles with the subcortical gain matrix, that best fit the subcortical field pattern in C. All field map color scales are normalized to emphasize the spatial patterns. The spatial profiles of the cortical and subcortical MEG field patterns are distinct, even for a principal angle of 30, and substantially so for principal angles >45°. These distinctions suggest the feasibility of resolving simultaneous subcortical and cortical activity.
Fig. 4.
Fig. 4.
An analysis of how sparsity and hierarchy influence subcortical source estimation. (A) Illustration of all brain divisions considered. (B) Minimum-norm estimator (MNE) resolution matrix for the source space in A. (C) Summary dispersion and error metrics for the resolution matrix in B. Cortical estimates concentrate around the diagonal (low localization error), whereas subcortical estimates spread significantly to the cortex (high spatial dispersion). (D) A reduced space composed of sparse cortical regions that generate somatosensory evoked potentials combined with all subcortical volumes. (E and F) MNE resolution matrix and associated performance metrics for the reduced source space in D. The sparse subset of the cortical source space allows subcortical activity to be estimated, albeit with significant spread to nondiagonal regions. (G) Final sparse cortical and subcortical source regions identified using an inverse solution employing sparsity constraints. The faded subcortical regions show the hierarchically reduced subcortical source space, while the foreground subcortical regions show estimated sources in the thalamus. (H and I) Empirical resolution matrix (one active source per column) and associated performance metrics for the sparse solution. Estimates mostly concentrate on and around the diagonal for both cortical and subcortical sources. B, E, and H show left/right (l/r) cortex (l/rco), hippocampus (r/lh), amygdala (r/la), putamen (r/lp), caudate (r/lc), thalamus (r/lt), and brainstem (bs). All resolution matrices order sources based on physical proximity. Therefore, when sources are estimated accurately, the resolution matrix has a diagonal appearance. The blue boxes are used to delineate the position of the cortical, left thalamic, and right caudate sources in the resolution matrices. The changes in the color-scale range highlight the 3−10× increase in recovered source amplitude when sparse estimation is applied across progressively refined hierarchies. Overall, hierarchical sparsity enables focal spatial resolution with minimal dispersion (or point spread) for inverse solutions incorporating both cortical and subcortical sources.
Fig. 5.
Fig. 5.
Sparse hierarchical estimates recover simulated somatosensory responses. (A and B) Spatial distribution and time courses (one color per channel) of simulated MEG fields in sensor space. (C and D) Spatial distribution and time courses of simulated source currents in source space. Inflated views show sources located in somatosensory (S1, S2) and parietal (PPC) cortices. MRI views show thalamic source locations. The sagittal section passes through the left thalamus. The somatosensory thalamus (Th) is activated in a periodic on/off pattern. (D vs. B) While the cortical source currents contribute large-amplitude MEG signals, fields due to thalamic sources are not visible above the simulated noise. (E and F) Spatial distribution and time courses of estimated source currents in the source space. All topographical snapshots are at 84ms (top gray arrows in time-course plots), the color scales and slice locations are the same in C–E, and all source currents are plotted in terms of the resultant magnitudes across dipoles within each region in the key. (E and F vs. C and D) Estimated source locations and time courses closely match the simulated ground truth. The thalamic source estimate follows the true phasic on/off pattern. Although there is a stray source estimate in right thalamus, it is weak and relatively constant over time. In SI Appendix, Figs. S6 and S7 compare the performance of our algorithm to alternatives that do not use sparsity and hierarchy.
Fig. 6.
Fig. 6.
Cortical and subcortical source estimates for evoked auditory responses. Stimulus-locked average auditory evoked responses were recorded from a healthy volunteer presented with a broadband click train stimulus. Time courses are averages across 11,170 epochs filtered between 500 Hz and 1,625 Hz for the auditory brainstem response (ABR), and between 30 Hz and 300 Hz for the middle latency response (MLR). (A) MLR time courses displayed across channels, one color per channel. Red labels denote common peaks occurring at the expected poststimulus latencies. The Na and Pa peaks (shaded gray section) are particularly prominent. (B) ABR time courses rectified and averaged across channels. The shaded gray section marks the 5.0- to 6.5-ms period poststimulus, when peaks consistent with ABR wave V appear in the recordings. (C and E) Sparse cortical estimates for middle-latency recordings (30300Hz): snapshots at 25ms (top black arrow, E). The activity is localized to the Heschl’s gyrus and superior temporal gyrus, consistent with auditory cortical processing. The source time courses from these areas have peaks consistent with the Na and Pa peaks in the scalp recordings in A. (D and F) Sparse hierarchical estimates for early-latency recordings (5001,625Hz), obtained using a source space comprised of sparse subsets of cortex in C and the distributed subcortical space. The spatial plots display the source activity at 5ms (top black arrow, F). The activity is localized primarily to the inferior colliculus. A weak stray source is also seen in right amygdala. The brainstem source time courses show peaks consistent with the ABR wave V peaks in B. The color scales and slice locations are maintained for topographical snapshots across C and D, and all source currents are resultant magnitudes across dipoles within each region in the key. The color scales in C and D have units nAm and 0.1nAm, respectively. Overall, our sparse hierarchical algorithm recovers cortical and subcortical sources consistent with the auditory stimuli presented. SI Appendix, Fig. S10 compares the performance of our algorithm to alternatives that do not use sparsity and hierarchy.

Similar articles

Cited by

References

    1. Jones EG. The thalamic matrix and thalamocortical synchrony. Trends Neurosci. 2001;24:595–601. - PubMed
    1. Jones EG. Thalamic circuitry and thalamocortical synchrony. Philos Trans R Soc Lond B Biol Sci. 2002;357:1659–1673. - PMC - PubMed
    1. Steriade M, McCormick DA, Sejnowski TJ. Thalamocortical oscillations in the sleeping and aroused brain. Science. 1993;262:679–685. - PubMed
    1. Buzsaki G. Theta oscillations in the hippocampus. Neuron. 2016;33:325–340. - PubMed
    1. Ching S, Cimenser A, Purdon PL, Brown EN, Kopell NJ. Thalamocortical model for a propofol-induced alpha-rhythm associated with loss of consciousness. Proc Natl Acad Sci USA. 2010;107:22665–22670. - PMC - PubMed

Publication types

LinkOut - more resources