

Correlating cell shape and cellular stress in motile confluent tissues
- PMID: 29138312
- PMCID: PMC5715741
- DOI: 10.1073/pnas.1705921114
Correlating cell shape and cellular stress in motile confluent tissues
Abstract
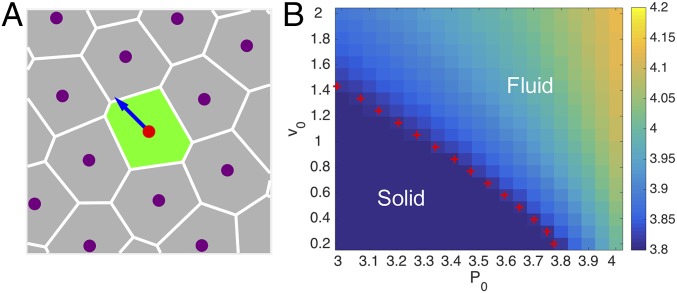
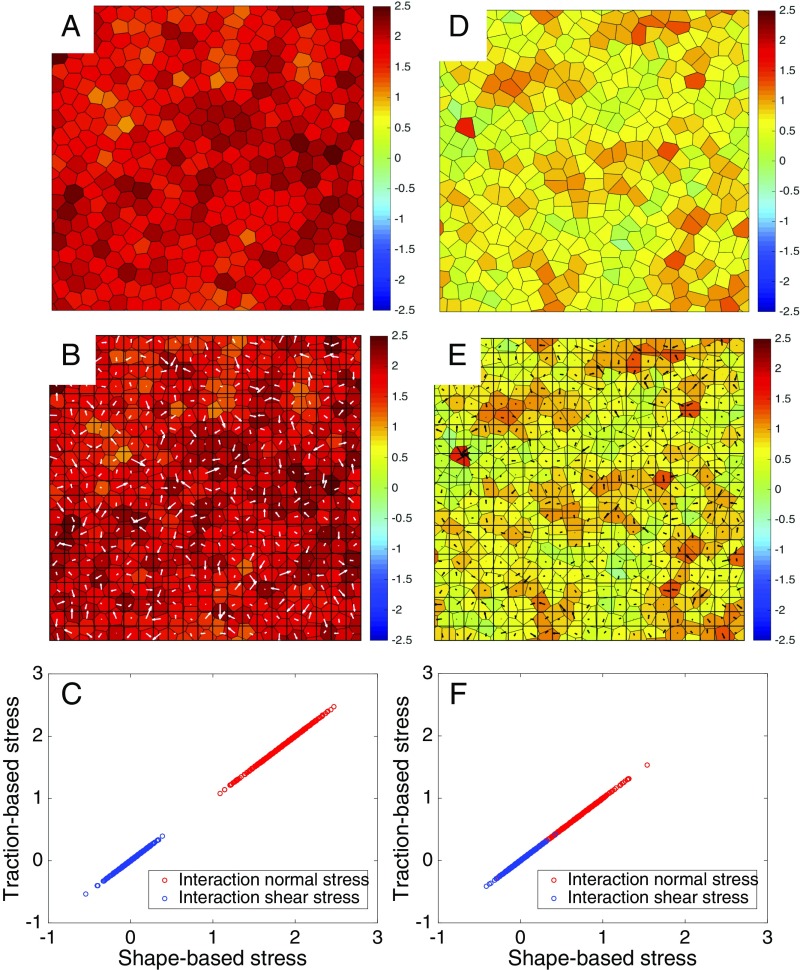
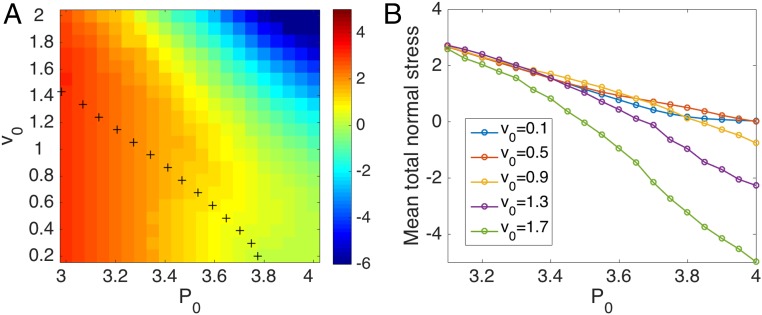
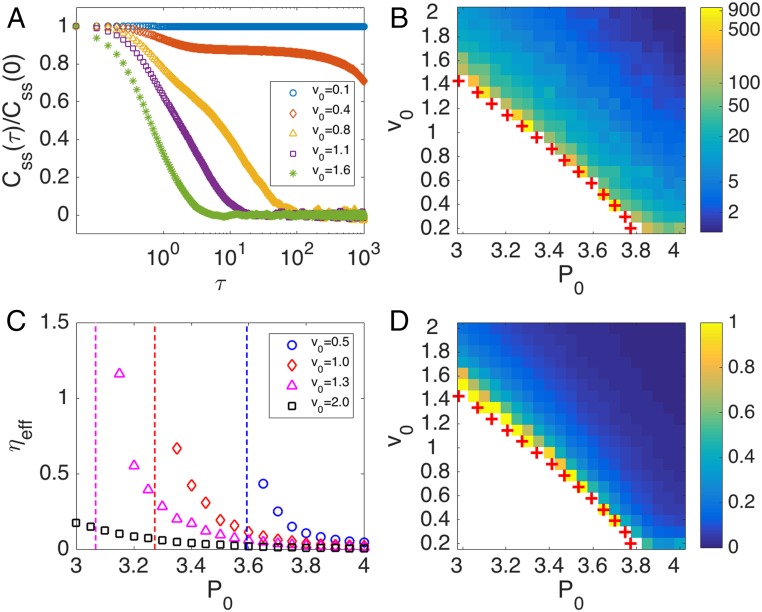
Collective cell migration is a highly regulated process involved in wound healing, cancer metastasis, and morphogenesis. Mechanical interactions among cells provide an important regulatory mechanism to coordinate such collective motion. Using a self-propelled Voronoi (SPV) model that links cell mechanics to cell shape and cell motility, we formulate a generalized mechanical inference method to obtain the spatiotemporal distribution of cellular stresses from measured traction forces in motile tissues and show that such traction-based stresses match those calculated from instantaneous cell shapes. We additionally use stress information to characterize the rheological properties of the tissue. We identify a motility-induced swim stress that adds to the interaction stress to determine the global contractility or extensibility of epithelia. We further show that the temporal correlation of the interaction shear stress determines an effective viscosity of the tissue that diverges at the liquid-solid transition, suggesting the possibility of extracting rheological information directly from traction data.
Keywords: cell shape; cell stress; phase transition; self-propelled; vertex model.
Conflict of interest statement
The authors declare no conflict of interest.
Figures
Similar articles
-
Vertex model with internal dissipation enables sustained flows.Nat Commun. 2025 Jan 9;16(1):530. doi: 10.1038/s41467-025-55820-2. Nat Commun. 2025. PMID: 39789022 Free PMC article.
-
Active Vertex Model for cell-resolution description of epithelial tissue mechanics.PLoS Comput Biol. 2017 Jun 30;13(6):e1005569. doi: 10.1371/journal.pcbi.1005569. eCollection 2017 Jun. PLoS Comput Biol. 2017. PMID: 28665934 Free PMC article.
-
Using cell deformation and motion to predict forces and collective behavior in morphogenesis.Semin Cell Dev Biol. 2017 Jul;67:161-169. doi: 10.1016/j.semcdb.2016.07.029. Epub 2016 Aug 2. Semin Cell Dev Biol. 2017. PMID: 27496334 Free PMC article. Review.
-
Bridging the gap between single-cell migration and collective dynamics.Elife. 2019 Dec 6;8:e46842. doi: 10.7554/eLife.46842. Elife. 2019. PMID: 31808744 Free PMC article.
-
Adaptive viscoelasticity of epithelial cell junctions: from models to methods.Curr Opin Genet Dev. 2020 Aug;63:86-94. doi: 10.1016/j.gde.2020.05.018. Epub 2020 Jun 27. Curr Opin Genet Dev. 2020. PMID: 32604032 Free PMC article. Review.
Cited by
-
Distinct contributions of tensile and shear stress on E-cadherin levels during morphogenesis.Nat Commun. 2018 Nov 27;9(1):5021. doi: 10.1038/s41467-018-07448-8. Nat Commun. 2018. PMID: 30479400 Free PMC article.
-
Spatial confinement affects the heterogeneity and interactions between shoaling fish.Sci Rep. 2024 May 29;14(1):12296. doi: 10.1038/s41598-024-63245-y. Sci Rep. 2024. PMID: 38811673 Free PMC article.
-
Regulation of epithelial cell jamming transition by cytoskeleton and cell-cell interactions.Biophys Rev (Melville). 2024 Oct 14;5(4):041301. doi: 10.1063/5.0220088. eCollection 2024 Dec. Biophys Rev (Melville). 2024. PMID: 39416285 Review.
-
Unjamming Transition as a Paradigm for Biomechanical Control of Cancer Metastasis.Cytoskeleton (Hoboken). 2025 Jun;82(6):388-403. doi: 10.1002/cm.21963. Epub 2024 Dec 5. Cytoskeleton (Hoboken). 2025. PMID: 39633605 Free PMC article. Review.
-
Mechanical imbalance between normal and transformed cells drives epithelial homeostasis through cell competition.bioRxiv [Preprint]. 2024 Jun 22:2023.09.27.559723. doi: 10.1101/2023.09.27.559723. bioRxiv. 2024. PMID: 37961252 Free PMC article. Preprint.
References
Publication types
MeSH terms
Grants and funding
LinkOut - more resources
Full Text Sources
Other Literature Sources
