

Imaging and quantifying ganglion cells and other transparent neurons in the living human retina
- PMID: 29138314
- PMCID: PMC5715765
- DOI: 10.1073/pnas.1711734114
Imaging and quantifying ganglion cells and other transparent neurons in the living human retina
Abstract
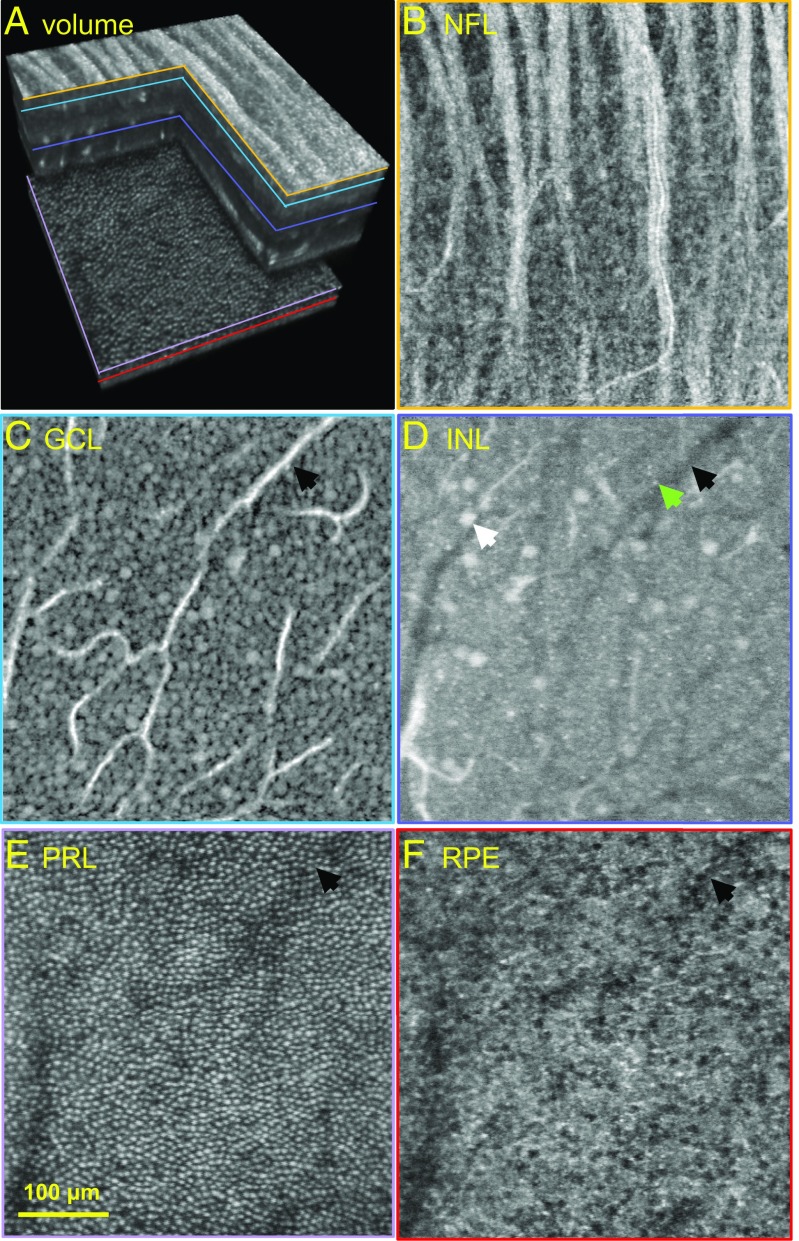
Ganglion cells (GCs) are fundamental to retinal neural circuitry, processing photoreceptor signals for transmission to the brain via their axons. However, much remains unknown about their role in vision and their vulnerability to disease leading to blindness. A major bottleneck has been our inability to observe GCs and their degeneration in the living human eye. Despite two decades of development of optical technologies to image cells in the living human retina, GCs remain elusive due to their high optical translucency. Failure of conventional imaging-using predominately singly scattered light-to reveal GCs has led to a focus on multiply-scattered, fluorescence, two-photon, and phase imaging techniques to enhance GC contrast. Here, we show that singly scattered light actually carries substantial information that reveals GC somas, axons, and other retinal neurons and permits their quantitative analysis. We perform morphometry on GC layer somas, including projection of GCs onto photoreceptors and identification of the primary GC subtypes, even beneath nerve fibers. We obtained singly scattered images by: (i) marrying adaptive optics to optical coherence tomography to avoid optical blurring of the eye; (ii) performing 3D subcellular image registration to avoid motion blur; and (iii) using organelle motility inside somas as an intrinsic contrast agent. Moreover, through-focus imaging offers the potential to spatially map individual GCs to underlying amacrine, bipolar, horizontal, photoreceptor, and retinal pigment epithelium cells, thus exposing the anatomical substrate for neural processing of visual information. This imaging modality is also a tool for improving clinical diagnosis and assessing treatment of retinal disease.
Keywords: adaptive optics; optical coherence tomography; organelle motility; retina; retinal ganglion cells.
Copyright © 2017 the Author(s). Published by PNAS.
Conflict of interest statement
The authors declare no conflict of interest.
Figures
Similar articles
-
Synaptic connections of calbindin-immunoreactive cone bipolar cells in the inner plexiform layer of rabbit retina.Cell Tissue Res. 2010 Feb;339(2):311-20. doi: 10.1007/s00441-009-0895-6. Epub 2009 Nov 25. Cell Tissue Res. 2010. PMID: 19937346
-
Cone photoreceptor classification in the living human eye from photostimulation-induced phase dynamics.Proc Natl Acad Sci U S A. 2019 Apr 16;116(16):7951-7956. doi: 10.1073/pnas.1816360116. Epub 2019 Apr 3. Proc Natl Acad Sci U S A. 2019. PMID: 30944223 Free PMC article.
-
Cellular origin of intrinsic optical signals in the rabbit retina.Vision Res. 2017 Aug;137:40-49. doi: 10.1016/j.visres.2017.04.015. Epub 2017 Jul 14. Vision Res. 2017. PMID: 28687326
-
[Viral and Electrophysiological Approaches for Elucidating the Structure and Function of Retinal Circuits].Yakugaku Zasshi. 2018;138(5):669-678. doi: 10.1248/yakushi.17-00200-1. Yakugaku Zasshi. 2018. PMID: 29710012 Review. Japanese.
-
Processing of S-cone signals in the inner plexiform layer of the mammalian retina.Vis Neurosci. 2014 Mar;31(2):153-63. doi: 10.1017/S0952523813000308. Epub 2013 Sep 9. Vis Neurosci. 2014. PMID: 24016424 Free PMC article. Review.
Cited by
-
A theory of cortical map formation in the visual brain.Nat Commun. 2022 Apr 28;13(1):2303. doi: 10.1038/s41467-022-29433-y. Nat Commun. 2022. PMID: 35484133 Free PMC article.
-
Asymmetries around the visual field: From retina to cortex to behavior.PLoS Comput Biol. 2022 Jan 10;18(1):e1009771. doi: 10.1371/journal.pcbi.1009771. eCollection 2022 Jan. PLoS Comput Biol. 2022. PMID: 35007281 Free PMC article.
-
Temporal Control of Axonal Transport: The Extreme Case of Organismal Ageing.Front Cell Neurosci. 2019 Aug 23;13:393. doi: 10.3389/fncel.2019.00393. eCollection 2019. Front Cell Neurosci. 2019. PMID: 31555095 Free PMC article. Review.
-
An Autotaxin-Induced Ocular Hypertension Mouse Model Reflecting Physiological Aqueous Biomarker.Invest Ophthalmol Vis Sci. 2024 Feb 1;65(2):32. doi: 10.1167/iovs.65.2.32. Invest Ophthalmol Vis Sci. 2024. PMID: 38386333 Free PMC article.
-
Non-invasive in vivo imaging of brain and retinal microglia in neurodegenerative diseases.Front Cell Neurosci. 2024 Jan 29;18:1355557. doi: 10.3389/fncel.2024.1355557. eCollection 2024. Front Cell Neurosci. 2024. PMID: 38348116 Free PMC article. Review.
References
-
- Rodieck RW. The First Steps in Seeing. Sinauer Associates; Sunderland, MA: 1998.
-
- Rodieck RW, Binmoeller KF, Dineen J. Parasol and midget ganglion cells of the human retina. J Comp Neurol. 1985;233:115–132. - PubMed
Publication types
MeSH terms
Grants and funding
LinkOut - more resources
Full Text Sources
Other Literature Sources
Miscellaneous
