. 2017 Nov 28;114(48):E10389-E10398.
doi: 10.1073/pnas.1711408114. Epub 2017 Nov 14.

Dual function for Tango1 in secretion of bulky cargo and in ER-Golgi morphology

Affiliations

Dual function for Tango1 in secretion of bulky cargo and in ER-Golgi morphology

L D Ríos-Barrera et al. Proc Natl Acad Sci U S A. .

Abstract

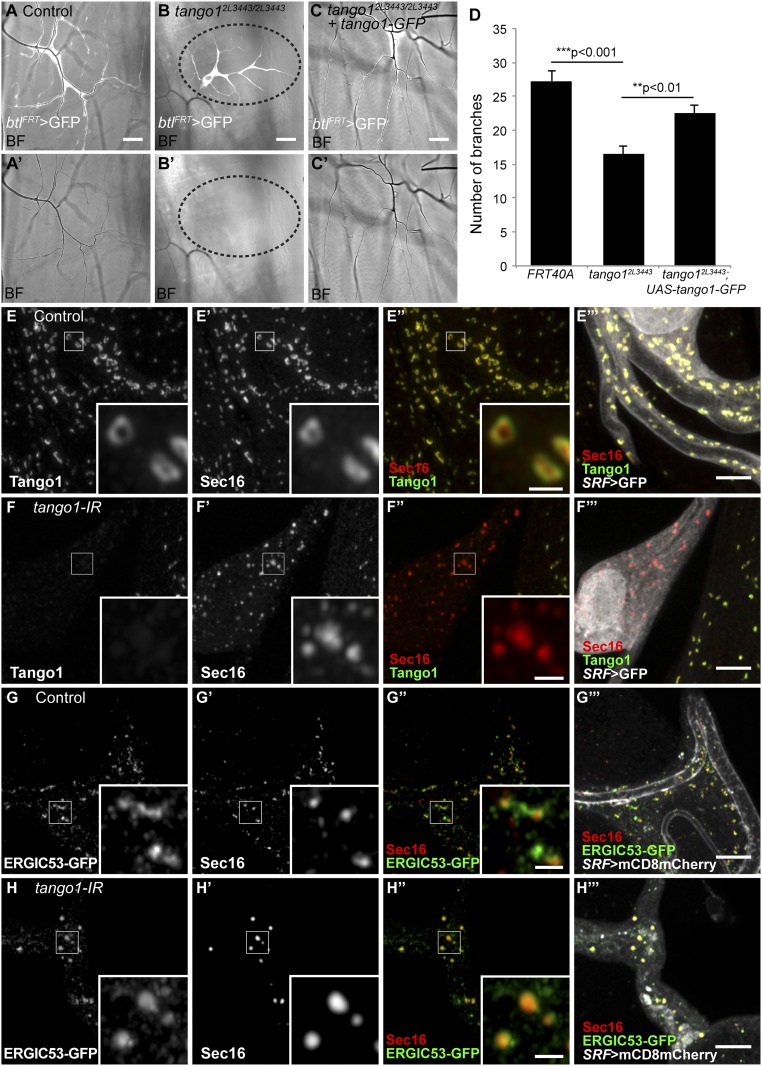
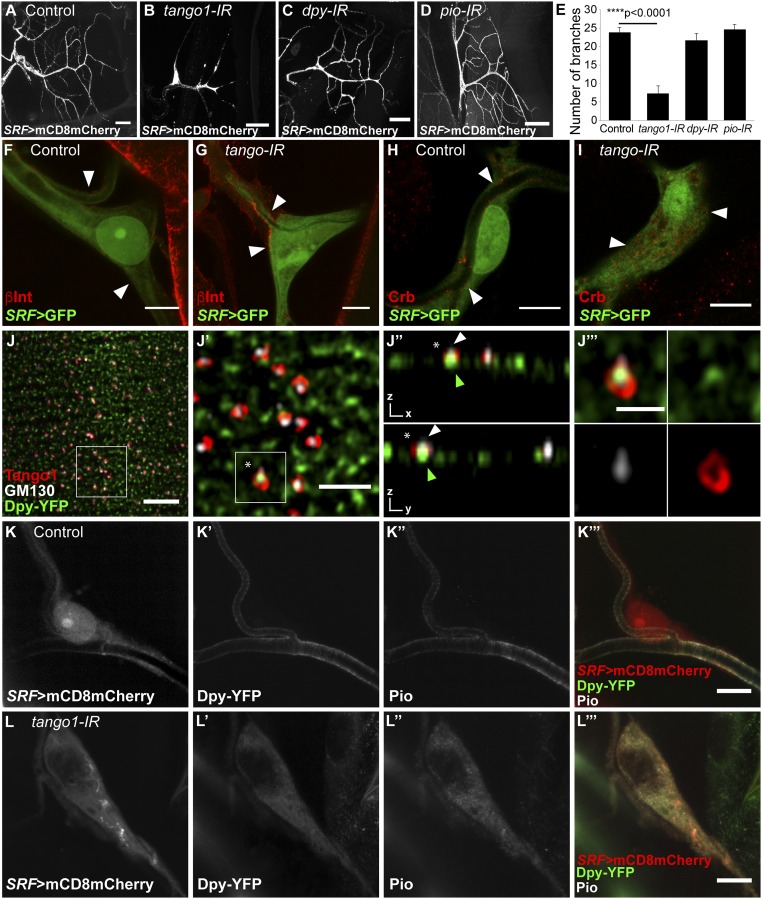
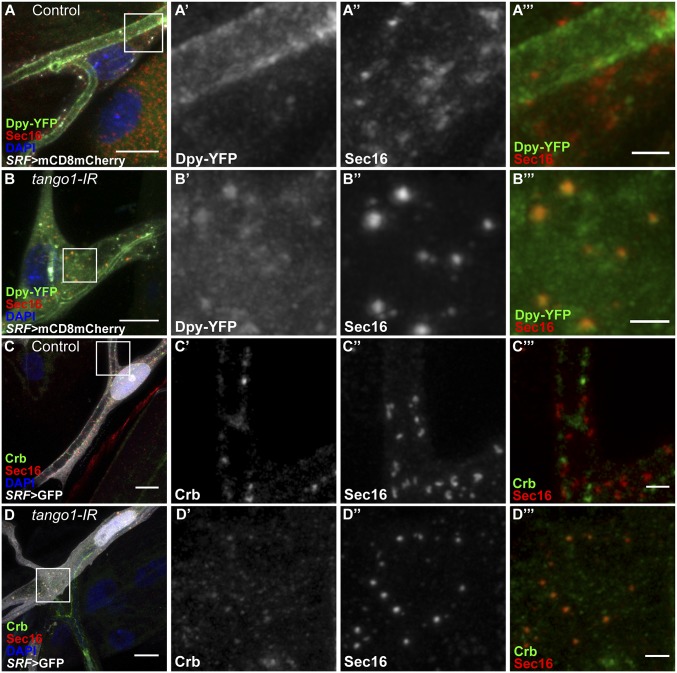
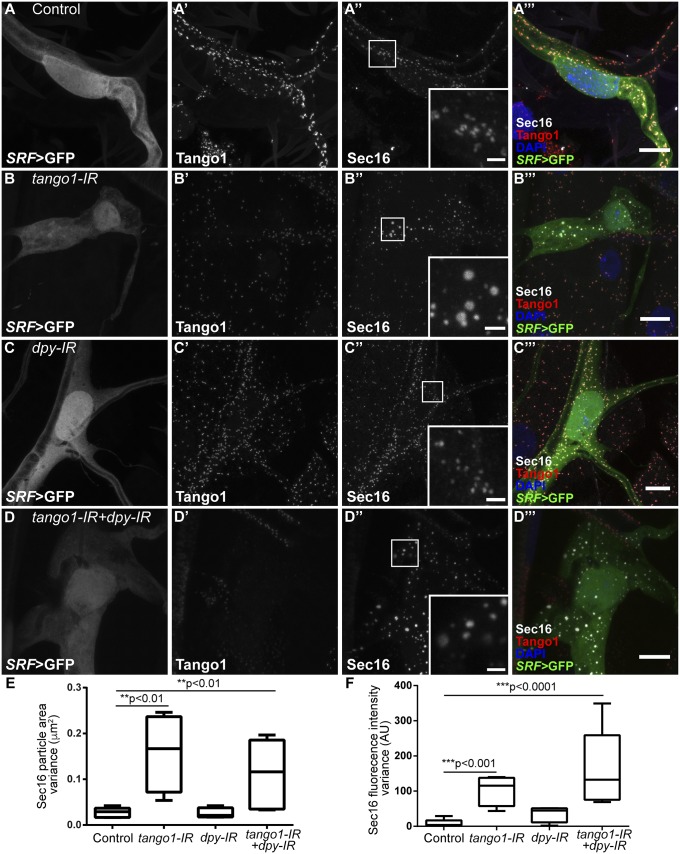
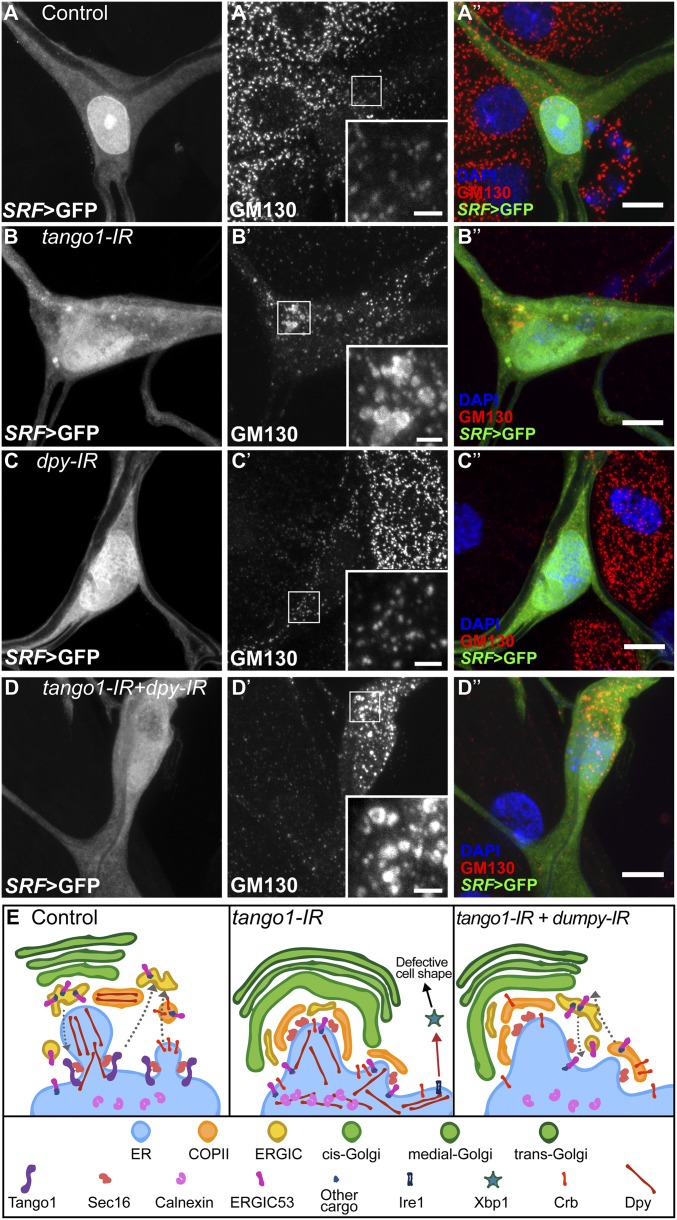
Tango1 enables ER-to-Golgi trafficking of large proteins. We show here that loss of Tango1, in addition to disrupting protein secretion and ER/Golgi morphology, causes ER stress and defects in cell shape. We find that the previously observed dependence of smaller cargos on Tango1 is a secondary effect. If large cargos like Dumpy, which we identify as a Tango1 cargo, are removed from the cell, nonbulky proteins reenter the secretory pathway. Removal of blocking cargo also restores cell morphology and attenuates the ER-stress response. Thus, failures in the secretion of nonbulky proteins, ER stress, and defective cell morphology are secondary consequences of bulky cargo retention. By contrast, ER/Golgi defects in Tango1-depleted cells persist in the absence of bulky cargo, showing that they are due to a secretion-independent function of Tango1. Therefore, maintenance of ER/Golgi architecture and bulky cargo transport are the primary functions for Tango1.

Keywords: ER stress; ERES; ERGIC; GM130; Sec16.


Conflict of interest statement

The authors declare no conflict of interest.

Figures

Fig. 1.
Fig. 1.
Effect of loss of Tango1 on cell, ER, and Golgi morphology. (AC) Bright field (BF) images of homozygous tango12L3443 mutant tracheal cells expressing GFP (btlFRT > GFP) allow the visualization of number of branches and the presence of air in terminal cells. Unlike control cells (A and A′), homozygous tango12L3443 cells are not air-filled (area surrounded by dotted line in B and B′). (C and C′) Expression of Tango1-GFP in mutant cells suppresses the air-filling defects and reestablishes near-normal number of branches (D). Control, n = 11; tango12L3443, n = 14; tango12L3443+Tango1-GFP, n = 11. Bars represent mean ± SEM. Significance was determined using two-tailed t test. (EH) Airyscan microscopy images of control (E and G) and tango1 knockdown cells (F and H), stained for Tango1 (EF) and Sec16 (E′F′) and for ERGIC53-GFP (GH; fTRG library, expressed at endogenous levels) and Sec16 (G′H′). Insets in EH are magnifications of representative regions, indicated by the white squares. (Scale bars: AC, 40 μm; EH, 5 μm; Insets, 1 μm.)
Fig. 2.
Fig. 2.
Function of cargo proteins and their distribution upon loss of Tango1. (AE) Terminal cells were visualized by expressing mCD8mCherry under the terminal-cell–specific driver SRF-gal4. (E) Manual quantification of branch numbers in terminal cells expressing different RNAi; cells expressing tango1 RNAi (B) have fewer branches than control cells (A). Neither dpy RNAi (C) nor pio RNAi (D) affect branch numbers. Control, n = 8; tango1-IR, n = 9; dpy-IR, n = 8; pio-IR, n = 9. Bars represent mean ± SEM. Significance was determined using two-tailed t test. (F and G) Confocal projections of control (F) and tango1-IR (G) terminal cells expressing SRF > GFP and stained for βPS integrin (βInt). Arrowheads point to βInt localization. (H and I) Confocal projections of control (H) and tango1-IR (I) terminal cells expressing SRF > GFP and stained for Crb. Arrowheads point to Crb localization. (J) Airyscan images of details of tracheal dorsal trunk cells expressing Dpy-YFP and stained for Tango1 and Golgi marker GM130. White squares indicate the magnified, representative regions in J′J‴. (J′) Magnification of the area marked in J. (J′′) Orthogonal views of a single plane from J′. The white arrowhead points to GM130 signal and the green arrowhead points to Dpy-YFP signal associated to Tango1. (J‴) Magnification of the area marked in J′. Asterisks in J′ and J″ show the Tango1 ring magnified in J‴. (K and L) Confocal projections of control (K) and tango1-IR (L) terminal cells expressing SRF > mCD8mCherry (K and L) and Dpy-YFP (K′ and L′) and stained for Pio (K″ and L″). [Scale bars: AD, 40 μm; FI, K, and L, 10 μm; J, 5 μm; J′, 2 μm (also applies to J″); J′′′, 1 μm.]
Fig. 3.
Fig. 3.
Effect of tango1 and dpy knockdown on Crb and the ER stress response. (AD) Terminal cells expressing mCD8mCherry (AD) and Xbp1-GFP (A″D″) under SRF-gal4. Xbp-1-GFP is translated and accumulated in the nucleus only after activation of the ER-stress response. (A′D′) In control (A′ and A″) and dpy-IR cells (C′ and C″), Crb localizes to the luminal membrane and Xbp1-GFP is not detectable. In tango1-IR cells (B′ and B″), Crb does not reach the membrane and Xbp1-GFP accumulates in the nucleus. These defects can be suppressed by additionally knocking down dpy (D′ and D″). (EG) Terminal cells expressing GFP and the ER stress response target Xbp1 under SRF-gal4. (E and E′) Bright field (BF) imaging shows lack of air in the tracheal branches. (F) Quantification of number of branches in tracheal cells expressing Xbp1 under SRF-gal4. Bars represent mean ± SD. Control, n = 5, SRF > Xbp1spliced, n = 8. Significance was assessed using Student’s t test. (G) Terminal cells expressing Xbp1spliced where stained against βInt and Crb. Arrowheads point to the normal distribution of both proteins. (Scale bars: A–D and G, 10 μm; E, 40 μm.)
Fig. 4.
Fig. 4.
Rescue of cell morphology in tango1-depleted cells by removal of Dpy. (AD) Bright field (BF) and mCD8mCherry expression under the terminal cell-specific driver SRF-gal4. In control (A and A′) and dpy-IR cells (C and C′), branches are filled with gas, whereas the absence of tango1 leads to failure of air-filling and reduced branching (B and B′). Both defects are suppressed by additionally knocking down dpy (D and D′). (E) Quantification of branching in AD. Bars represent mean ± SEM. Control, n = 4; tango1-IR, n = 9; dpy-IR, n = 8; tango1-IR+dpy-IR, n = 8. Significance was determined using one-way ANOVA and Tukey’s multiple comparisons test.
Fig. 5.
Fig. 5.
Distribution of cargo proteins and Sec16 in cells lacking Tango1. White boxes in AD are representative fields magnified in A′–A‴, B′–B″, C′C‴, and D′–D‴, respectively. (A and B) Confocal projections of terminal cells expressing mCD8mCherry under SRF-gal4, endogenously tagged Dpy-YFP (A′ and B′) and stained for Sec16 (A′′ and B′′). While in control cells Dpy-YFP is seen at the luminal membrane (AA′′′), in cells lacking tango1 Dpy-YFP shows a cytoplasmic distribution that partially overlaps with Sec16 (BB′′′). (C and D) Confocal projections of terminal cells expressing GFP under SRF-gal4 and stained for Sec16 and Crb. While in control cells Crb localizes to the luminal membrane (CC′′′), in cells lacking tango1 Crb shows a cytoplasmic distribution that partially overlaps with Sec16 (DD′′′). (Scale bars: A–D, 10 μm; A‴D‴, 2 μm.)
Fig. 6.
Fig. 6.
Effect of loss of Tango1 and Dpy on Sec16 distribution. (AD) Tango1 (A′D′) and Sec16 (A″D″) in terminal cells expressing GFP under SRF-gal4. In control (AA‴) and dpy-IR cells (CC‴), Sec16 particles are homogeneous in size and fluorescence intensity; in tango1-IR cells, Sec16 particle size and fluorescence intensity is variable (BB‴), and this variability is not altered by simultaneously removing Dpy (DD‴). Insets in (A″D″) are magnifications of representative regions, indicated by the white squares. (E and F) Variance of Sec16 particle size (E) and Sec16 fluorescence intensities (F). Control, n = 5; tango1-IR, n = 4; dpy-IR, n = 4; tango1-IR+dpy-IR, n = 5. Significance was determined using one-way ANOVA and Sidak’s multiple comparisons test. (Scale bars: 10 μm; Insets, 2 μm.)
Fig. 7.
Fig. 7.
Effect of loss of Tango1 and Dpy on GM130 distribution. (AD) Terminal cells expressing GFP under SRF-gal4, and stained for the Golgi marker GM130 (A′–D′). In control (A–A″) and dpy-IR cells (C–C″), the distribution and size of GM130-labeled structures is homogeneous, whereas in tango1-IR cells, GM130 is seen in heterogeneous aggregates (B–B″). Knocking down dpy in tango1-IR cells does not rescue GM130 distribution (DD″). Insets in A′D′ are magnifications of representative regions, indicated by the white squares. (Scale bars: 10 μm; Insets, 2 μm.) (E) Model showing the role of Tango1 in Dpy trafficking and the indirect consequences of Dpy blockage. In the absence of Tango1, the structure of the ER, COPII, and Golgi apparatus are changed, ERGIC53 is retained in the ER, and the ER-stress response is activated. Additionally, neither Dpy nor Crb reach the plasma membrane. If Dpy levels are reduced, ERGIC53 shuttles out of the ER, the ER-stress response is no longer active and Crb can be secreted. However, the ER, COPII, and Golgi morphology are not restored.

Similar articles

Cited by

References

    1. Santos AJ, Nogueira C, Ortega-Bellido M, Malhotra V. TANGO1 and Mia2/cTAGE5 (TALI) cooperate to export bulky pre-chylomicrons/VLDLs from the endoplasmic reticulum. J Cell Biol. 2016;213:343–354. - PMC - PubMed
    1. Pfeffer SR. Lipoprotein secretion: It takes two to TANGO. J Cell Biol. 2016;213:297–299. - PMC - PubMed
    1. Saito K, et al. TANGO1 facilitates cargo loading at endoplasmic reticulum exit sites. Cell. 2009;136:891–902. - PubMed
    1. Santos AJ, Raote I, Scarpa M, Brouwers N, Malhotra V. TANGO1 recruits ERGIC membranes to the endoplasmic reticulum for procollagen export. Elife. 2015;4:e10982. - PMC - PubMed
    1. Maeda M, Katada T, Saito K. TANGO1 recruits Sec16 to coordinately organize ER exit sites for efficient secretion. J Cell Biol. 2017;216:1731–1743. - PMC - PubMed

Publication types

MeSH terms

Substances

LinkOut - more resources