. 2017 Nov 28;114(48):12779-12784.
doi: 10.1073/pnas.1708151114. Epub 2017 Nov 14.

Frequent nonallelic gene conversion on the human lineage and its effect on the divergence of gene duplicates

Affiliations

Frequent nonallelic gene conversion on the human lineage and its effect on the divergence of gene duplicates

Arbel Harpak et al. Proc Natl Acad Sci U S A. .

Abstract

Gene conversion is the copying of a genetic sequence from a "donor" region to an "acceptor." In nonallelic gene conversion (NAGC), the donor and the acceptor are at distinct genetic loci. Despite the role NAGC plays in various genetic diseases and the concerted evolution of gene families, the parameters that govern NAGC are not well characterized. Here, we survey duplicate gene families and identify converted tracts in 46% of them. These conversions reflect a large GC bias of NAGC. We develop a sequence evolution model that leverages substantially more information in duplicate sequences than used by previous methods and use it to estimate the parameters that govern NAGC in humans: a mean converted tract length of 250 bp and a probability of [Formula: see text] per generation for a nucleotide to be converted (an order of magnitude higher than the point mutation rate). Despite this high baseline rate, we show that NAGC slows down as duplicate sequences diverge-until an eventual "escape" of the sequences from its influence. As a result, NAGC has a small average effect on the sequence divergence of duplicates. This work improves our understanding of the NAGC mechanism and the role that it plays in the evolution of gene duplicates.

Keywords: GC bias; gene conversion; gene duplicates; mutation rate; sequence evolution.


Conflict of interest statement

The authors declare no conflict of interest.

Figures
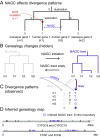
Fig. 1.
Fig. 1.
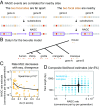
NAGC alters divergence patterns. (A) NAGC can drive otherwise rare divergence patterns, like the sharing of alleles between paralogs but not orthologs. (B) An example of a local change in genealogy, caused by NAGC. (C) Examples of divergence patterns in a small multigene family. Some divergence patterns—such as the one highlighted in purple—were both rare and spatially clustered. We hypothesized that underlying these changes are local changes in genealogy, caused by NAGC. (D) Genealogy map (null genealogy marked by white, NAGC marked by purple tracts) inferred by our HMM based on observed divergence patterns (stars). Two different gene families are shown. For simplicity, only the most informative patterns (purple and gray sites, as exemplified in C) are plotted.
Fig. 2.
Fig. 2.
Properties of HMM-inferred converted tracts. (A) Number of tracts per intron. (B) Tract length distribution. (C) The purple dot shows the average GC content in converted regions. The gray dot shows the average for random unconverted regions, matched in length and within the same gene as the converted regions. The lines show GC content for symmetric 200 bp bins centered at the respective regions (excluding the focal tract). Shaded regions show 95% confidence intervals. The black line shows the intronic average for human genes with no identified paralogs. (D) In purple sites (Fig. 1C) that are most likely to be a direct result of NAGC (right bar), ATGC substitutions are significantly more common than GCAT substitutions. The left bar shows the estimated proportion of ATGC substitutions through point mutations and AGC in unconverted regions, which we used to derive the expected proportion for unbiased NAGC (pink line) after accounting for their different GC contents. Error bars show two standard errors around the point estimates. (E) Point estimate of GC bias. The dashed purple line shows the estimated probability of resolving a GC/AT heteroduplex in favor of the G/C allele. The color dots show simulation results under three different mechanistic models of biased gene conversion. The solid colored lines show linear fits. The gray-shaded area is a 95% binomial confidence interval for the “tract” model with no GC bias.
Fig. 3.
Fig. 3.
Estimation of NAGC parameters. (A) The two-site sequence evolution model exploits the correlated effect of NAGC on nearby sites (near with respect to the mean tract length). In this illustration, orange squares represent focal sites. Point substitutions are shown by the red points, and a converted tract is shown by the purple rectangle. (B) Illustration of a single datum on which we compute the full likelihood, composed of two sites in two duplicates across multiple species (except for the mouse outgroup for which only one ortholog exists). (C) MLE rate estimates for each intron (orange points). MLEs of zero are plotted at the bottom. The solid line shows a natural cubic spline fit. The rate decreases with sequence divergence (ds). We therefore only use lowly diverged genes (ds5%) to get point estimates of the baseline rate. (D) Composite likelihood estimates. The black point is centered at our point estimates for ds5% genes. The blue points show 1,000 nonparametric bootstrap estimates, where the intensity of each point corresponds to the number of bootstrap samples. The corresponding 95% marginal confidence intervals are shown by black lines.
Fig. 4.
Fig. 4.
The effect of NAGC on the divergence of duplicates. The figure shows both data from human paralogs and theoretical predictions of different NAGC models. The blue line shows the expected divergence in the absence of NAGC and the red line shows the expected divergence with NAGC acting continuously. The pink, orange, and red lines show the expected divergence for models in which NAGC initiation is contingent on sequence similarity between the paralogs. The gray horizontal bars correspond to human duplicate pairs. The duplication time for each pair is inferred by examining the nonhuman species that carry orthologs for both of the human paralogs. The y axis shows the synonymous sequence dissimilarity between the two human paralogs.

Similar articles

Cited by

References

    1. Mitchell MB. Aberrant recombination of pyridoxine mutants of Neurospora. Proc Natl Acad Sci USA. 1955;41:215–220. - PMC - PubMed
    1. Chen JM, Cooper DN, Chuzhanova N, Férec C, Patrinos GP. Gene conversion: Mechanisms, evolution and human disease. Nat Rev Genet. 2007;8:762–775. - PubMed
    1. Innan H, Kondrashov F. The evolution of gene duplications: Classifying and distinguishing between models. Nat Rev Genet. 2010;11:97–108. - PubMed
    1. Bischoff J, et al. Genome-wide identification of pseudogenes capable of disease-causing gene conversion. Hum Mutat. 2006;27:545–552. - PubMed
    1. Casola C, Zekonyte U, Phillips AD, Cooper DN, Hahn MW. Interlocus gene conversion events introduce deleterious mutations into at least 1% of human genes associated with inherited disease. Genome Res. 2012;22:429–435. - PMC - PubMed

Publication types

LinkOut - more resources