. 2017 Nov 15;8(1):1506.
doi: 10.1038/s41467-017-01647-5.

Polo-like kinase 1 coordinates biosynthesis during cell cycle progression by directly activating pentose phosphate pathway

Affiliations

Polo-like kinase 1 coordinates biosynthesis during cell cycle progression by directly activating pentose phosphate pathway

Xiaoyu Ma et al. Nat Commun. .

Abstract

Two hallmarks for cancer cells are the accelerated cell cycle progression as well as the altered metabolism, however, how these changes are coordinated to optimize the growth advantage for cancer cells are still poorly understood. Here we identify that Polo-like kinase 1 (Plk1), a key regulator for cell mitosis, plays a critical role for biosynthesis in cancer cells through activating pentose phosphate pathway (PPP). We find that Plk1 interacts with and directly phosphorylates glucose-6-phosphate dehydrogenase (G6PD). By activating G6PD through promoting the formation of its active dimer, Plk1 increases PPP flux and directs glucose to the synthesis of macromolecules. Importantly, we further demonstrate that Plk1-mediated activation of G6PD is critical for its role to promote cell cycle progression and cancer cell growth. Collectively, these findings establish a critical role for Plk1 in regulating biosynthesis in cancer cells, exemplifying how cell cycle progression and metabolic reprogramming are coordinated for cancer progression.


Conflict of interest statement

The authors declare no competing financial interests.

Figures

Fig. 1
Fig. 1
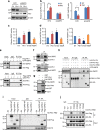
Plk1 activates G6PD during cell cycle progression. ac HeLa cells were synchronized into G1, S, and G2/M phases, and cells were harvested and subjected to western blot (a) and G6PD or 6PGD enzyme activity measurement (b), and NADPH and NADP+/NADPH ratio levels (c) at indicated time after release. n = 3 biologically independent replicates. Data were presented as mean ± s.d. *P < 0.05 as compared to G1 phase group by two-sided Student’s t-test. β-actin served as loading control. df HeLa cells were synchronized at G0/G1 phase with double HU block. The G6PD activity (d), and NADPH and NADP+/NADPH ratio levels (e) were measured in the presence or absence of 1 μM Plk1 inhibitor BI2536 at indicate hours after release. FACS analysis of cell cycle progression was shown in f. n = 3 biologically independent replicates. Data were presented as mean ± s.d. *P < 0.05 as compared to 0 h group, # P < 0.05 as compared to DMSO group by two-sided Student’s t-test. g, h HeLa cells were transfected with empty vector (EV) or gradual amount of Flag-Plk1 plasmids. Cells were harvested and subjected to western blot and G6PD activity measurement (g), and NADPH and NADP+/NADPH ratio levels (h). n = 3 biologically independent replicates. Data were presented as mean ± s.d. *P < 0.05 as compared to EV group by two-sided Student’s t-test. β-actin served as loading control. i, j Plk1 protein levels and G6PD enzyme activity (i), and NADPH levels and NADP+/NADPH ratio (j) were measured in HeLa cells stably expressing non-targeting control (NTC) or shPlk1. n = 3 biologically independent replicates. Data were presented as mean ± s.d. *P < 0.05 as compared to NTC group by two-sided Student’s t-test. β-actin served as loading control
Fig. 2
Fig. 2
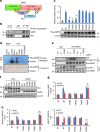
Plk1 enhances PPP and biosynthesis in cancer cells. a Using [U-13C]-labeled glucose, M + 5-labeled R5P produced from PPP was detected by LC-MS. HeLa cells were synchronized by double HU block. When the cells were treated for the second round of HU block for 11 h, i.e., 1 h before releasing, U-13C glucose was added into the medium and further culture for 1 h and then harvested for G1 phase cell analysis. For cell samples of S and G2/M phases, after the regular second round of HU block for 12 h, cells were released into fresh HU-free medium and further cultured for 4 and 9 h, respectively, followed by supplementation of U-13C glucose and 1 h culture before harvesting cells for analysis. Cells were harvested and 13C-incorporated R5P was detected by LC-MS. The calculation of % of the m + 5 isotopologue of ribose is % of the sum of isotopologues. bf The PPP metabolites were detected by NMR. Cells were cultured in medium containing [2-13C]- or [U-13C]-labeled glucose. The graphic description shows that by using the [2-13C]-labeled glucose, NMR measurement could distinguish the lactate produced from PPP and that derived from the general glycolysis (b). Lactate derived from the oxidative PPP was calculated by the total lactate multiplied with the ratio of 3-13C lactate detected by NMR in Plk1 overexpression (c) or knockdown cells (d). Using the [U-13C]-labeled glucose, R5P and some downstream nucleotides generated from the PPP flux were detected by NMR in Plk1 overexpression (e) or knockdown cell lines (f). To induce Plk1 shRNA expression, cells were grown in the presence of 0.1 μg/ml doxycycline for 72 h. The calculation of isotopologue of ribose is total intensity of 13C-labeled ribose moiety. g U-13C glucose metabolic flux assays were performed in Plk1-overexpressing HeLa cells with G6PD knockdown by NMR. The results were normalized to cell numbers or cell wet weight. Data were represented as the mean ± s.d. or s.e.m. *P < 0.05 as compared to indicated group by two-sided Student’s t-test
Fig. 3
Fig. 3
Plk1 regulates G6PD activity by interacting with G6PD. a, b HeLa cells stably overexpressing EV or Plk1 were further infected with viruses expressing NTC or shG6PD. Plk1 and G6PD protein (a), and relative NADPH and NADP+/NADPH ratio levels (b) were determined. n = 3 biologically independent replicates. Data were presented as mean ± s.d. *P < 0.05 as compared between indicated groups by two-sided Student’s t-test. c, d HeLa cells were stably overexpressing EV or Plk1 wild type or its T210D or K82R mutants. G6PD activity (c), and relative NADPH and NADP+/NADPH ratio levels (d) were determined. n = 3 biologically independent replicates. Data were presented as mean ± s.d. *P < 0.05 as compared to EV group by two-sided Student’s t-test. (e) 293T cells were transfected with eGFP-G6PD plasmids alone or together with Flag-Plk1 plasmids. Or 293T cells were transfected with pSin-Plk1 plasmids alone or together with Flag-G6PD plasmids. Cell lysates were immunoprecipitated with anti-Flag antibody or IgG, followed by western blot analysis. f HeLa cells were harvested and subjected to immunoprecipitation with anti-Plk1 or anti-G6PD, followed by western blot analysis with anti-Plk1 and anti-G6PD. g GST pull down of His-G6PD by GST-Plk1 using proteins purified in E. coli bacteria, followed by western blot analysis with anti-G6PD and anti-GST antibodies. h 293T cells were transfected with eGFP-G6PD plasmids alone or together with HA-tagged plasmids expressing Plk1 full length or its kinase domain or polo-box domain. Cell lysates were immunoprecipitated with anti-HA antibody or IgG, followed by western blot analysis. i 293T cells were transfected with vectors expressing HA-Plk1-PBD and Flag-G6PD wild type or its truncated mutants as indicated. Cells were then harvested and subjected to immunoprecipitation analysis with anti-HA antibody or IgG, followed by western blot analysis with anti-Flag and anti-HA antibody. j 293T cells were transfected with vectors expressing HA-Plk1-PBD and Flag-G6PD wild type or its point mutations as indicated. Cells were then harvested and subjected to immunoprecipitation analysis with anti-HA antibody or IgG, followed by western blot analysis with anti-Flag and anti-HA antibody
Fig. 4
Fig. 4
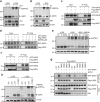
Plk1 regulates G6PD activity by phosphorylating G6PD. a The model depicting that the PBD domain of Plk1 protein binds to G6PD via the phosphorylation of its S180, S189, and T279 sites, and the kinase domain of Plk1 phosphorylates T406, T466 of G6PD. b HeLa cells were harvested and lysed. The cell lysates were separated into two parts, treated with or without PP2A phosphatase, followed by IP with anti-Plk1 and western blot analysis with G6PD and Plk1 antibodies. c HeLa cells expressing shG6PD were further infected with viruses expressing G6PD wild type or its mutants. The G6PD activity and protein expression were detected in those cells. Data were presented as mean ± s.d. *P < 0.05 as compared to EV group, # P < 0.05 as compared to WT group by two-sided Student’s t-test. β-actin served as loading control. d Bacterial-expressed G6PD wild type and mutants were subjected to in vitro kinase assay using 32P labeling. Kinases used were insect-expressed wild-type Plk1 (active form) and K82R (inactive form). Casein acted as positive control, and the loading controls are shown in the bottom panel (stained by Ponceau S). e HeLa cells stably expressing NTC or tet-inducible shPlk1 were synchronized at G1, S, and G2/M phases. Cell were harvested and subjected to immunoprecipitation with anti-G6PD antibody, followed by western blot with G6PD and pan-phosphor-threonine antibody. Cells were grown in the presence of 0.1 μg/ml doxycycline to induce Plk1 shRNA expression. fh HeLa cells stably expressing shG6PD were further transfected with vectors expressing G6PD wild type or its mutants together with NTC or shPlk1 as indicated. Cells were harvested and subjected to western blotting using Plk1 and G6PD antibodies (f), G6PD enzyme activity measurement (g), and NADPH level and NADP+/NADPH ratio measurements (h). n = 3 biologically independent replicates. Data were presented as mean ± s.d. *P < 0.05 as compared between indicated groups by two-sided Student’s t-test
Fig. 5
Fig. 5
Plk1-mediated G6PD phosphorylation promotes its dimerization. a, b HeLa cells overexpressing Plk1 (a) or expressing tet-inducible shPlk1 (b) were treated with or without 1 mM disuccinimidyl suberate (DSS), followed by western blot analysis with antibodies against G6PD or Plk1. To induce Plk1 shRNA expression, cells were grown in the presence of 0.1 μg/ml doxycycline for 72 h. β-actin served as loading control. c HeLa cells transfected with eGFP-G6PD and Flag-G6PD vectors were co-transfected with pSin-Plk1 plasmid. Cell lysates were immunoprecipitated with anti-Flag antibody, followed by western blot analysis with antibodies against G6PD or Plk1. d GFP-G6PD and Flag-G6PD co-transfected HeLa cells were treated with BI2536 for 16 h at indicated concentrations. Cells were harvested and subjected to Co-IP using Flag antibody, followed by western blotting with Flag or GFP antibody. e HeLa cells were synchronized using HU double block during which vehicle or 1 μM BI2536 was added 1 h before releasing. Cells were harvested and crosslinked using DSS, followed by western blotting with anti-G6PD. f HeLa cells transfected with eGFP-G6PD and Flag-G6PD were treated with nocodazole. Cell lysates were immunoprecipitated with anti-Flag antibody, followed by western blot analysis with antibodies against G6PD. g NTC- or shPlk1-expressing 293T cells were co-transfected with GFP-G6PD and Flag-G6PD wild type or mutants as indicated. Cells were harvested and subjected to Co-IP using Flag antibody, followed by western blotting with Flag or GFP antibody. h G6PD wild type or its T406A mutant was forced overexpressed in HeLa cells stably expressing shG6PD. Cells were treated with or without 1 mM DSS, followed by western blot analysis with antibodies against G6PD. β-actin served as loading control. NTC denotes non-targeting control
Fig. 6
Fig. 6
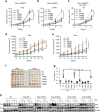
G6PD activity is vital for Plk1-regulated cell proliferation. a HeLa cells stably transfected with tet-inducible NTC or shG6PD (expressing RFP) were subjected to the living cell imaging station. To induce shRNA expression, cells were grown in the presence of 0.1 μg/ml doxycycline for 72 h. Then living cell imaging was done. The mitotic duration time of RFP positive cells was analyzed. n = 20 from 5 different fields. b HeLa cells stably expressing tet-inducible shG6PD (expressing RFP) were further transfected with vectors expressing eGFP-G6PD wild type and its mutants as indicated. Cells were treated with doxycycline in the presence or absence of NAC (2 mM) and Nuc mixtures (25 μM) in the medium, followed by living cell imaging. Images were recorded for 48 h. The mitotic duration time of GFP and RFP double-positive cells was statistically calculated. n = 20 from 5 different fields. c HeLa cells stably expressing NTC or shG6PD were further infected with viruses expressing empty vector (EV) or Flag-G6PD wild type or its mutants as indicated. Cells were treated with vehicle or Nuc mix (25 μM) and NAC (2 mM). Cell numbers were counted 4 days after treatment. Data were presented as mean ± s.d. *P < 0.05 as compared between indicated groups by two-sided Student’s t-test. d HeLa cells stably expressing NTC or tet-inducible shPlk1 were grown in the presence of 0.1 μg/ml doxycycline to induce Plk1 shRNA expression. After 48 h of treatment, 2 mM NAC and 25 μM nucleosides mix were added together with doxycycline for another 24 h. Cell cycle distribution was monitored by flow cytometry. Representative histogram data and statistical results were shown. e, f HeLa cells stably expressing tet-inducible shPlk1 (e) or HeLa cells stably overexpressing Plk1 with further G6PD knockdown by shRNAs (f) were cultured in the medium supplemented with both 2 mM NAC and 25 μM nucleosides mix for 96 h. To induce Plk1 shRNA expression, cells were grown in the presence of 0.1 μg/ml doxycycline. Cell numbers were determined by trypan blue counting. Data were presented as mean ± s.d. *P < 0.05 as compared between indicated groups by two-sided Student’s t-test
Fig. 7
Fig. 7
G6PD is critical for Plk1-mediated tumor proliferation in vivo. a, b HeLa cells stably expressing shG6PD were infected with viruses expressing pSin-3xFlag-G6PD wild type or mutants together with viruses expressing NTC (a) or shPlk1 (b) as indicated. Cell numbers were counted by trypan blue staining. n = 3 biologically independent replicates. Data were presented as mean ± s.d. *P < 0.05 as compared between indicated groups by two-sided Student’s t-test. c HeLa cells stably expressing shG6PD were infected with viruses expressing pSin-3xFlag-G6PD wild type and mutants together with viruses expressing tet-inducible shPlk1 as indicated. Cells were treated with 0.1 μg/ml doxycycline and cell numbers were counted by trypan blue staining. n = 3 biologically independent replicates. Data were presented as mean ± s.d. *P < 0.05 as compared between indicated groups by two-sided Student’s t-test. dg HeLa cells stably expressing shG6PD were infected with viruses expressing pSin-3xFlag-G6PD wild type and mutants together with viruses expressing tet-inducible shPlk1 as indicated. Equal numbers of cells were subcutaneously injected into nude mice (n = 5 for each group). The mice were treated with or without doxycycline (1 mg/ml) in drinking water staring from 1 day before inoculation. The doxycycline-containing water was freshly prepared every other day. Tumor growth was measured starting from 10 days after inoculation (d, e). Tumors were extracted and compared at the end of the experiment (f, g). n = 5 for each group. Data were presented as mean ± s.d. *P < 0.05 as compared between indicated groups by two-sided Student’s t-test. h Protein levels of Plk1 and G6PD were determined by western blot using the lysates of tumor tissues from each group as in f using anti-Plk1 and anti-Flag. β-actin served as loading control
Fig. 8
Fig. 8
Working model. In this study, we demonstrate that Plk1 interacts with and directly phosphorylates G6PD to promote the formation of its active dimer, thereby enhancing PPP flux and macromolecule biosynthesis. Together with previous reports that have established multiple critical roles for Plk1 in regulation of mitosis and cell cycle progression, we propose that Plk1 coordinates biosynthesis with cell cycle progression to promote cancer development

References

    1. Warburg O. On the origin of cancer cells. Science. 1956;123:309–314. doi: 10.1126/science.123.3191.309. - DOI - PubMed
    1. Vander Heiden MG, Cantley LC, Thompson CB. Understanding the Warburg effect: the metabolic requirements of cell proliferation. Science. 2009;324:1029–1033. doi: 10.1126/science.1160809. - DOI - PMC - PubMed
    1. DeBerardinis RJ, Lum JJ, Hatzivassiliou G, Thompson CB. The biology of cancer: metabolic reprogramming fuels cell growth and proliferation. Cell Metab. 2008;7:11–20. doi: 10.1016/j.cmet.2007.10.002. - DOI - PubMed
    1. Wang Z, et al. Cyclin B1/Cdk1 coordinates mitochondrial respiration for cell-cycle G2/M progression. Dev. Cell. 2014;29:217–232. doi: 10.1016/j.devcel.2014.03.012. - DOI - PMC - PubMed
    1. Cai L, Tu BP. Driving the cell cycle through metabolism. Annu. Rev. Cell Dev. Biol. 2012;28:59–87. doi: 10.1146/annurev-cellbio-092910-154010. - DOI - PubMed

Publication types

MeSH terms

LinkOut - more resources