. 2017 Nov 14;7(1):15586.
doi: 10.1038/s41598-017-15568-2.

Timescale Separation of Positive and Negative Signaling Creates History-Dependent Responses to IgE Receptor Stimulation

Affiliations

Timescale Separation of Positive and Negative Signaling Creates History-Dependent Responses to IgE Receptor Stimulation

Brooke Harmon et al. Sci Rep. .

Abstract

The high-affinity receptor for IgE expressed on the surface of mast cells and basophils interacts with antigens, via bound IgE antibody, and triggers secretion of inflammatory mediators that contribute to allergic reactions. To understand how past inputs (memory) influence future inflammatory responses in mast cells, a microfluidic device was used to precisely control exposure of cells to alternating stimulatory and non-stimulatory inputs. We determined that the response to subsequent stimulation depends on the interval of signaling quiescence. For shorter intervals of signaling quiescence, the second response is blunted relative to the first response, whereas longer intervals of quiescence induce an enhanced second response. Through an iterative process of computational modeling and experimental tests, we found that these memory-like phenomena arise from a confluence of rapid, short-lived positive signals driven by the protein tyrosine kinase Syk; slow, long-lived negative signals driven by the lipid phosphatase Ship1; and slower degradation of Ship1 co-factors. This work advances our understanding of mast cell signaling and represents a generalizable approach for investigating the dynamics of signaling systems.


Conflict of interest statement

The authors declare that they have no competing interests.

Figures

Figure 1
Figure 1
A microfluidic device for activation and deactivation of IgE receptor (FcεRI) signaling in mast cells. Top: An illustration of the microfluidic device with inlets, outlets (F H is the exit flow rate), and serpentine channels. Bottom: DF3, a trivalent DNP ligand, induces aggregation of FcεRI via interaction with FcεRI-bound anti-DNP IgE, leading to release of inflammatory mediators including β-hexosaminidase. In contrast, monovalent DNP-lysine induces breakup of aggregates, thereby halting FcεRI signaling and attenuating release of inflammatory mediators.
Figure 2
Figure 2
Responses to complex waveform inputs, implemented with the microfluidic device of Fig. 1. (a) Between times t 0 and t 1, cells were exposed to a first pulse of 10 nM DF3, designated S 1. Between times t 1 and t 2, cells were exposed to 1 mM DNP-lysine. This period is designated I. Finally, between times t 2 and t 3, cells were exposed to a second pulse of 10 nM DF3, designated S 2. (b) Responses during S 2 depend on the length of I (compare top and bottom panels). We measured degranulation during S 1 and S 2, represented by H(S 1) and H(S 2). As can be seen at top right in panel b, with I = 5 min, H(S 2) < H(S 1). In contrast, as can be seen at bottom right in panel b, with I = 240 min, H(S 2) > H(S 1); Data are presented as mean ± S.D (n = 3), two-tailed paired t-test comparison of % H(T) values at S2 versus S1 (****P < 0.0001; ***P < 0.001; I = 5 min, P = 6.99 × 10−5; I = 240 min, P = 8.13 × 10−4).
Figure 3
Figure 3
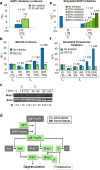
A mathematical model to explain the phenomena of desensitization and priming. (a) Degranulation in in the absence (no inhibitor, blue bars) or presence of Ship1 inhibitor (3AC, green bars), after pulsed stimulation in cell culture. Data are presented as mean ± S.D (n = 3), two-tailed paired t-test comparison of % H(T) values at S2 for 3AC treated versus untreated cells (**P < 0.01; P = 0.0029). (b) Degranulation in the absence (no inhibitor, blue bars) or presence of a proteasome inhibitor (MG132, green bars), after pulsed stimulation in cell culture; (a,b) Data are presented as mean ± S.D (n = 3), For each pair of untreated cells (blue bars) compared to treated cells (green bars), we performed a paired two-tailed t-test. Asterisks indicate statistically significant differences: ***P < 0.001; **P < 0.01; and *P < 0.05; I = 30 min, P = 0.021; I = 120 min, P = 0.0097; I = 240 min, P = 1.27 × 10−4). (c) Ship1 protein abundance over time measured by western blot. Data represent results from one of three experiments with similar results. (d) Diagram of the mathematical model. Activation of IgE-FcεRI by DF3 triggers activation of Syk, Ship1, and the Ship1 co-factor X. Syk and Ship1 exert opposing influences on degranulation. The proteasome degrades X. (e) Simulated degranulation in the absence (blue bars) or presence (green bars) of a Ship1 inhibitor. The inhibitor was simulated with several possible levels of efficacy, ranging from 10% to 90% inhibition of Ship1 activity. (f) Simulated degranulation in the absence (blue bars) or presence (green bars) of a proteasome inhibitor.
Figure 4
Figure 4
Simulated degranulation (black bars) vs. measured degranulation for cells cultured in the channel of the microfluidic device (green bars) or in 24-well plates (blue bars). The leftmost set of bars report H(S 1). The other bars report H(S 2) for I = 5, 30, 60, 120, or 240 min. S 1 represents the initial 5 min stimulation with DF3, S 2 is a second 5 min stimulation with DF3 after time period of signaling quiescence (DNP-lysine treatment) indicated by I. Shown are the means for three independent experiments performed in triplicate ± SD, paired two-tailed t test comparison of % H(T) values at S 2 versus S 1 (***P < 0.001; **P < 0.01; and *P < 0.05, on device: I = 10 min P = 0.006; I = 30 min, P = 0.044; I = 120 min, P = 0.0019; I = 240 min, P = 8.13 × 10−4. Off device: I = 10 min P = 5.98 × 10−5; I = 30 min, P = 1.67 × 10−4.; I = 60 min, P = 0.0038; I = 120 min, P = 3.07 × 10−4; I = 240 min, P = 0.0073.
Figure 5
Figure 5
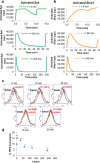
Simulated and measured dynamics of Syk and Ship1 activation/deactivation. (a) Simulation of copies per cell (cpc) of activated Syk (green line) for varying I values. (b) Simulation of cpc of activated Ship1 (orange line) for varying I values. c) Histograms of phosphorylation of Syk pY346, a readout of activation, as measured by flow cytometry during the same stimulation pattern as panel A (top). Cells were exposed to a 5-min pulse of DF3 (top left), followed by a 5-min pulse of DNP-lysine (10 min, bottom left), and then a second pulse of DF3 (15 min, top middle), followed by a 5-min pulse of DNP-lysine (20 min, bottom right), and then a third pulse of DF3 (25 min, top right). Measurements were taken for non-stimulated cells (basal) and at the end of each of these periods (red histograms); data are representative of results from three similar experiments. (d) Activation of Ship1 upon DF3 stimulation following the indicated I values, as measured by a malachite green assay with immunoprecipitated Ship1. Data are presented as mean ± SD (n = 3), t-test comparison of % PIP3 conversion values at S 1 versus S 2 (**P < 0.01; *P < 0.05; I = 5 min P = 0.0041; I = 30 min, P = 0.0045; I = 60 min, P = 0.0089; I = 120 min, P = 4.52 × 10−4; I = 240 min, P = 0.0055).
Figure 6
Figure 6
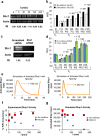
Role of Shc1 in memory responses. (a) Measured Shc1 abundance over time by western blot, the RI was calculated as the quotient of the densitometry signal for Shc1 band and that for actin and then normalized by the ratio obtained at time 0 (S1, considered 1). Data represent results from one of three experiments with similar results. (b) Predicted effect of Shc1 knockdown on memory (black bars), compare to simulations of WT cells without Shc knockdown (white bars). (c) Measured Shc1 protein expression by western blot in RBL-2H3 mast cells transfected with control scrambled siRNA or Rat Shc1 siRNA (Shc1 KD cells). Data represent results from one of three experiments with similar results. (d) Cell culture degranulation of WT (control scrambled siRNA, blue bars) and Shc1 KD cells (Rat Shc1 siRNA, green bars) for various I intervals; data are presented as mean ± S.D (n = 3), t test comparison of H(S2) values of control siRNA cells compared to that of Shc1 KD cells (*, P < 0.05; I = 15 min, P = 0.0497; I = 30 min, P = 0.026; I = 60 min, P = 0.037; I = 75 min, P = 0.039; I = 90 min, P = 0.0497). (e) Simulated time courses show the predicted effect of proteasome inhibition on Ship1 activation. The left panel shows dynamics of Ship1 activation for I = 60 min, and the right panel shows dynamics of activation for I = 240 min. Ship1 is robustly re-activated in both cases (f) Ship1 activation upon DF3 stimulation following the indicated I values, with proteasome inhibitor (MG132, red squares), or without inhibitor (no inhibitor, blue diamonds), as measured by a malachite green assay with immunoprecipitated Ship1. Data are presented as mean ± SD (n = 3), t test comparison of % PIP3 conversion values of untreated cells compared to that of MG132-treated cells (****P < 0.0001; ***P < 0.001; **P < 0.01; I = 5 min, P = 0.026; I = 60 min, P = 0.0058; I = 120 min, P = 1.12 × 10−5; I = 240 min, P = 8.01 × 10−5). (g) Simulated levels of Ship1 activity, measured as the number of copies of activated Ship1, in the presence (red squares) or absence (blue diamonds) of proteasome inhibition, at the same time points as shown in panel f.

Similar articles

Cited by

References

    1. Kraft S, Kinet JP. New developments in FcepsilonRI regulation, function and inhibition. Nat Rev Immunol. 2007;7:365–378. doi: 10.1038/nri2072. - DOI - PubMed
    1. Barbu AE, Pecht I. Desensitization of mast cells’ secretory response to an immuno-receptor stimulus. Immunology letters. 2005;100:78–87. doi: 10.1016/j.imlet.2005.06.009. - DOI - PubMed
    1. Weetall M, Holowka D, Baird B. Heterologous desensitization of the high affinity receptor for IgE (Fc epsilon R1) on RBL cells. Journal of immunology (Baltimore, Md. : 1950) 1993;150:4072–4083. - PubMed
    1. Mendoza GR, Minagawa K. Subthreshold and suboptimal desensitization human basophils. I. Kinetics of decay of releasability. International archives of allergy and applied immunology. 1982;68:101–107. doi: 10.1159/000233076. - DOI - PubMed
    1. Mendoza GR, Minagawa K. Subthreshold and suboptimal desensitization of human basophils. II. Nonspecificity and irreversibility of desensitization. International archives of allergy and applied immunology. 1982;69:282–284. doi: 10.1159/000233185. - DOI - PubMed

MeSH terms

LinkOut - more resources