. 2017 Nov 14;7(1):15511.
doi: 10.1038/s41598-017-15840-5.

Targeting a non-oncogene addiction to the ATR/CHK1 axis for the treatment of small cell lung cancer

Affiliations

Targeting a non-oncogene addiction to the ATR/CHK1 axis for the treatment of small cell lung cancer

Fabian Doerr et al. Sci Rep. .

Abstract

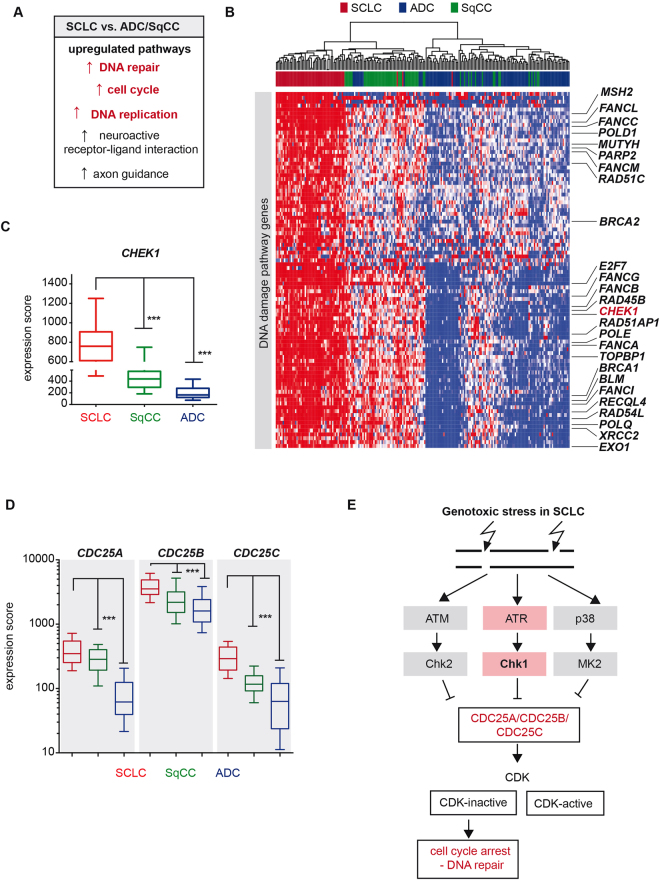
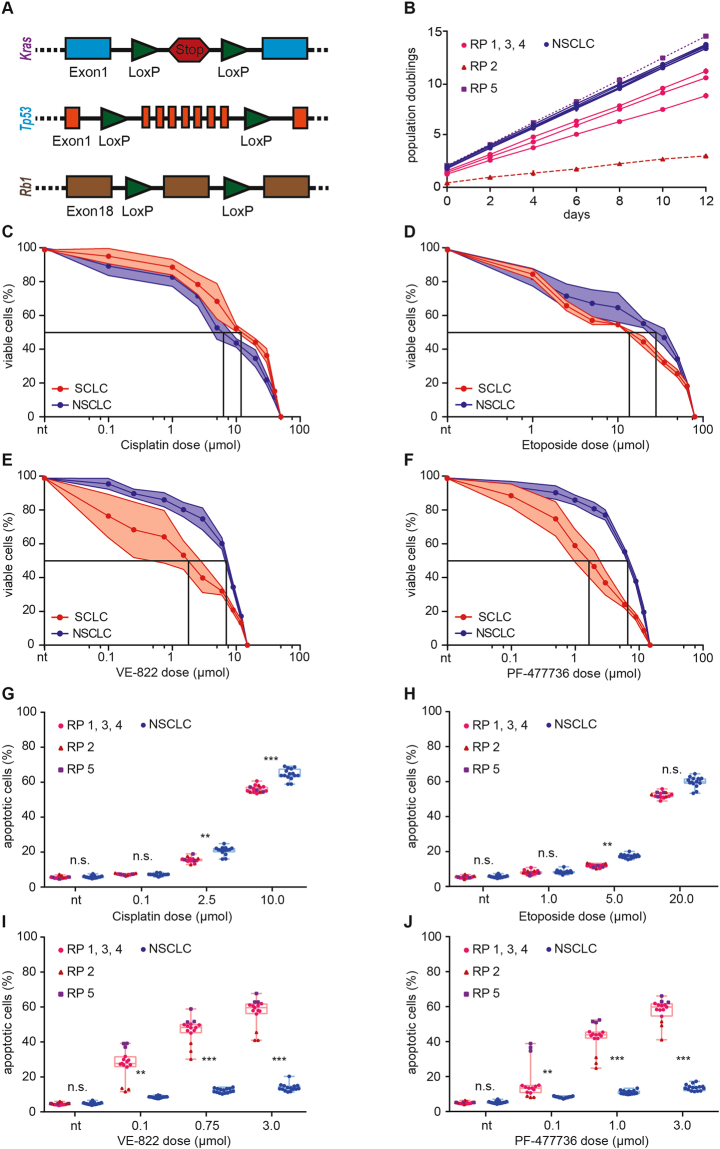
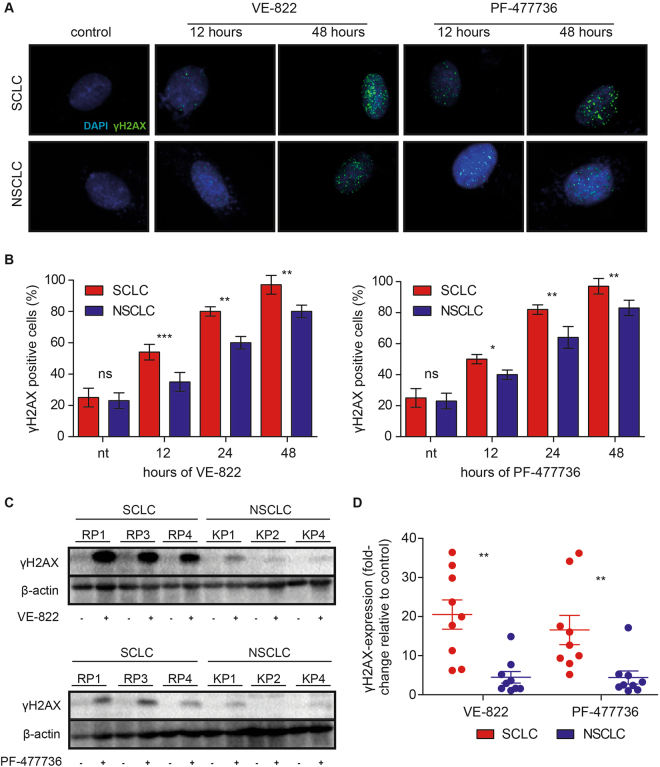
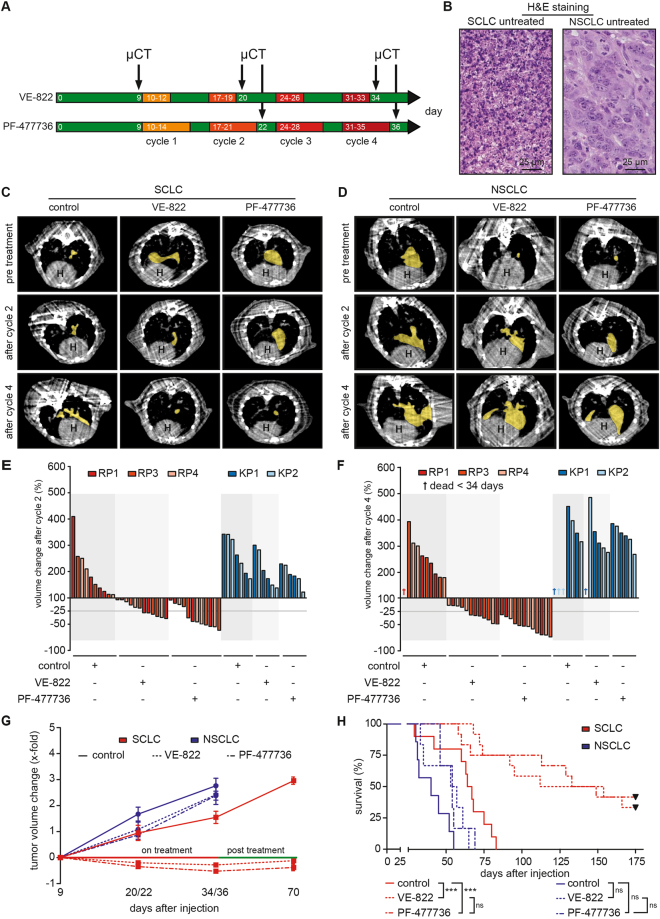
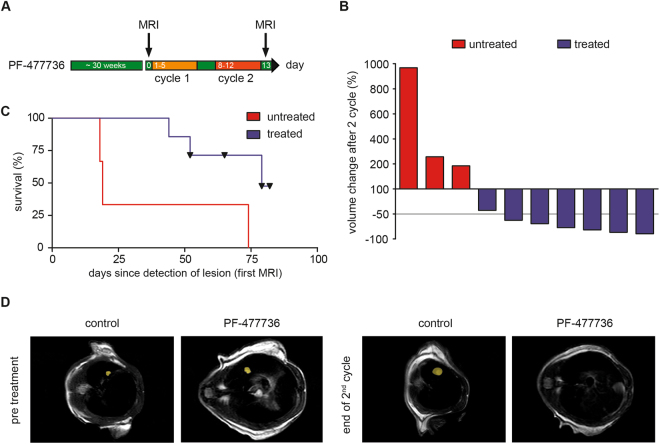
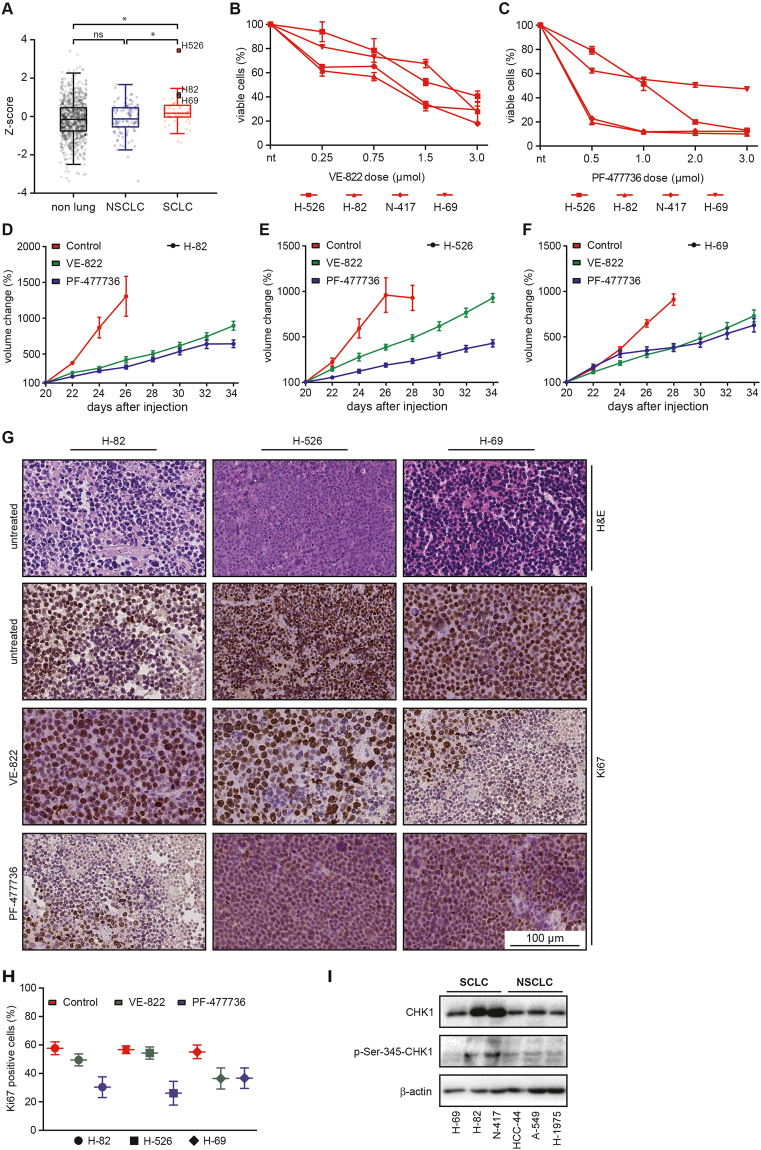
Small cell lung cancer (SCLC) is a difficult to treat subtype of lung cancer. One of the hallmarks of SCLC is its almost uniform chemotherapy sensitivity. However, chemotherapy response is typically transient and patients frequently succumb to SCLC within a year following diagnosis. We performed a transcriptome analysis of the major human lung cancer entities. We show a significant overexpression of genes involved in the DNA damage response, specifically in SCLC. Particularly CHEK1, which encodes for the cell cycle checkpoint kinase CHK1, is significantly overexpressed in SCLC, compared to lung adenocarcinoma. In line with uncontrolled cell cycle progression in SCLC, we find that CDC25A, B and C mRNAs are expressed at significantly higher levels in SCLC, compared to lung adenocarcinoma. We next profiled the efficacy of compounds targeting CHK1 and ATR. Both, ATR- and CHK1 inhibitors induce genotoxic damage and apoptosis in human and murine SCLC cell lines, but not in lung adenocarcinoma cells. We further demonstrate that murine SCLC tumors were highly sensitive to ATR- and CHK1 inhibitors, while Kras G12D -driven murine lung adenocarcinomas were resistant against these compounds and displayed continued growth under therapy. Altogether, our data indicate that SCLC displays an actionable dependence on ATR/CHK1-mediated cell cycle checkpoints.


Conflict of interest statement

H.C.R. received consulting and lecture fees from Abbvie, Astra-Zeneca, Vertex and Merck. R.K.T. is a founder of NEO New Oncology GmbH, now part of Siemens Healthcare. R.K.T. received consulting and lecture fees (Merck, Roche, Lilly, Boehringer Ingelheim, Astra-Zeneca, Daiichi-Sankyo, MSD, NEO New Oncology, Puma, Clovis). The remaining authors declare no competing financial interest.

Figures

Figure 1
Figure 1
CHEK1 expression in SCLC. (A) Cellular and biological pathways, which are significantly up-regulated in SCLC, compared to lung adenocarcinomas and squamous cell carcinomas. (B) Expression profiles of DDR related genes in SCLC and other lung cancer subtypes is represented as a heatmap with red and blue indicating high and low expression, respectively. Tumor samples are arranged from the left to right and sorted according to their expression values. The histological annotation of the lung tumor samples is provided in the color panel above. (C) CHEK1 expression is displayed as a box plot. Whiskers indicate the 10–90 percentile. *** < 0.0001 (Mann Whitney test). (D) CDC25A, CDC25B and CDC25C expression is displayed as a box plot. Whiskers indicate the 10–90 percentile. *** < 0.0001 (Mann Whitney test). The histological annotation of the lung tumor samples is provided in the color panel below. (E) Simplified schematic representation of kinase-mediated cell cycle checkpoint signaling.
Figure 2
Figure 2
Murine SCLC cell lines are sensitive to ATR- and CHK1 inhibition. (A) Schematic representation of the different alleles used in the mouse models: Two groups were designed. Rb1 fl/fl ;Tp53 fl/fl (RP) and Kras LSL.G12D/wt ;Tp53 fl/fl (KP) animals. (B) Population doubling time of the five murine RP (SCLC) cell lines and five murine KP (NSCLC) cell lines used in this study. The duration of each passage was 48 hours. KP cell lines displayed rapid proliferation with a minimal variation between the individual cell lines. Proliferation of RP cell lines was more variable. RP1, 3 and 4 displayed comparable proliferation rates. Clone RP2 displayed slow growth kinetics. Clone RP5 showed a high proliferation rate. (CF) Intracellular ATP was measured as a surrogate marker for cell viability. Average values of three independent experiments are shown. (C) Assessment of cisplatin sensitivity in KP and RP cell lines. KP GI50 = 6.7 µMol; RP GI50 = 12.3 µMol). (D) Assessment of cisplatin sensitivity in KP and RP cell lines. RP GI50 = 14.3 µMol; KP GI50 = 29.1 µMol. (E) RP cell lines were significantly (p < 0.0001) more sensitive to ATR inhibition (VE-822), than KP cell lines. RP GI50 = 1.9 µMol; KP GI50 = 7.2 µMol. (F) RP cell lines were significantly (p < 0.0001) more sensitive to CHK1 inhibition (PF-477736), than KP cell lines. RP GI50 = 1.7 µMol; KP GI50 = 6.9 µMol. (GJ) Flow cytometry-based apoptosis measurements. Cells were treated for 48 hours with the indicated drugs at the indicated doses. Apoptosis was assessed by quantification of the Annexin-V/PI double-positive population. Average values of three independent experiments are shown. (GH) RP and KP cell lines displayed a similar degree of apoptotic cell death in response to cisplatin and etoposide. (IJ) Highly significant differences in apoptotic cell death were observed between RP and KP cell lines in response to VE-822 and PF-477736. RP2 was less sensitive to both treatments, compared to RP1, 3 and 4. RP5 displayed the most pronounced sensitivity. Significance was determined using an unpaired t test. Levels of significance were *p < 0.05; **p < 0.01; ***p < 0.001.
Figure 3
Figure 3
ATR- and CHK1 inhibition induce genotoxic damage in murine SCLC cell lines. (A and B) KP1–5 and RP1, 3 and 4 cell lines were stained with an antibody detecting γH2AX and a DAPI counterstain. VE-822 and PF-477736 induced genotoxic damage in all RP and in KP cell lines. (A) Representative immunofluorescence images are shown. Displayed are images derived from RP1 (SCLC) and KP1 (NSCLC) cell lines that were treated for 12 and 48 hours with VE-822 and PF-477736. The controls were exposed to vehicle solution for 48 hours. (B) The percentage of γH2AX-positive cells was quantified. VE-822 (0.75 µM) and PF-477736 (1.0 µM) induced significantly more DNA damage in RP, than in KP cell lines following 12, 24 and 48 hours of drug exposure. (C-D) Immunoblot-based assessment of γH2AX induction in KP1, 2, 4 and RP1, 3 and 4 cell lines after a vehicle-, VE-822- (0.75 µM)- or PF-477736 (1.0 µM) treatment (48 hours). β-actin was used as a loading control. (C) Representative immunoblot images are shown for the indicated RP- and KP cell lines following the indicated treatment regimens. (D) The intensity of the enhanced chemiluminescence signal was quantified, using densitometry. RP cell lines displayed a significantly stronger γH2AX signal, than KP cell lines, following VE-822 and PF-477736 treatment.
Figure 4
Figure 4
ATR- and CHK1 inhibition displays therapeutic efficacy in SCLC tumors, in vivo. (A) SCLC and NSCLC tumor formation was assessed by µCT imaging 9 days after intrathoracic injection of RP1, 3, 4 or KP1, 2 cells. For each tumor entity, mice were randomly allocated to a control cohort (not shown in (A)) and the indicated treatment cohorts. Four cycles of treatment were applied. The VE-822-treated cohort received treatment weekly for three consecutive days at a dose of 30 mg/kg by oral gavage. The PF-477736-treated cohort received treatment weekly for five consecutive days at a dose of 20 mg/kg by intraperitoneal injection. Tumor volume changes were monitored by µCT imaging at the end of the second and the forth cycle, as indicated. (B) Representative images of H&E staining form untreated mice bearing SCLC or NSCLC tumors from the allograft model. Scale bar 25 μm. (CD) Tumor volume was assessed by μCT imaging for treated and untreated mice. Imaging revealed SCLC tumor shrinkage in response to VE-822 and PF-477736 treatment after two and four cycles of treatment. Mice bearing NSCLC tumors displayed continued tumor growth in response to both compounds. Representative μCT images of both, SCLC- or NSCLC-bearing mice are shown pre-treatment and after two and four cycles. The yellow area indicates individual tumor lesions. The heart is indicated (H). (EF) Tumor volume changes in response to the indicated treatments were normalized to baseline tumor volumes, assessed prior to therapy initiation. NSCLC tumors grew faster, than SCLC tumors. Vehicle-treated mice showed continuous tumor growth throughout the observation period. SCLC tumors displayed significant tumor shrinkage after cycle 2 and 4 in response to VE-822 and PF-47736 treatment. NSCLC tumors did not respond to either of the treatments. Three mice from the NSCLC control cohort and one animal from the VE-822-treated NSCLC cohort died before completion of cycle four. (G) VE-822- and PF-477736 treatment led to tumor volume reduction in SCLC, but not in NSCLC tumors. Vehicle-treated mice showed continuous tumor growth throughout the observation period. No NSCLC animal survived the post treatment phase until day 70. VE-822- and PF-477736-treated SCLC tumors remained stable after completion of treatment. (H) Survival curves of all mice (displayed in Kaplan-Meier format) were calculated from tumor injection up to day 175 and compared by log-rank (Mantle Cox) test. VE-822 and PF-477736 treatment increased overall survival in mice bearing SCLC tumors significantly, compared to the vehicle-treated control group. VE-822- and PF-477736-treated NSCLC-bearing mice showed only a mild survival benefit, compared to their vehicle-treated counterparts.
Figure 5
Figure 5
CHK1 inhibition displays therapeutic efficacy in autochthonous SCLC tumors, in vivo. (A) SCLC tumor formation was assessed by MRT. Mice were randomly allocated to a control cohort (not shown in (A)) and the indicated treatment cohort. Two cycles of treatment were applied. The PF-477736-treated cohort received treatment weekly for five consecutive days at a dose of 20 mg/kg by intraperitoneal injection. Tumor volume changes were monitored by MRT imaging at the end of the second cycle, as indicated. (B) Tumor volumes were assessed by MRT imaging for PF-477736-treated and vehicle-treated mice. Imaging revealed SCLC tumor shrinkage in response to PF-477736 treatment after two cycles of treatment. Vehicle-treated animals displayed continued tumor growth. Tumor volume changes in response to the indicated treatments were normalized to baseline tumor volumes, assessed prior to therapy initiation. (C) Survival curves displayed in Kaplan-Meier format were calculated from initial tumor manifestation and compared by log-rank (Mantle Cox) test. PF-477736 treatment increased overall survival in mice bearing autochthonous SCLC tumors, compared to the vehicle-treated control group. (D) Representative MRT images of SCLC-bearing mice are shown pre-treatment and after two cycles of PF-477736 exposure. The yellow area indicates individual tumor lesions.
Figure 6
Figure 6
Human SCLC cells are sensitive against ATR- and CHK1 inhibitors in a xenograft model, in vivo. (A) Displayed are the relative CHEK1 mRNA expression levels of 970 human cancer cell lines, including 61 SCLC and 109 NSCLC cell lines, as well as 800 non-lung cancer cell lines. (B–C) Intracellular ATP levels of four different human SCLC cell lines were measured to assess cell viability. Average values of three independent experiments are shown. VE-822- or PF-477736 treatment at the indicated dosages induced substantial viability reduction within 48 hours of drug exposure in four human SCLC cell lines (H-526, H-82, N-417, H-69). (D–F) Mice bearing xenograft tumors derived from three human SCLC cell lines (H-82, H526, H-69) were treated with VE-822, PF-477736 or vehicle solution. Tumor volumes were assessed by longitudinal caliper measurements every second day following treatment initiation. All vehicle-treated xenograft tumors displayed rapid growth. VE-822 and PF-477736 treatment significantly repressed tumor growth. (I) Immunoblot experiments using antibodies detecting total CHK1 (top panel), p-Ser-345-CHK1 (middle panel) and β-actin, which served as a loading control. Lysates derived from SCLC cell lines are loaded in the left lanes, while NSCLC lysates are loaded on the right side.

Similar articles

Cited by

References

    1. Subramanian J, Govindan R. Chemotherapy: continued lack of progress in SCLC. Nat Rev Clin Oncol. 2010;7:77–78. doi: 10.1038/nrclinonc.2009.223. - DOI - PubMed
    1. George J, et al. Comprehensive genomic profiles of small cell lung cancer. Nature. 2015;524:47–53. doi: 10.1038/nature14664. - DOI - PMC - PubMed
    1. Peifer M, et al. Integrative genome analyses identify key somatic driver mutations of small-cell lung cancer. Nat Genet. 2012;44:1104–1110. doi: 10.1038/ng.2396. - DOI - PMC - PubMed
    1. Fruh M, et al. Small-cell lung cancer (SCLC): ESMO Clinical Practice Guidelines for diagnosis, treatment and follow-up. Ann Oncol. 2013;24(Suppl 6):vi99–105. doi: 10.1093/annonc/mdt178. - DOI - PubMed
    1. Saunders LR, et al. A DLL3-targeted antibody-drug conjugate eradicates high-grade pulmonary neuroendocrine tumor-initiating cells in vivo. Sci Transl Med. 2015;7:302ra136. doi: 10.1126/scitranslmed.aac9459. - DOI - PMC - PubMed

MeSH terms