. 2017 Nov 14;7(1):15495.
doi: 10.1038/s41598-017-15707-9.

Visualizing the GPCR Network: Classification and Evolution

Affiliations

Visualizing the GPCR Network: Classification and Evolution

Geng-Ming Hu et al. Sci Rep. .

Abstract

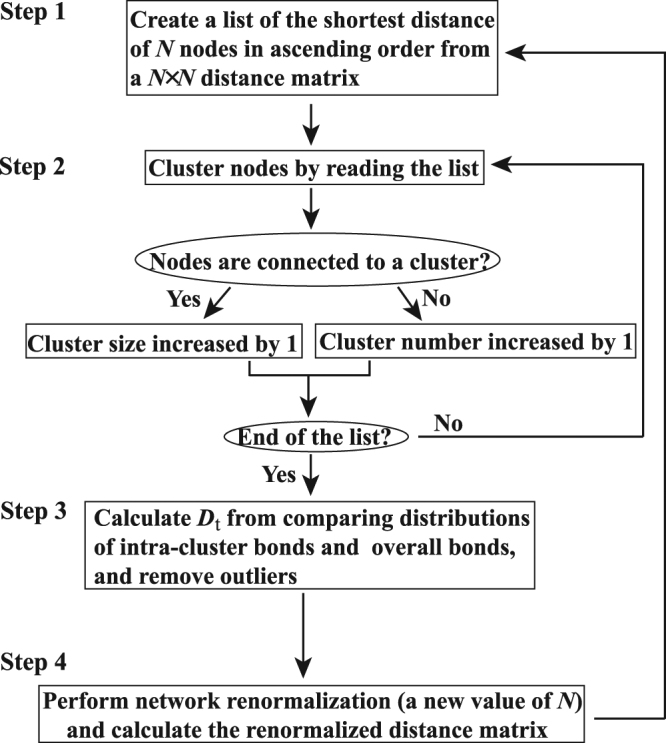
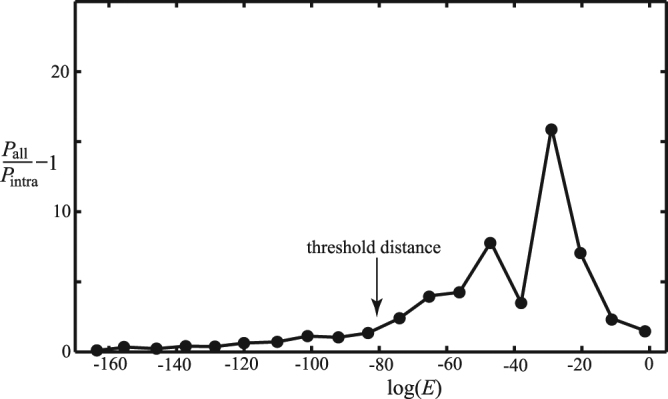
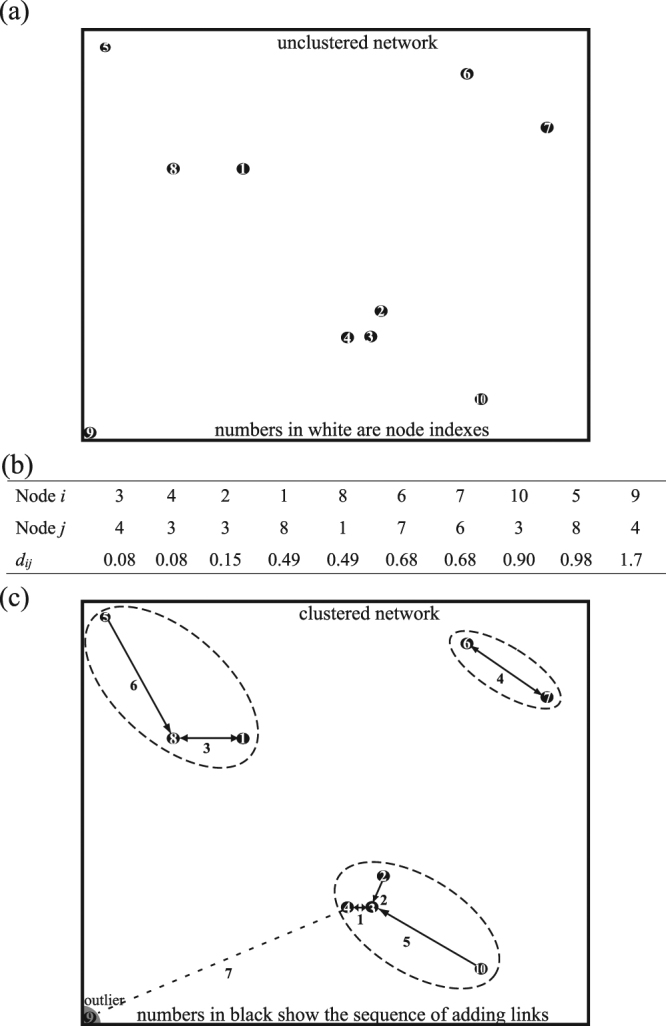
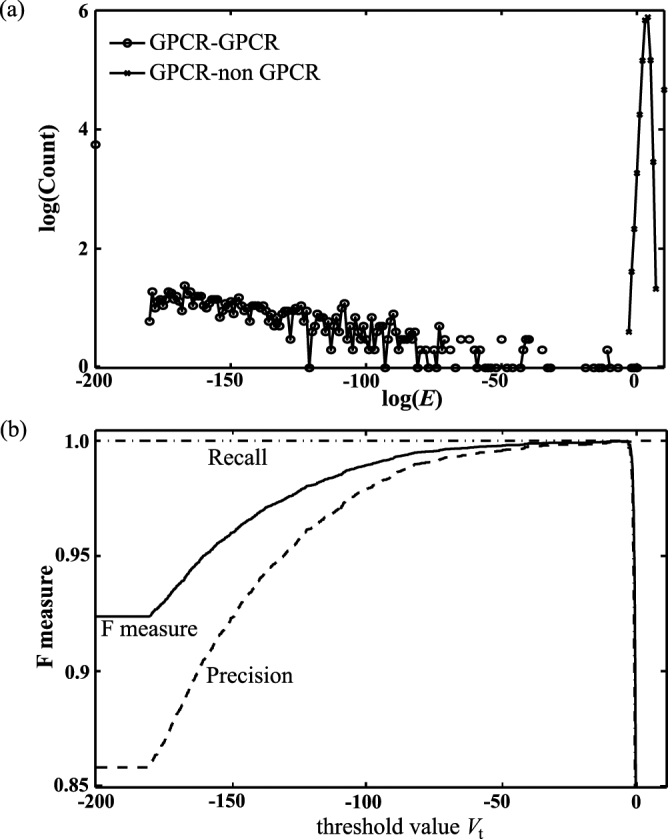
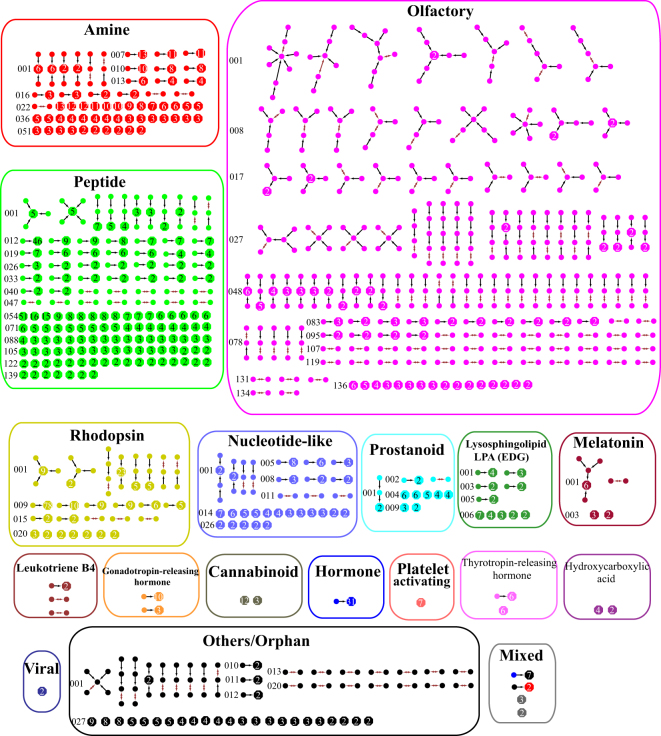
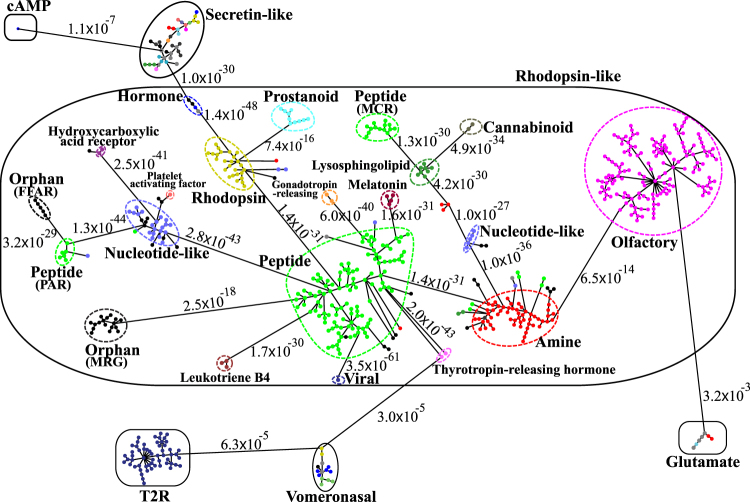
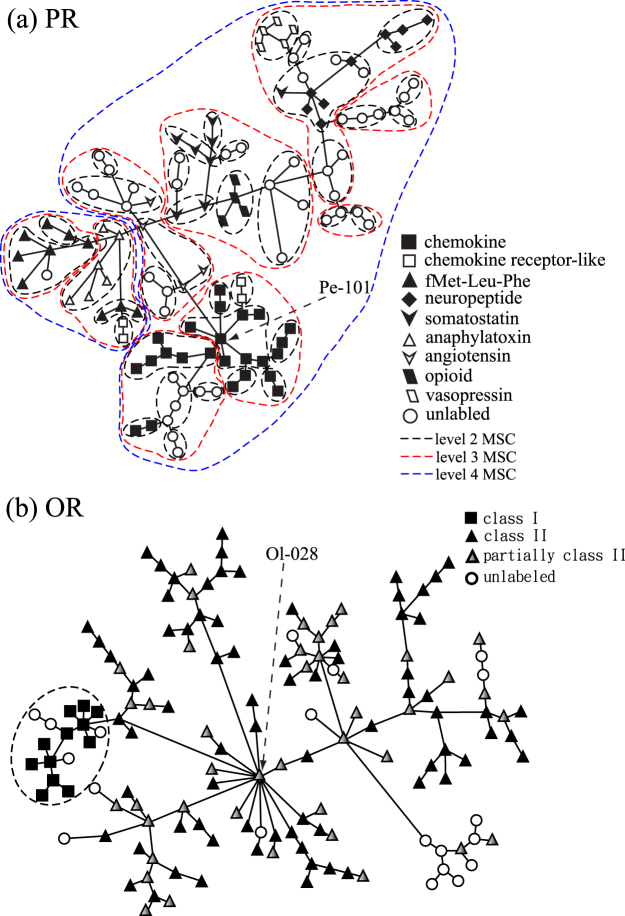
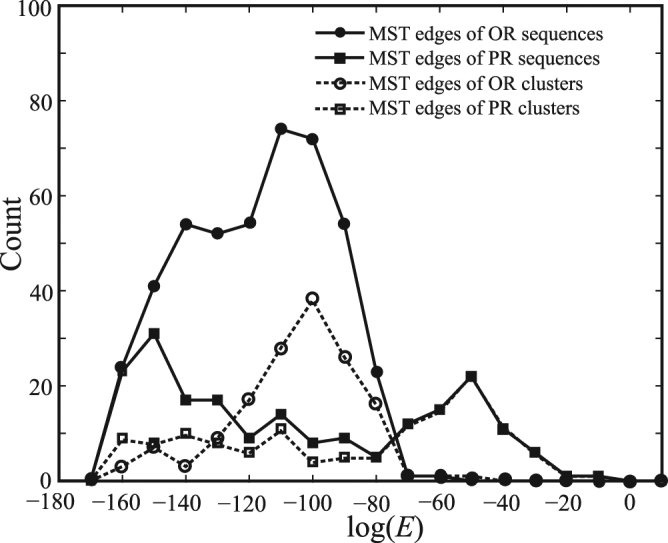
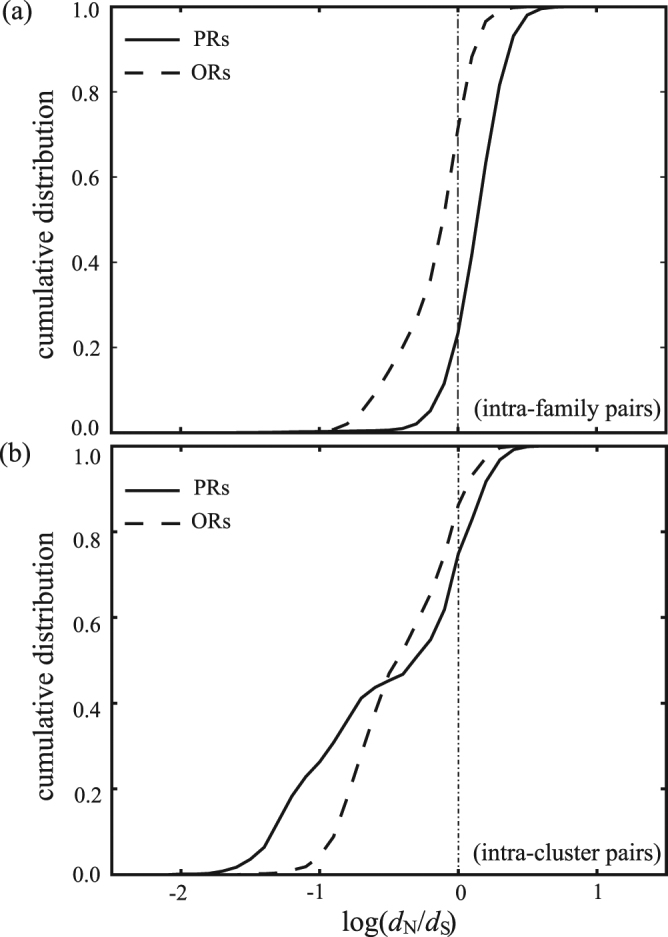
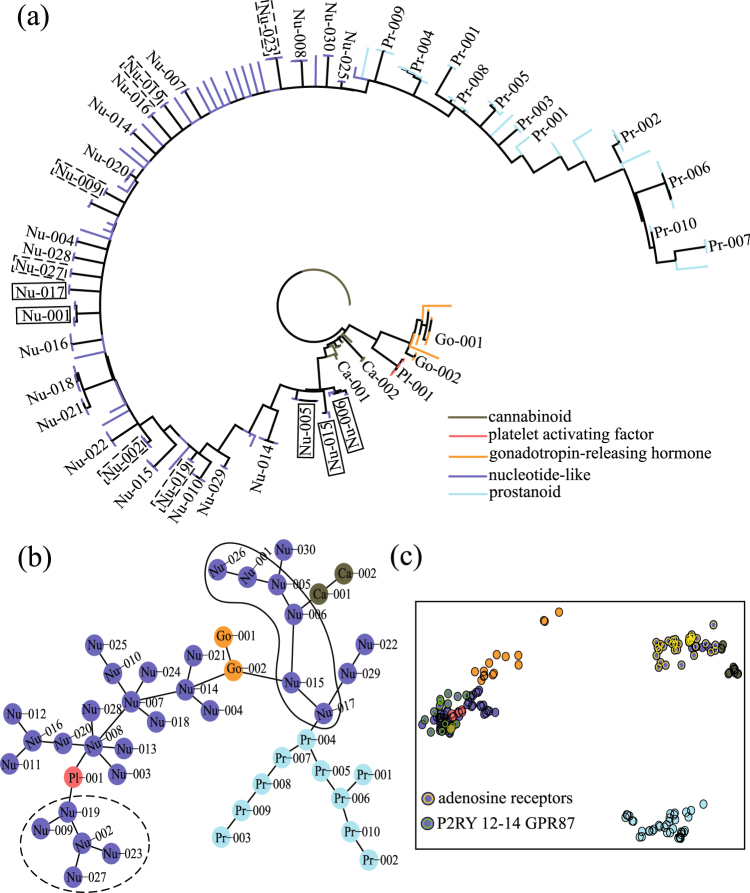
In this study, we delineate an unsupervised clustering algorithm, minimum span clustering (MSC), and apply it to detect G-protein coupled receptor (GPCR) sequences and to study the GPCR network using a base dataset of 2770 GPCR and 652 non-GPCR sequences. High detection accuracy can be achieved with a proper dataset. The clustering results of GPCRs derived from MSC show a strong correlation between their sequences and functions. By comparing our level 1 MSC results with the GPCRdb classification, the consistency is 87.9% for the fourth level of GPCRdb, 89.2% for the third level, 98.4% for the second level, and 100% for the top level (the lowest resolution level of GPCRdb). The MSC results of GPCRs can be well explained by estimating the selective pressure of GPCRs, as exemplified by investigating the largest two subfamilies, peptide receptors (PRs) and olfactory receptors (ORs), in class A GPCRs. PRs are decomposed into three groups due to a positive selective pressure, whilst ORs remain as a single group due to a negative selective pressure. Finally, we construct and compare phylogenetic trees using distance-based and character-based methods, a combination of which could convey more comprehensive information about the evolution of GPCRs.


Conflict of interest statement

The authors declare that they have no competing interests.

Figures

Figure 1
Figure 1
Flowchart of the unsupervised, multi-level MSC network clustering algorithm.
Figure 2
Figure 2
The relative difference in edge length distributions of the minimum spanning tree diagram and of the first level MSC clusters in the GPCR network. The length distribution of the minimum spanning tree includes both intra- and inter-cluster edges, whilst that of MSC clusters only includes intra-cluster edges. The difference is contributed from inter-cluster edges. The threshold distance between clusters is chosen to be 10−80, where the value of P all/P intra −1 is nonzero and increases sharply.
Figure 3
Figure 3
A demonstrated example of implementing MSC for a simple network of 10 nodes: (a) the un-clustered network, (b) the list of the shortest distance pairs for network nodes, and (c) the clustered network after implementing MSC.
Figure 4
Figure 4
The distance distribution between GPCR and non-GPCR sequences and the minimum distance distribution of a GPCR sequence to other GPCR sequences in the base dataset (a), and the F measure for the detection of GPCR sequences based on the MSC results of the base dataset as a function of the threshold value V t (b). Here the F measure is defined as F = 2·precision·recall/(precision + recall).
Figure 5
Figure 5
The minimum spanning tree diagrams of 503 level 1 MSC clusters in the rhodopsin-like class. Here each circle represents a GPCR sequence, and each hexagon represents a number of sequences whose mutual E value is zero (the number is shown in the hexagon). The color of circles or hexagons is chosen based on their functional classification in the GPCRdb.
Figure 6
Figure 6
The minimum spanning tree diagram of the 620 level 1 MSC clusters for the GPCR network in the target dataset. Here each circle represents an MSC cluster the color of which is according to the color scheme in Figs 5 and S1. The length of edges is not proportional to their distance, but the distances between subfamilies and classes are labeled to see their sequence similarity.
Figure 7
Figure 7
The minimum spanning tree diagrams of PRs’ main group (a) and ORs (b) in the target dataset. Here each node represents a level 1 MSC cluster. In (a), the shape of nodes designates which ligand they bind. Dashed loops in black, red, or blue show the MSC clustering of PRs at level 2, level 3, or level 4, respectively. In (b), the shape of nodes labels receptor clusters belonging to class I, class II, partially class II, or others.
Figure 8
Figure 8
The distributions of sequence-sequence and cluster-cluster distances for PRs and ORs in a minimum spanning tree diagram.
Figure 9
Figure 9
Cumulative distribution of the d N/d S ratio for intra-subfamily sequence pairs (a) and for intra-cluster sequence pairs (b) of PRs and ORs. Negative selection is implied for d N/d S < 1, while positive selection is implied for d N/d S > 1.
Figure 10
Figure 10
Phylogenetic trees of 185 GPCR sequences using both character-based (a) and distance-based methods (b). The data points in (c) show the location of these sequences on a two-dimensional projection by MDS. The branching tree diagram in (a) was constructed using the maximum likelihood method and displayed with the polar tree layout. The minimum spanning tree diagram in (b) was displayed by viewing each level 1 MSC cluster as a node.

References

    1. Eisenberg D, Marcotte EM, Xenarios I, Yeates TO. Protein function in the post-genomic era. Nature. 2000;405:823–826. doi: 10.1038/35015694. - DOI - PubMed
    1. Alberts B. The cell as a collection of protein machines: Preparing the next generation of molecular biologists. Cell. 1998;92:291–294. doi: 10.1016/S0092-8674(00)80922-8. - DOI - PubMed
    1. Baldwin JM. Structure and function of receptors coupled to G proteins. Current Opinion in Cell Biology. 1994;6:180–190. doi: 10.1016/0955-0674(94)90134-1. - DOI - PubMed
    1. Schonenbach NS, Hussain S, O’Malley MA. Structure and function of G protein-coupled receptor oligomers: implications for drug discovery. Wiley Interdisciplinary Reviews: Nanomedicine and Nanobiotechnology. 2015;7:408–427. - PubMed
    1. Latek D, Modzelewska A, Trzaskowski B, Palczewski K, Filipek S. G protein-coupled receptors — recent advances. Acta biochimica Polonica. 2012;59:515–529. - PMC - PubMed

Publication types

Substances

LinkOut - more resources