

Identifying Novel Glioma-Associated Noncoding RNAs by Their Expression Profiles
- PMID: 29138748
- PMCID: PMC5613369
- DOI: 10.1155/2017/2312318
Identifying Novel Glioma-Associated Noncoding RNAs by Their Expression Profiles
Abstract
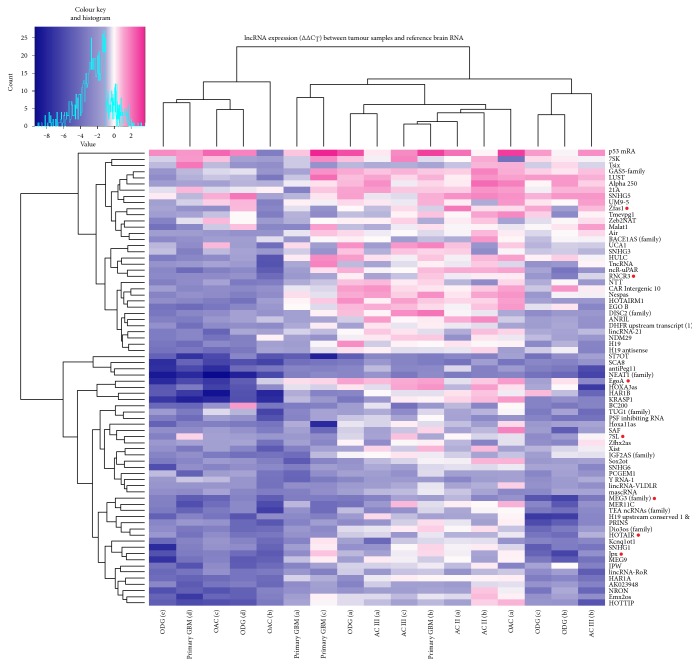
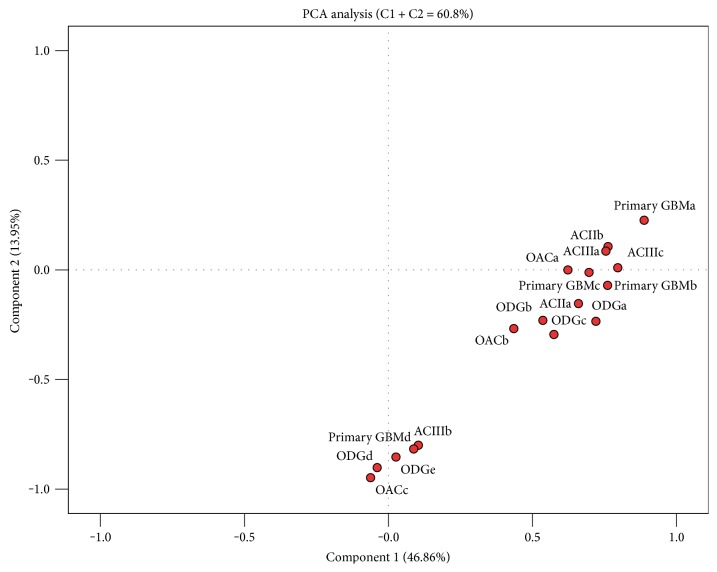
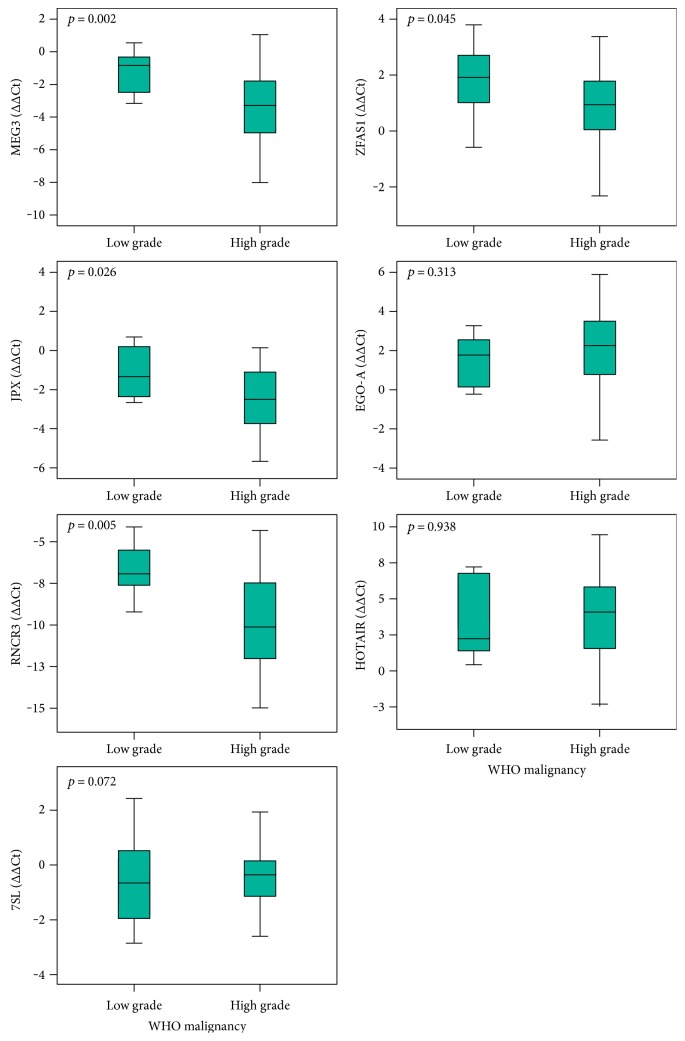
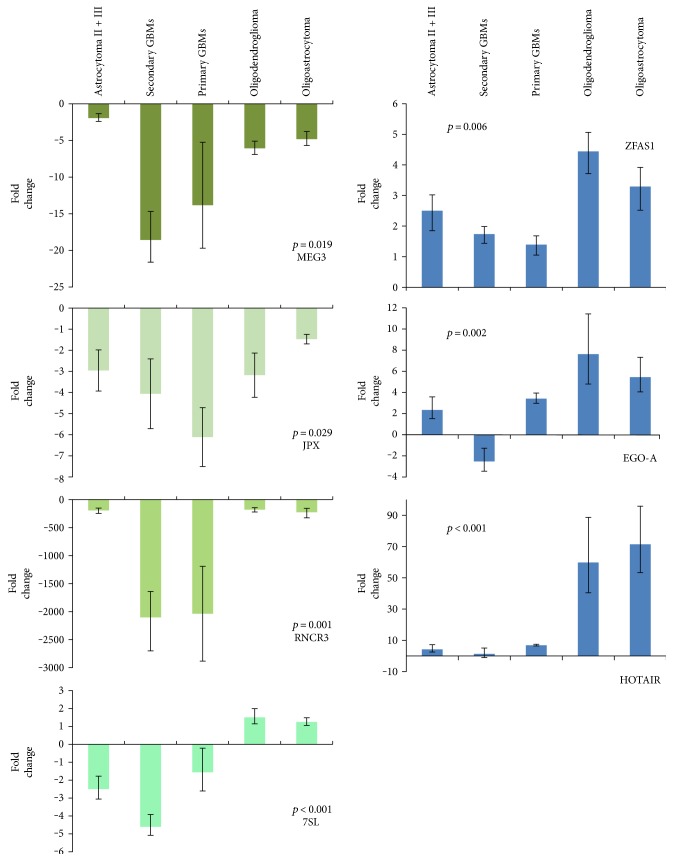
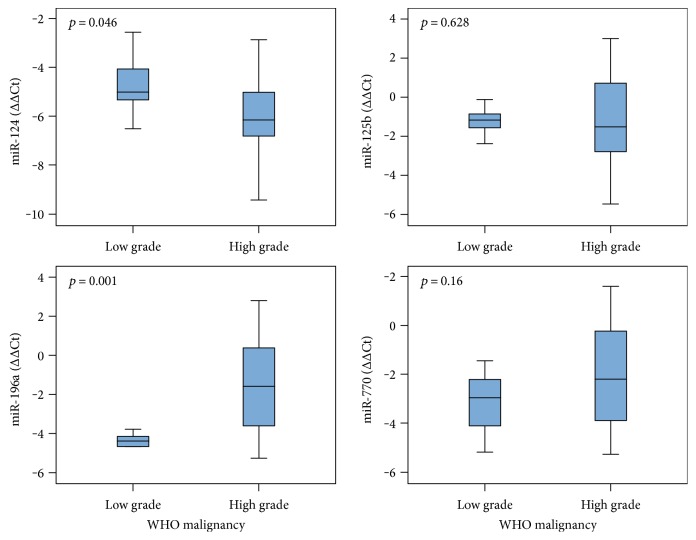
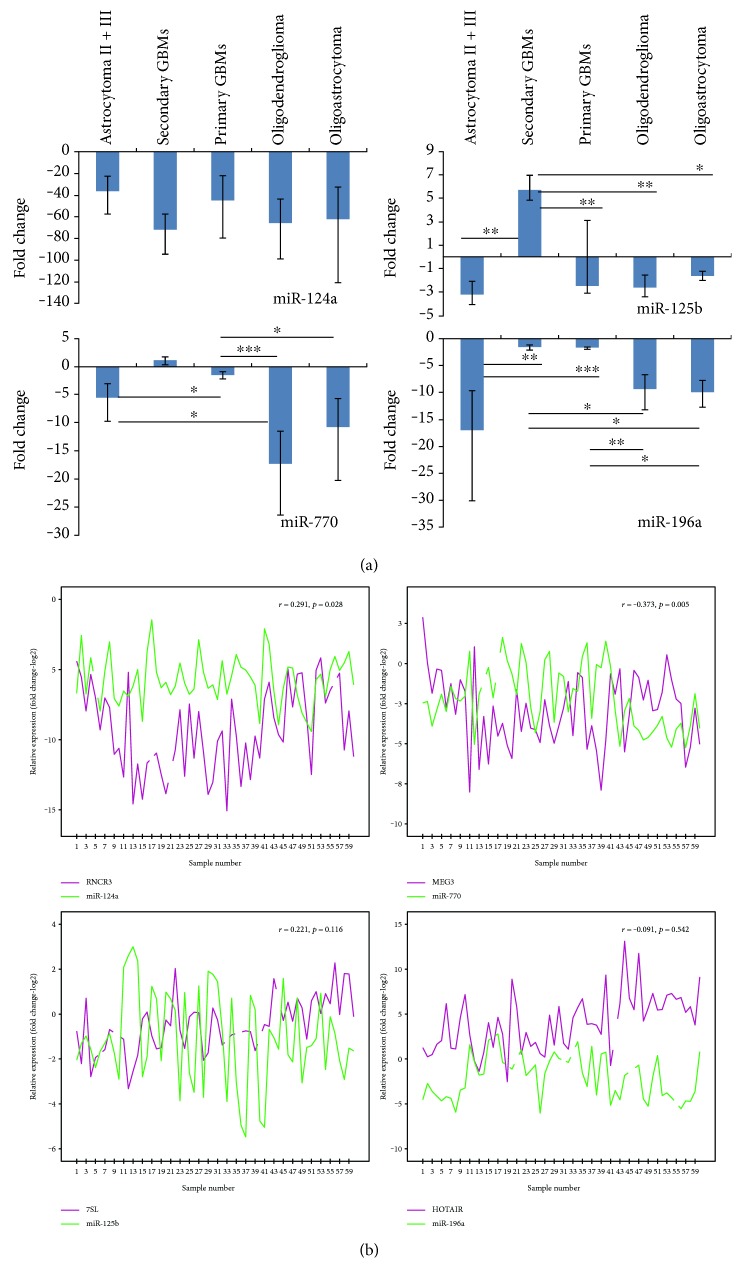
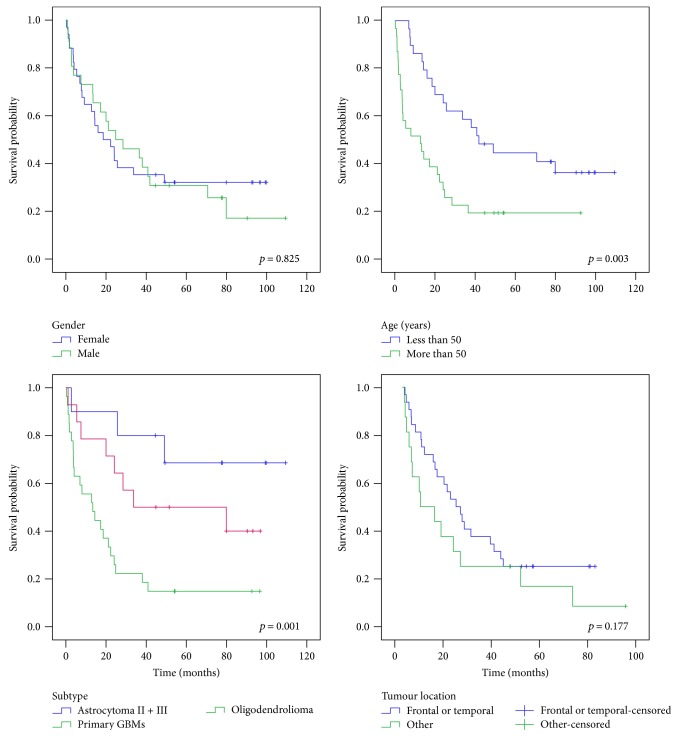
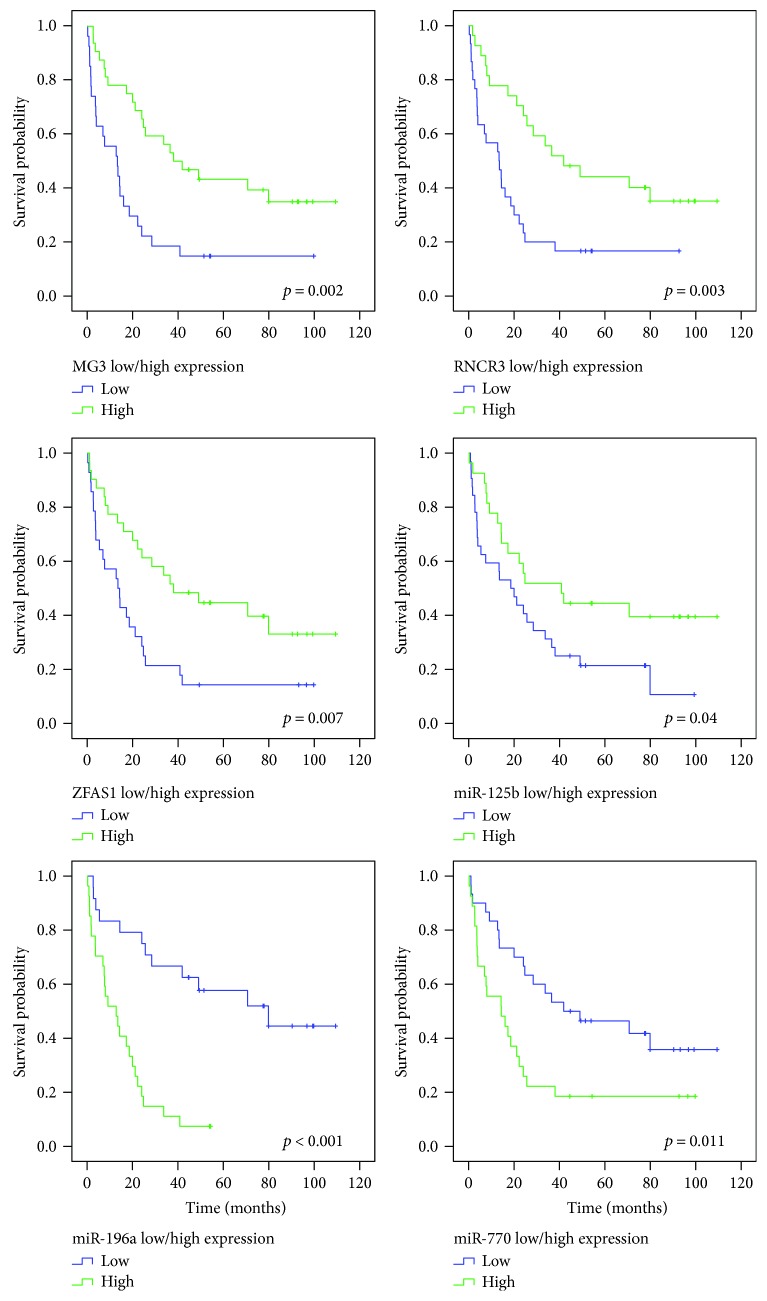
Long noncoding RNAs (lncRNAs) and microRNAs (miRNAs) play a significant role in cancer development as regulators of protein-coding genes. Their dysregulation was in some extent already associated with glioma, the most aggressive primary brain tumours in adults. The correct diagnosis and treatment selection due to high tumour heterogeneity might be difficult and inadequate, resulting in poor prognosis. Studies of expression patterns of noncoding RNAs (ncRNAs) could provide useful insight in glioma molecular development. We used the qPCR approach to screen and investigate the expression of lncRNAs that were previously deregulated in other cancer types. The study showed altered expression levels for numerous lncRNAs across histologically different glioma samples. Validation of few lncRNAs showed association of expression levels with histological subtype and/or malignancy grade. We also observed deregulated and subtype-distinctive expression for four lncRNA-associated miRNAs. Expression of few lncRNAs and miRNA was also associated with patients' survival, showing potential prognostic value. Several ncRNAs, some already related to glioma and some, to the best of our knowledge, investigated for the first time, might be of greater importance in glioma molecular development and progression. Finding the subtype-specific lncRNA and/or miRNA expression patterns may contribute additional information for a more objective classification.
Figures
Similar articles
-
Non-coding RNAs: Regulators of glioma cell epithelial-mesenchymal transformation.Pathol Res Pract. 2019 Sep;215(9):152539. doi: 10.1016/j.prp.2019.152539. Epub 2019 Jul 12. Pathol Res Pract. 2019. PMID: 31387808 Review.
-
Interplay Between Long Noncoding RNAs and MicroRNAs in Cancer.Methods Mol Biol. 2018;1819:75-92. doi: 10.1007/978-1-4939-8618-7_4. Methods Mol Biol. 2018. PMID: 30421400
-
Long non-coding RNAs in glioma: functional roles and clinical perspectives.Neurochem Int. 2014 Nov;77:78-85. doi: 10.1016/j.neuint.2014.05.008. Epub 2014 Jun 2. Neurochem Int. 2014. PMID: 24887176 Review.
-
Characterization of Transcriptome Transition Associates Long Noncoding RNAs with Glioma Progression.Mol Ther Nucleic Acids. 2018 Dec 7;13:620-632. doi: 10.1016/j.omtn.2018.10.009. Epub 2018 Oct 24. Mol Ther Nucleic Acids. 2018. PMID: 30472640 Free PMC article.
-
Long non-coding RNA expression profiles predict clinical phenotypes in glioma.Neurobiol Dis. 2012 Oct;48(1):1-8. doi: 10.1016/j.nbd.2012.06.004. Epub 2012 Jun 16. Neurobiol Dis. 2012. PMID: 22709987
Cited by
-
Long Non-Coding RNAs in Diagnosis, Treatment, Prognosis, and Progression of Glioma: A State-of-the-Art Review.Front Oncol. 2021 Jul 12;11:712786. doi: 10.3389/fonc.2021.712786. eCollection 2021. Front Oncol. 2021. PMID: 34322395 Free PMC article. Review.
-
m6A-lncRNA landscape highlights reduced levels of m6A modification in glioblastoma as compared to low-grade glioma.Mol Med. 2025 May 17;31(1):195. doi: 10.1186/s10020-025-01254-x. Mol Med. 2025. PMID: 40382536 Free PMC article.
-
The significance of miR-124 in the diagnosis and prognosis of glioma: A systematic review.PLoS One. 2024 Nov 1;19(11):e0312250. doi: 10.1371/journal.pone.0312250. eCollection 2024. PLoS One. 2024. PMID: 39485747 Free PMC article.
-
LncRNAs associated with glioblastoma: From transcriptional noise to novel regulators with a promising role in therapeutics.Mol Ther Nucleic Acids. 2021 Apr 2;24:728-742. doi: 10.1016/j.omtn.2021.03.018. eCollection 2021 Jun 4. Mol Ther Nucleic Acids. 2021. PMID: 33996255 Free PMC article. Review.
-
LncRNA DGCR5 plays a tumor-suppressive role in glioma via the miR-21/Smad7 and miR-23a/PTEN axes.Aging (Albany NY). 2020 Oct 21;12(20):20285-20307. doi: 10.18632/aging.103800. Epub 2020 Oct 21. Aging (Albany NY). 2020. PMID: 33085646 Free PMC article.
References
LinkOut - more resources
Full Text Sources
Other Literature Sources
