. 2018 Mar;247(3):587-611.
doi: 10.1007/s00425-017-2807-4. Epub 2017 Nov 14.

Carbon source-sink relationship in Arabidopsis thaliana: the role of sucrose transporters

Affiliations

Carbon source-sink relationship in Arabidopsis thaliana: the role of sucrose transporters

Mickaël Durand et al. Planta. 2018 Mar.

Abstract

The regulation of source-to-sink sucrose transport is associated with AtSUC and AtSWEET sucrose transporters' gene expression changes in plants grown hydroponically under different physiological conditions. Source-to-sink transport of sucrose is one of the major determinants of plant growth. Whole-plant carbohydrates' partitioning requires the specific activity of membrane sugar transporters. In Arabidopsis thaliana plants, two families of transporters are involved in sucrose transport: AtSUCs and AtSWEETs. This study is focused on the comparison of sucrose transporter gene expression, soluble sugar and starch levels and long distance sucrose transport, in leaves and sink organs (mainly roots) in different physiological conditions (along the plant life cycle, during a diel cycle, and during an osmotic stress) in plants grown hydroponically. In leaves, the AtSUC2, AtSWEET11, and 12 genes known to be involved in phloem loading were highly expressed when sucrose export was high and reduced during osmotic stress. In roots, AtSUC1 was highly expressed and its expression profile in the different conditions tested suggests that it may play a role in sucrose unloading in roots and in root growth. The SWEET transporter genes AtSWEET12, 13, and 15 were found expressed in all organs at all stages studied, while differential expression was noticed for AtSWEET14 in roots, stems, and siliques and AtSWEET9, 10 expressions were only detected in stems and siliques. A role for these transporters in carbohydrate partitioning in different source-sink status is proposed, with a specific attention on carbon demand in roots. During development, despite trophic competition with others sinks, roots remained a significant sink, but during osmotic stress, the amount of translocated [U-14C]-sucrose decreased for rosettes and roots. Altogether, these results suggest that source-sink relationship may be linked with the regulation of sucrose transporter gene expression.

Keywords: Diel cycle; Full life development; Hydroponic culture; Osmotic stress; Roots; Sugar transporter gene expression.


Figures
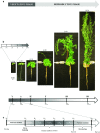
Fig. 1
Fig. 1
Design of the three experimental protocols used to study sucrose transporter genes expression and sugar allocation in source and sinks organs of A. thaliana grown hydroponically. Photographs of plants (A. thaliana ecotype ‘Columbia’) at the six principal growth stages in the hydroponic system: Y young stage, D + 31 after sowing; A adult stage, D + 48 after sowing; IE inflorescence stage, D + 60 after sowing; F flowering stage, D + 70 after sowing; SR silique ripening, D + 98 after sowing and SH silique harvest, D + 125 after sowing. The different stages are defined as described in Boyes et al. (2001) and indicated on the top of each photograph (a). Y, A, and IE correspond to the vegetative phase, and F, SR, and SH correspond to the reproductive phase of A. thaliana plant development. Plants were harvested at each time point to perform the ‘developmental experiment’. Schematic representation of the 24-h cycle protocol applied on 31 day-old plants (young stage, Y) (b). Roots and rosettes of plants were harvested successively at 9, 13, 17, 21, 1, and 5 h (light 9–19 h, dark, 19–9 h). Schematic representation of the osmotic stress protocol applied (c). After sowing, stressed plants grew in nutrient medium during 24 days. Osmotic stress was applied by gradual addition of polyethylene glycol (+ 0.5% PEG) in nutrient medium every 2 days, from D + 24 to D + 32, until the medium reached 2.5% PEG. During the rehydration phase starting at D + 35, medium with PEG was removed and control medium was added. At the end of the stress (D + 35) and after the rehydration phase (D + 42), control and stressed plants were harvested (n = 5) for further analyses
Fig. 2
Fig. 2
Sugar content and expression pattern of sucrose transporter AtSUC and AtSWEET genes in leaves during a 24-h cycle in 31-day-old A. thaliana plants grown hydroponically. Measurements of sucrose (black), glucose (white), fructose (light grey) (a), and starch contents in leaves (b). Data are expressed as the mean of measures obtained from pools of five plants. Relative expression of AtSUC14 (c) and of AtSWEET11, 12, 13, and 15 (d) was determined by RT-qPCR. Data are expressed as normalized expression (no unit) to the reference gene At5g12240 expression level (Czechowski et al. 2005) and are the mean of measures obtained from pools of five plants
Fig. 3
Fig. 3
Sugar content and expression pattern of sucrose transporter AtSUC and AtSWEET genes in roots during a 24-h cycle in 31-day-old A. thaliana plants grown hydroponically. Measurements of sucrose (black), glucose  (white), fructose (light grey) (a), and starch contents in roots (b). Data are expressed as the mean of measures obtained from pools of five plants. Relative expression of AtSUC14 (c) and AtSWEET1115 in roots (d) was determined by RT-qPCR. Data are expressed as normalized expression (no unit) to the reference gene At5g12240 expression level (Czechowski et al. 2005) and are the mean of measures obtained from pools of five plants
Fig. 4
Fig. 4
Biomass partitioning in the different organs of plants at the six principal growth stages of A. thaliana grown hydroponically. Three organs have been considered: roots (black), rosette (grey), and stem (white, when present). The percentage of biomass has been calculated from the mean of dry weight of seven to eight individual plants from two independent experiments. A biomass of 100% corresponds to the sum of the dry weight of organs present on the plants at the developmental stage considered
Fig. 5
Fig. 5
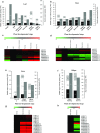
Sugar content and fold changes of expression for a set of AtSUC and AtSWEET genes in different organs and at the six principal growth stages of A. thaliana grown hydroponically. Sucrose (black), glucose (white), fructose (light grey), and starch (dark grey) contents measured in leaves (a), roots (b), stems (e), and siliques (f). Data are expressed as the mean ± SE of measures obtained from five plants. Fold change of expressed AtSUC and AtSWEET genes in rosettes (c), roots (d), stems (g), and siliques (h) has been studied. Fold change values are displayed as a two colours heat-map view (MeVsoftware (http://www.tm4.org/mev.html), with rows corresponding to the genes of interest and columns to the six development stages studied with). The oligonucleotides primers used in RT-qPCR experiments are presented in Table S1. Fold change values are obtained by comparison with the adult stage after normalization to the reference gene At5g12240 (Czechowski et al. 2005). Data are the mean of three measures, each corresponding to a pool of five plants
Fig. 6
Fig. 6
Quantitative representation of [U-14C] sucrose transport (expressed as % of total radioactivity exported) from a mature leaf to sink leaves, roots, stems (if present), and external medium and at the six principal growth stages of A. thaliana grown hydroponically. For each development stage studied, plants were fed with a drop (10 µl) of 14C sucrose on a mature leaf, after gentle scrubbing with carborundum. After 5 h of transport, the radioactivity was counted in the rosette (grey), stem (white), roots (black), and external medium (dots), and the distribution of radioactivity calculated among the three compartments. Each result is the mean ± SE of measures obtained from three to eight individual plants from two independent experiments
Fig. 7
Fig. 7
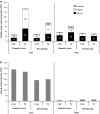
Impact of osmotic stress and rewatering on sugar and starch contents of rosette and roots of plants grown hydroponically. Sucrose (black), glucose (white), and fructose (light grey) contents (a) and starch content (b) measured in leaves and roots after osmotic stress and rehydration phase. Data are expressed as the mean of measures obtained from pools of plants
Fig. 8
Fig. 8
Impact of osmotic stress and rewatering on the relative expression (log2 St/C) of a selected set of AtSUC and AtSWEET genes in leaves and roots of plants grown hydroponically. SUC and SWEET transcripts level are quantified by RT-qPCR in rosette (a) and in roots (c) after osmotic stress (black) or rewatering (white). Values in each graph represent the log2 relative expression St/C measured by RT-qPCR using At5g12240 (Czechowski et al. 2005) gene as reference and represent the mean of measures obtained from a pool of five plants The expression of specific genes as osmotic stress markers are followed in the leaf: AtRD29 (b) and in the root: AtTIP1.2 (d) or as senescence-associated gene: AtSAG12 (b) during osmotic stress (black) and during rewatering phase (white)
Fig. 9
Fig. 9
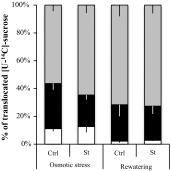
Quantitative representation of [U-14C] sucrose transport (expressed as % of total radioactivity exported) from a mature leaf to sink leaves, roots, and external medium. For each condition studied (osmotic and rewatering phases), plants are fed with a drop (10 µl) of 14C sucrose on a mature leaf, after gentle scrubbing with carborundum. After 5 h of transport, the radioactivity is counted in the rosette (grey), roots (black), and external medium (white) and the distribution of radioactivity calculated between the three compartments. Each result is the mean ± SE of measures obtained from three to eight individual plants from two independent experiments
Fig. 10
Fig. 10
Expression pattern of a selected set of AtSUC and AtSWEET genes in different organs of plants and at the six growth stages of A. thaliana grown hydroponically. Representation of preferential AtSUC and AtSWEET genes expression in roots, leaves, stems, and siliques. The figure presents the main sucrose transporters genes expressed at all stages of development study (i.e. Fig. 1a) for each organ. Four sizes of font are used to write the name of genes and indicate their different level of expression in each organ: height (font 14), middle (font 12), low (font 10) and slight (font 8). The novel expression of sucrose transporters genes, not reported before, is mentioned in red. See for review: AtSUC1 (At1g71880): Sivitz et al. (2007, 2008); Schmid et al. (2005); Stadler et al. (1999); Feuerstein et al. (2010); AtSUC2 (At1g22710): Truernit and Sauer (1995); Stadler and Sauer ; Lalonde et al. (2003); Sauer (2007); AtSUC3 (At2g02860): Meyer et al. (, 2004); AtSUC4 (At1g09960): Schneider et al. ; Endler et al. (2006); AtSUC5 (At1g71890): Baud et al. (2005); AtSUC9 (At5g06170): Sivitz et al. (2008). AtSWEET9 (At2g39060): Chen et al. (2012); AtSWEET10 (At5g50790): Chen et al. (2012); AtSWEET11 (At3g48740): Chen et al. (2012); Chen (2013); Chen et al. (2015); Le Hir et al. (2015); AtSWEET12 (At5g23660): Chen et al. ; Chen (2013); Chen et al. (2015); Le Hir et al. (2015); AtSWEET13 (At5g50800): Chen et al. (2012); Chen (2013); Chen et al. (2015); AtSWEET15 (At5g13170): Chen et al. (2012, 2015); Seo et al. (2011); Quirino et al. (2001). The expression in roots of the five AtSWEET genes from the clade III: AtSWEET 1115 have been reported for the first time in our previous work (Durand et al. 2016)

Similar articles

Cited by

References

    1. Afoufa-Bastien D, Medici A, Jeauffre J, Coutos-Thévenot P, Lemoine R, Atanassova R, Laloi M. The Vitis vinifera sugar transporter gene family: phylogenetic overview and macroarray expression profiling. BMC Plant Biol. 2010;10(1):245. doi: 10.1186/1471-2229-10-245. - DOI - PMC - PubMed
    1. Alexandersson E, Fraysse L, Sjovall-Larsen S, Gustavsson S, Fellert M, Karlsson M, Johanson U, Kjellbom P. Whole gene family expression and drought stress regulation of aquaporins. Plant Mol Biol. 2005;59(3):469–484. doi: 10.1007/s11103-005-0352-1. - DOI - PubMed
    1. Ali ML, Luetchens J, Singh A, Shaver T, Kruger G, Lorenz A. Greenhouse screening of maize genotypes for deep root mass and related root traits and their association with grain yield under water-deficit conditions in the field. Euphytica. 2016;207(1):79–94. doi: 10.1007/s10681-015-1533-x. - DOI
    1. Angeles-Núñez JG, Tiessen A. Mutation of the transcription factor LEAFY COTYLEDON 2 alters the chemical composition of Arabidopsis seeds, decreasing oil and protein content, while maintaining high levels of starch and sucrose in mature seeds. J Plant Physiol. 2011;168(16):1891–1900. doi: 10.1016/j.jplph.2011.05.003. - DOI - PubMed
    1. Arteca RN, Arteca JM. A novel method for growing Arabidopsis thaliana plants hydroponically. Physiol Plant. 2000;108(2):188–193. doi: 10.1034/j.1399-3054.2000.108002188.x. - DOI

MeSH terms