

Electroretinography in idiopathic intracranial hypertension: comparison of the pattern ERG and the photopic negative response
- PMID: 29139045
- PMCID: PMC5812802
- DOI: 10.1007/s10633-017-9620-z
Electroretinography in idiopathic intracranial hypertension: comparison of the pattern ERG and the photopic negative response
Abstract
Purpose: To evaluate the relationship between electrophysiological measures of retinal ganglion cell (RGC) function in patients who have idiopathic intracranial hypertension (IIH).
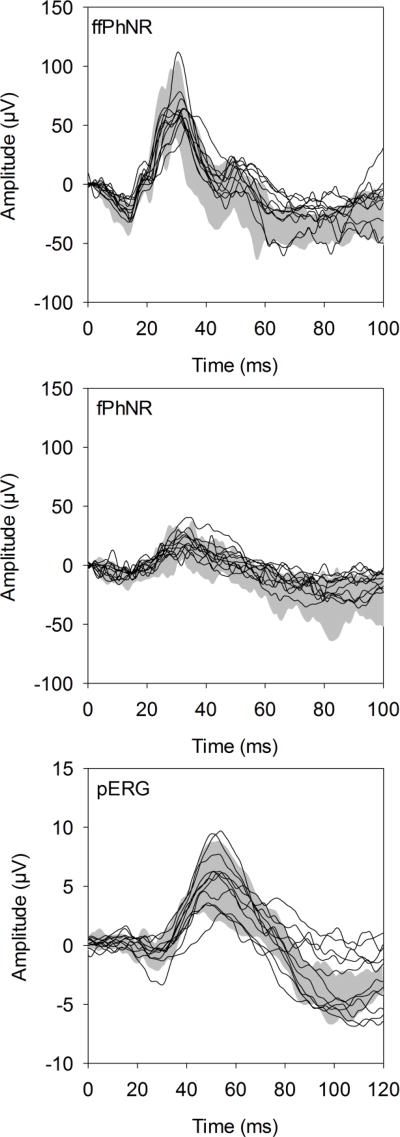
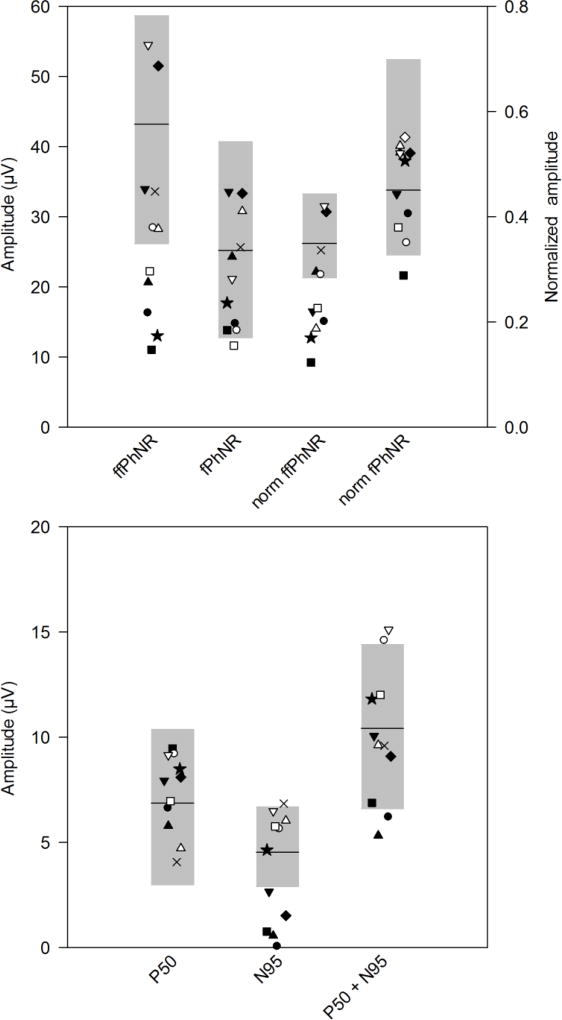
Methods: The pattern electroretinogram (pERG) and photopic negative response (PhNR) were recorded from 11 IIH patients and 11 age-similar controls. The pERG was elicited by a contrast-reversing checkerboard. The PhNR, a slow negative component following the flash ERG b-wave, was recorded in response to a long-wavelength flash presented against a short-wavelength adapting field. The PhNR was elicited using full-field (ffPhNR) and focal macular (fPhNR) stimuli. Additionally, Humphrey visual field mean deviation (HVF MD) was measured and ganglion cell complex volume (GCCV) was obtained by optical coherence tomography.
Results: The ffPhNR, fPhNR, and pERG amplitudes were outside of the normal range in 45, 9, and 45% of IIH patients, respectively. However, only mean ffPhNR amplitude was reduced significantly in the patients compared to controls (p < 0.01). The pERG amplitude correlated significantly with HVF MD and GCCV (both r > 0.65, p < 0.05). There were associations between ffPhNR amplitude and HVF MD (r = 0.58, p = 0.06) and with GCCV (r = 0.52, p = 0.10), but these did not reach statistical significance. fPhNR amplitude was not correlated significantly with HVF MD or GCCV (both r < 0.40, p > 0.20).
Conclusions: Although the fPhNR is generally normal in IIH, other electrophysiological measures of RGC function, the ffPhNR and pERG, are abnormal in some patients. These measures provide complementary information regarding RGC dysfunction in these individuals.
Keywords: Electroretinogram; Idiopathic intracranial hypertension; Pattern electroretinogram; Photopic negative response.
Conflict of interest statement
Figures
References
-
- Wall M. Idiopathic intracranial hypertension. Neurol Clin. 1991;9(1):73–95. - PubMed
-
- Corbett JJ, Savino PJ, Thompson HS, Kansu T, Schatz NJ, Orr LS, Hopson D. Visual loss in pseudotumor cerebri. Follow-up of 57 patients from five to 41 years and a profile of 14 patients with permanent severe visual loss. Arch Neurol. 1982;39(8):461–474. - PubMed
-
- Orcutt JC, Page NG, Sanders MD. Factors affecting visual loss in benign intracranial hypertension. Ophthalmology. 1984;91(11):1303–1312. - PubMed
-
- Hayreh SS. Pathogenesis of optic disc oedema in raised intracranial pressure. Trans Ophthalmol Soc U K. 1976;96(3):404–407. - PubMed
Publication types
MeSH terms
Grants and funding
LinkOut - more resources
Full Text Sources
Other Literature Sources
