. 2017 Nov 15;13(11):e1005760.
doi: 10.1371/journal.pcbi.1005760. eCollection 2017 Nov.

A coupled-oscillator model of olfactory bulb gamma oscillations

Affiliations

A coupled-oscillator model of olfactory bulb gamma oscillations

Guoshi Li et al. PLoS Comput Biol. .

Abstract

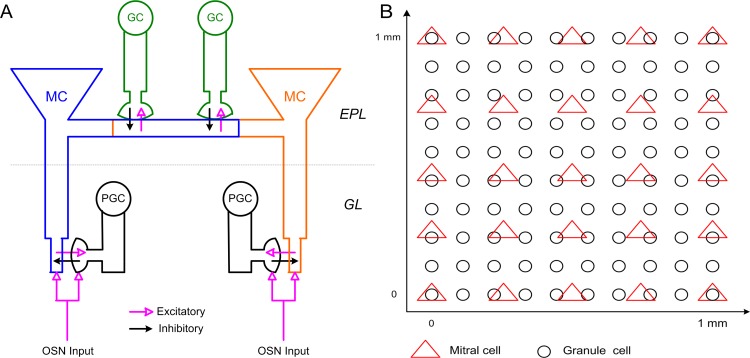
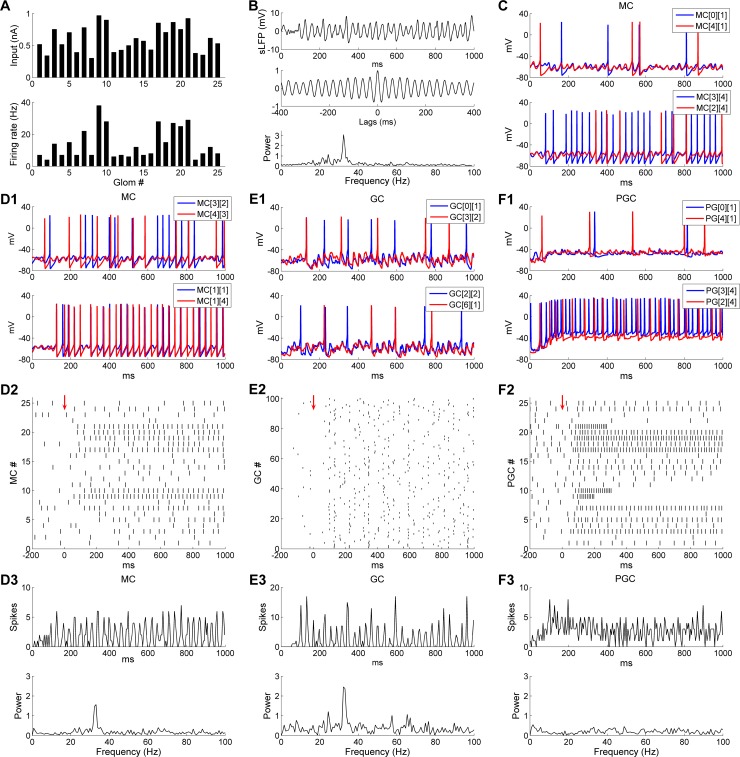
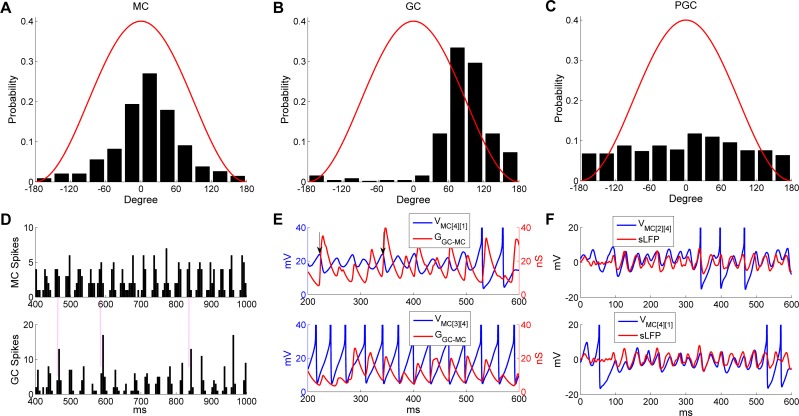
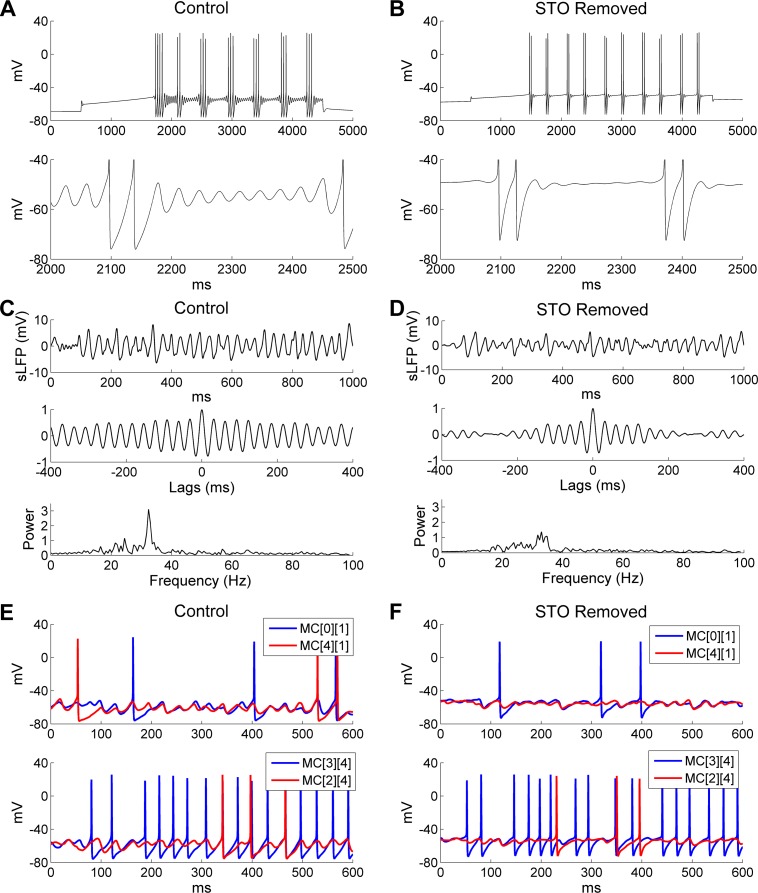
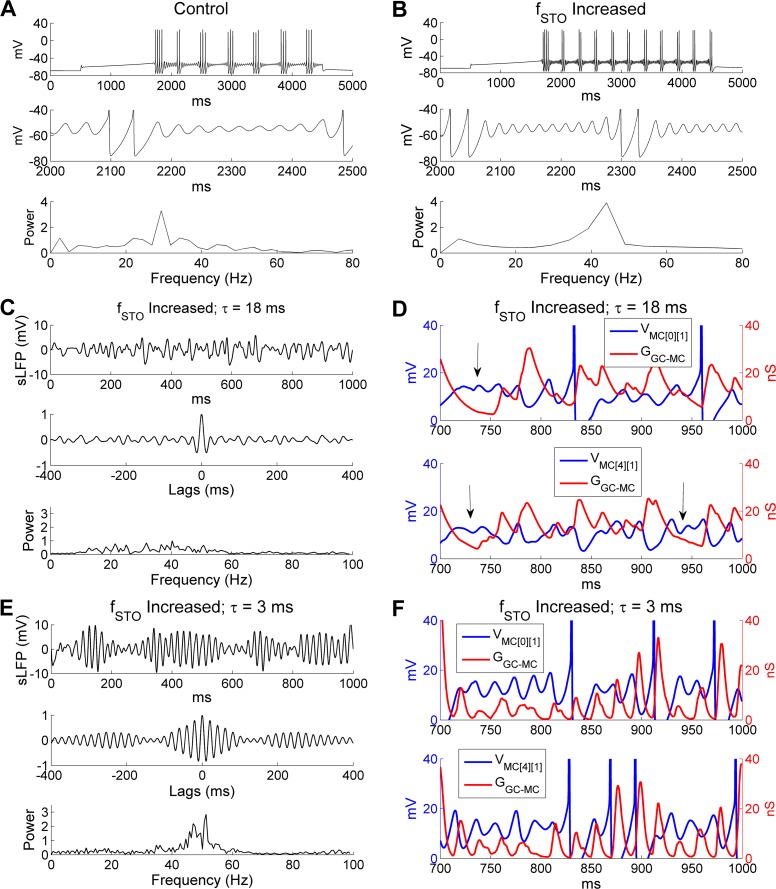
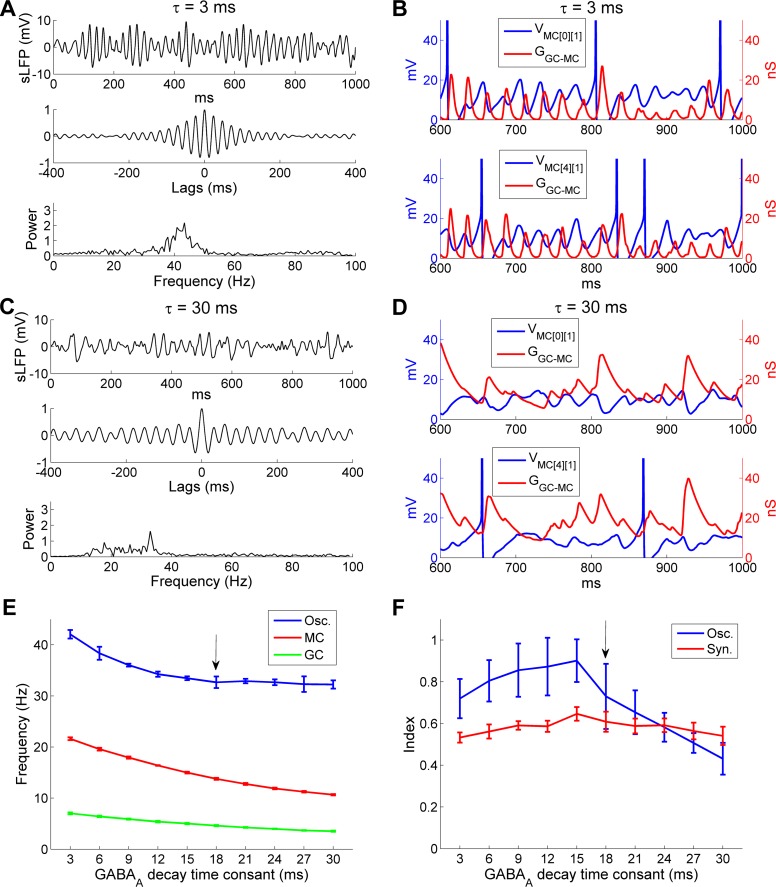
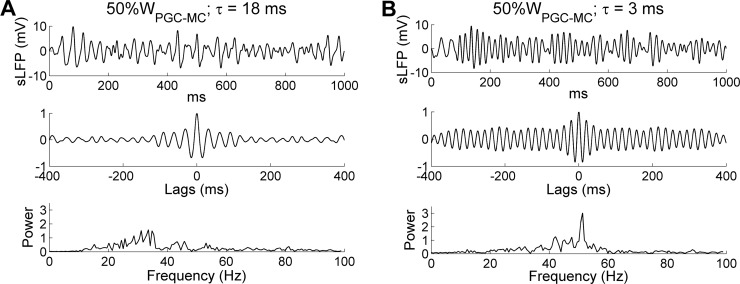
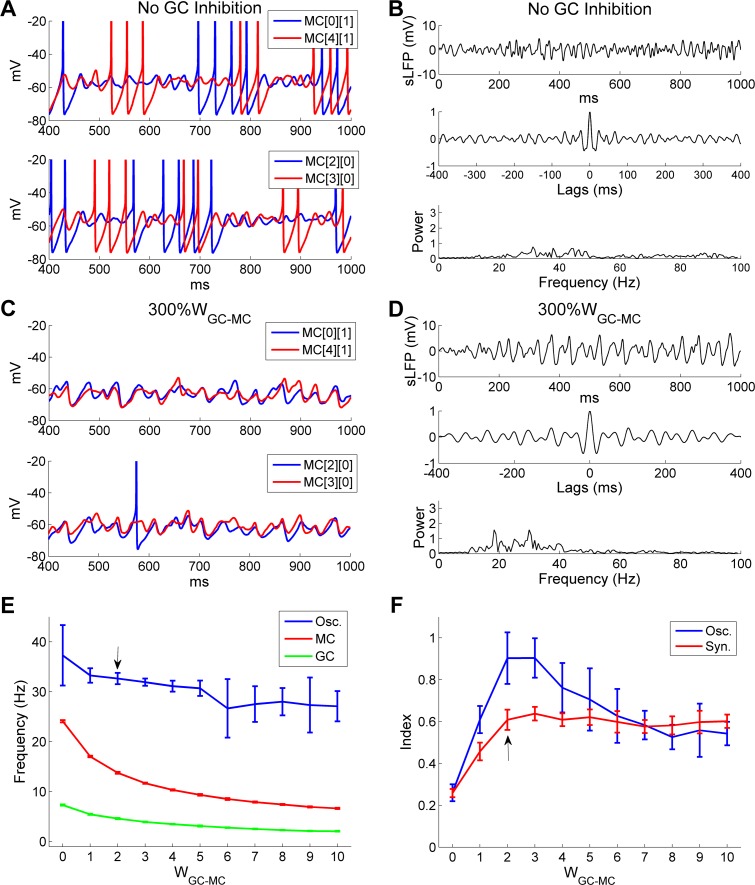
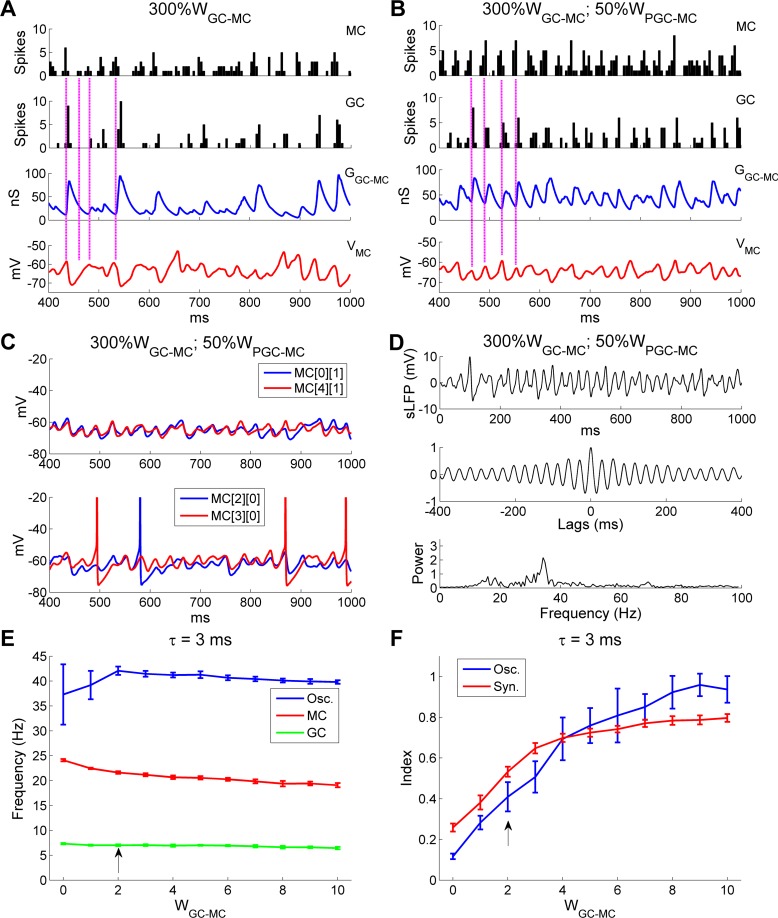
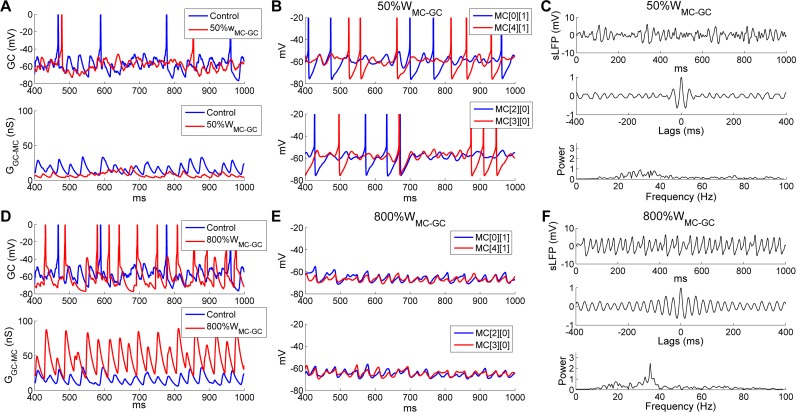
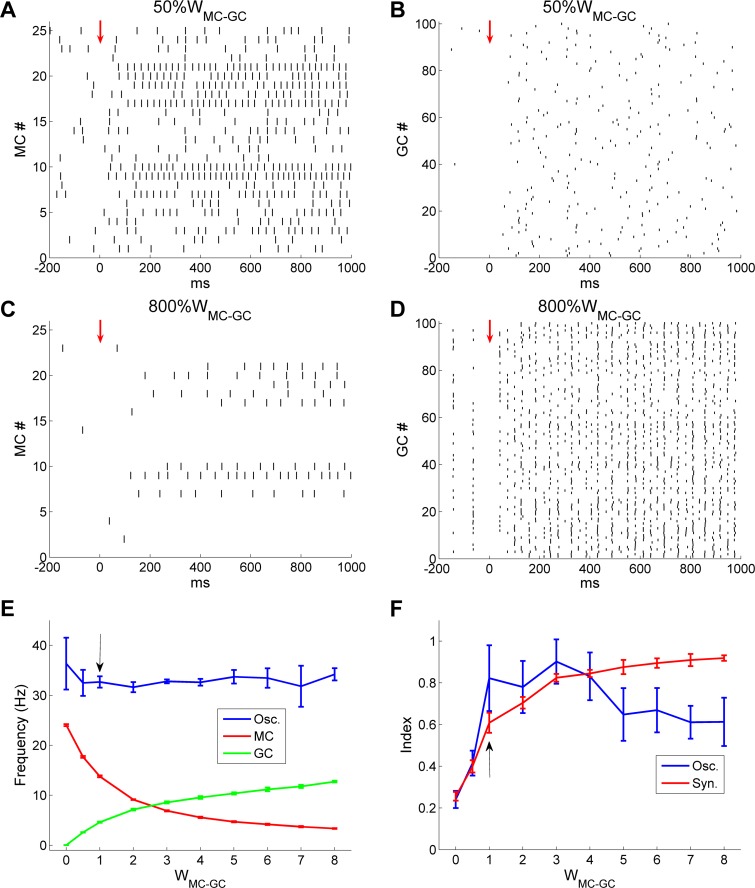
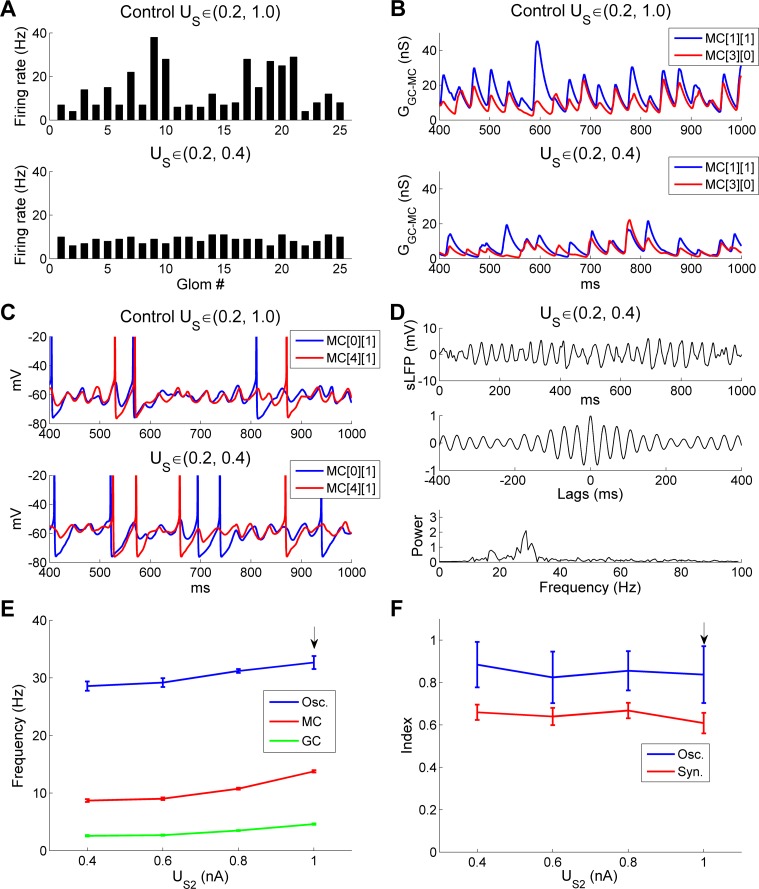
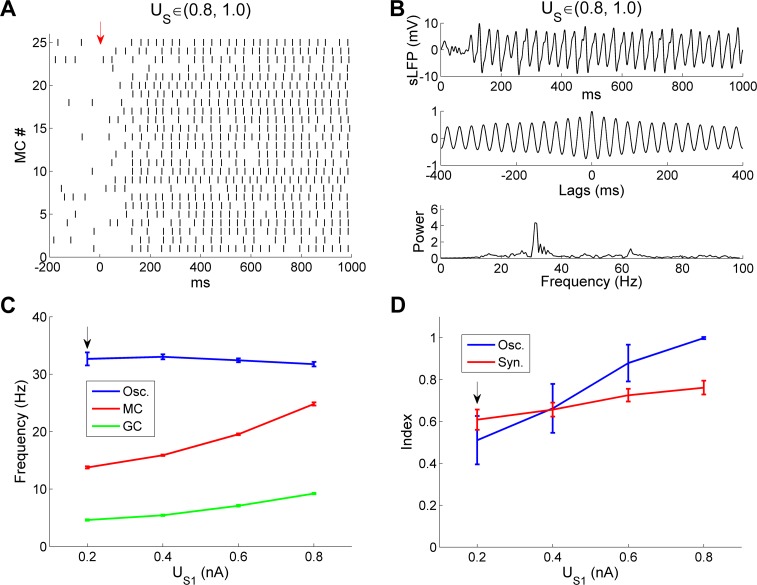
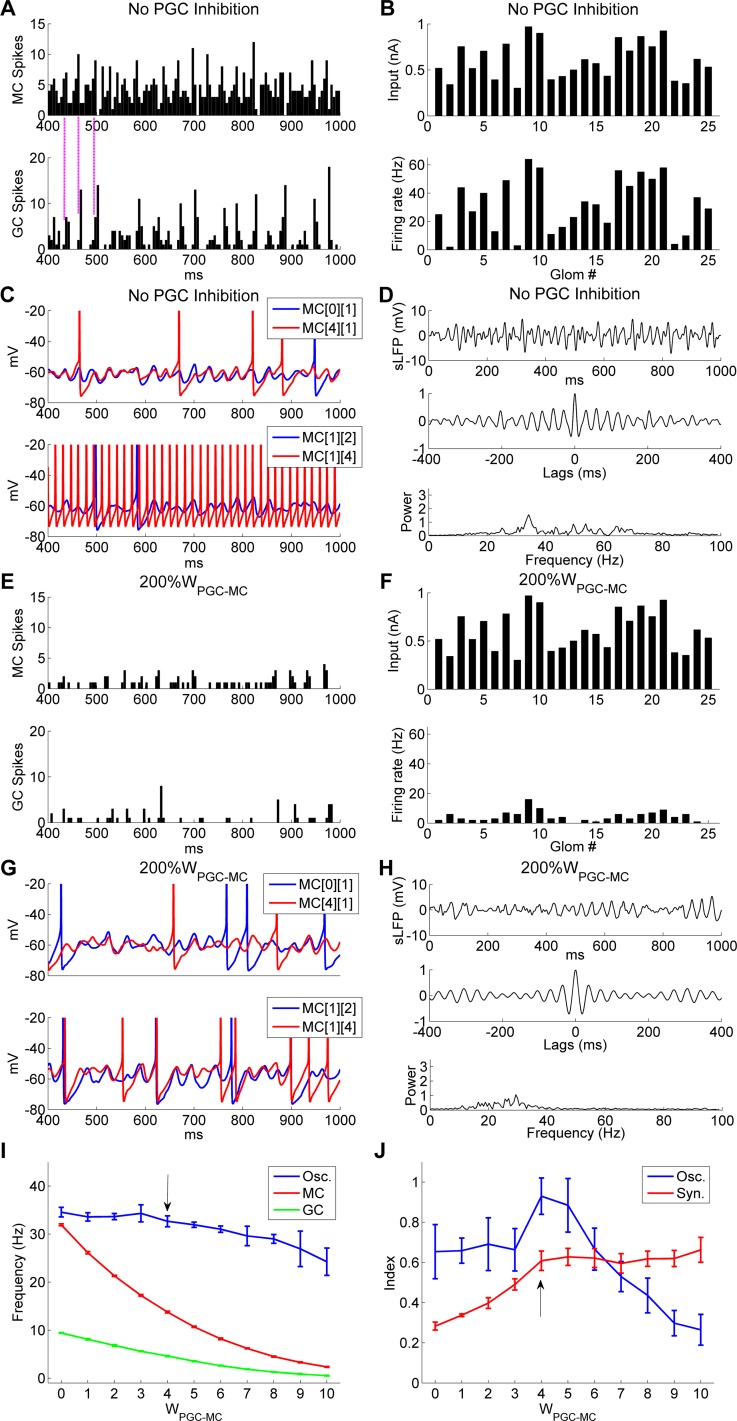
The olfactory bulb transforms not only the information content of the primary sensory representation, but also its underlying coding metric. High-variance, slow-timescale primary odor representations are transformed by bulbar circuitry into secondary representations based on principal neuron spike patterns that are tightly regulated in time. This emergent fast timescale for signaling is reflected in gamma-band local field potentials, presumably serving to efficiently integrate olfactory sensory information into the temporally regulated information networks of the central nervous system. To understand this transformation and its integration with interareal coordination mechanisms requires that we understand its fundamental dynamical principles. Using a biophysically explicit, multiscale model of olfactory bulb circuitry, we here demonstrate that an inhibition-coupled intrinsic oscillator framework, pyramidal resonance interneuron network gamma (PRING), best captures the diversity of physiological properties exhibited by the olfactory bulb. Most importantly, these properties include global zero-phase synchronization in the gamma band, the phase-restriction of informative spikes in principal neurons with respect to this common clock, and the robustness of this synchronous oscillatory regime to multiple challenging conditions observed in the biological system. These conditions include substantial heterogeneities in afferent activation levels and excitatory synaptic weights, high levels of uncorrelated background activity among principal neurons, and spike frequencies in both principal neurons and interneurons that are irregular in time and much lower than the gamma frequency. This coupled cellular oscillator architecture permits stable and replicable ensemble responses to diverse sensory stimuli under various external conditions as well as to changes in network parameters arising from learning-dependent synaptic plasticity.


Conflict of interest statement

The authors have declared that no competing interests exist.

Figures

Fig 1
Fig 1. Schematic representation of OB network connectivity and model structure.
A: Schematic representation of dendrodendritic synaptic connectivity among MCs, PGCs, and GCs. Reciprocal dendrodendritic synaptic connections exist between the MC tuft and PGC spines, and between the MC lateral dendrite and GC spines. GL: glomerular layer; EPL: external plexiform layer. B: Spatial localization of MCs and GCs across the two-dimensional toroidal surface of the model OB (1 mm × 1 mm).
Fig 2
Fig 2. Odor stimulation induces gamma oscillation in the 2D OB model.
A: Steady-state OSN input intensities (top) and odor-evoked firing rates (bottom) of all 25 mitral cells. B: Simulated LFP (top) during odor presentation, with autocorrelation (middle) and frequency power spectrum (bottom). C: Voltage responses during odor presentation of a pair of MCs exhibiting STOs along with sparse spikes (top) and another pair of MCs with one exhibiting dense spiking and the other sparse spiking with ongoing STOs (bottom). D: MC population spikes exhibit gamma synchrony. D1: Voltage responses of two MCs exhibiting mixed STOs and spikes (top) and another two MCs exhibiting dense spiking activity (bottom) during odor presentation. D2: Spike raster plot of MC population activity. The red arrow designates the onset of odor input. D3: MC population activity (top) with frequency power spectrum (bottom). Bin width is 5 ms and all MC spikes are summed in each bin. E: GC population spikes exhibit gamma synchrony. E1: Voltage responses of two typical pairs of GCs during odor presentation. E2: Spike raster plot of GC population activity. The red arrow designates the onset of odor input. E3: GC population activity (top) with frequency power spectrum (bottom). Bin width as in D. F: PGC population spikes do not exhibit gamma synchrony. F1: Voltage responses of two typical pairs of PGCs during odor presentation. F2: Spike raster plot of PGC population activity. The red arrow designates the onset of odor input. F3: PGC population activity (top) with frequency power spectrum (bottom). Bin width as in D.
Fig 3
Fig 3. MC and GC spikes, but not PGC spikes, are phase-constrained within common gamma cycles.
A: Distribution of MC spike phases with respect to sLFP oscillations. B: Distribution of GC spike phases with respect to sLFP oscillations. C: Distribution of PGC spike phases with respect to sLFP oscillations. D: Spike timing histograms of MCs (upper) and GCs (bottom). Bin width is 5 ms and all MC/GC spikes are summed in each bin. Vertical lines accentuate the alignment of spike time distributions. E: MC STOs with associated cumulative GC-mediated GABAA synaptic conductance (top) and MC spikes with associated cumulative GC-mediated GABAA synaptic conductance (bottom), during an odor presentation. The vertical black arrows indicate STO phase resets generated by GABAergic input. F: Synchronization of MC STOs with the sLFP. The MC voltage was raised by 80 mV in E and 60 mV in F for display purposes.
Fig 4
Fig 4. Propagation delay of MC action potentials along the lateral dendrite.
A: MC membrane voltages recorded at the soma and three different locations on the lateral dendrite (80 μm, 235 μm and 500 μm from the soma). B: Expanded view of the spike propagation delay along the lateral dendrite.
Fig 5
Fig 5. Removing MC STOs impairs OB gamma oscillations.
A: Voltage response of an isolated MC model cell to a 0.2 nA current injection (top) and an expanded view of the STOs (bottom) under control conditions. B: As in A, but after MC STOs were removed. C: Simulated LFP (top) during odor presentation, with autocorrelation (middle) and frequency power spectrum (bottom) under control conditions (same as Fig 2B). D: As in C, but after MC STOs were removed. E: Voltage responses of two pairs of MCs under control conditions. F: As in E, but after MC STOs were removed. The MC STOs were removed by replacing the persistent sodium current (INaP) with an ohmic cation current; the conductance of this current was tuned to maintain the same firing frequency.
Fig 6
Fig 6. Higher intrinsic MC STO frequencies require faster GABAergic synaptic decay to synchronize activity.
A: Voltage response of an isolated MC model cell to a 0.2 nA current injection (top), an expanded view of the STOs (middle), and the STO frequency power spectrum (bottom) under control conditions. B: As in A, but with a higher intrinsic STO frequency. C: Simulated LFP (top) during odor presentation, with autocorrelation (middle) and frequency power spectrum (bottom) under conditions in which the STO frequency was increased while the decay time constant of the GC-mediated GABAA synaptic conductance remained unchanged (18 ms). D: Plot of MC STOs with associated cumulative GC-mediated GABAA synaptic conductance when STO frequency was increased. The vertical black arrows indicate multiple STO cycles during one single GABAA conductance decay. E: As in C, but when the decay time constant of the GC-mediated GABAA conductance was reduced to 3 ms (from 18 ms) in the presence of the higher intrinsic STO frequency. F: As in D, but when the decay time constant of the GC-mediated GABAA conductance was reduced to 3 ms in the presence of the higher intrinsic STO frequency. The MC STO frequency was increased by reducing the activation time constant of the slow-inactivating potassium current (IKS) while increasing the maximal conductances of INaP and IKS to maintain the same firing frequency. The MC voltage was raised by 70 mV in D and F for display purposes.
Fig 7
Fig 7. The OB gamma oscillation frequency is responsive to faster, but not slower, GABAA decay time constants.
A: Simulated LFP (top) during odor presentation, with autocorrelation (middle) and frequency power spectrum (bottom), when the decay time constant of the GC-mediated GABAA conductance was reduced from 18 ms to 3 ms. B: Plot of MC STOs with associated cumulative GC-mediated GABAA synaptic conductance when the latter had a decay time constant of 3 ms. C: As in A, but when the decay time constant of the GC-mediated GABAA conductance was increased from 18 ms to 30 ms. D: As in B, but when the decay time constant of the GC-mediated GABAA conductance was increased from 18 ms to 30 ms. E: Average odor-evoked MC and GC firing rates and sLFP oscillation frequency as functions of the decay time constant of the GC-medicated GABAA conductance. F: Synchronization and oscillation indices as functions of the decay time constant of the GC-medicated GABAA conductance. The default (control) decay time constant in this study was 18 ms (indicated by black arrows in E, F). Error bars denote standard deviations (SD). The MC voltage was raised by 70 mV in B and D for display purposes.
Fig 8
Fig 8. Gamma oscillation frequency is determined by the decay time constant of the GC-mediated GABAA synaptic conductance.
A: Simulated LFP (top) during odor presentation, with autocorrelation (middle) and frequency power spectrum (bottom), when PGC→MC synaptic weights were reduced by 50% while maintaining the same decay time constant (18 ms). B: As A, but with a reduced decay time constant of the GC-mediated GABAA conductance (3 ms) in addition to a 50% reduction in PGC→MC synaptic weights.
Fig 9
Fig 9. There is an optimal GC→MC synaptic strength for strong and coherent OB gamma oscillation.
A: Membrane potential timeseries of two pairs of MCs during odor presentation without GC inhibition. B: Simulated LFP (top) during odor presentation, with autocorrelation (middle) and frequency power spectrum (bottom), in the absence of GC inhibition. C: As in A, but with a 3-fold increase of the GC→MC synaptic weight (300%WGC-MC). D: As in B, but with 300%WGC-MC. E: Average odor-evoked MC and GC firing rates and sLFP oscillation frequency as functions of GC→MC synaptic weights. F: Synchronization and oscillation indices as functions of GC→MC synaptic weights. The default GC→MC synaptic weight in this study was 2 (indicated by black arrows in E, F). Error bars denote standard deviations (SD).
Fig 10
Fig 10. OB gamma oscillation impairments arising from excessive GC→MC synaptic weights can be counteracted by reducing PGC inhibition of MCs.
A: Spike timing histograms of MCs (top panel) and GCs (second panel) with associated cumulative GC-mediated GABAA synaptic conductance (third panel) and MC STOs (bottom panel) when the GC→MC synaptic weight was increased threefold (300%WGC-MC). B: As in A, but with an additional 50% reduction in the PGC→MC synaptic weight (50%WPGC-MC). C: Membrane potential timeseries of two pairs of MCs during odor presentation with 300%WGC-MC and 50%WPGC-MC. D: Simulated LFP (top) during odor presentation, with autocorrelation (middle) and frequency power spectrum (bottom), with 300%WGC-MC and 50%WPGC-MC. E: Average odor-evoked MC and GC firing rates and sLFP oscillation frequency as functions of GC→MC synaptic weight when the decay time constant of the GC-mediated GABAA conductance was reduced to 3 ms (from 18 ms). F: Synchronization and oscillation indices as functions of GC→MC synaptic weight when the decay time constant of the GC-mediated GABAA conductance was reduced to 3 ms (from 18 ms). The default GC→MC synaptic weight in this study was 2 (indicated by black arrows in E, F). Error bars denote standard deviations (SD).
Fig 11
Fig 11. OB gamma oscillations are robust to strongly increased, but not reduced, MC→GC synaptic weights.
A: Voltage timeseries of representative GCs (top) and GC-mediated GABAA synaptic conductances on MCs (bottom), under control conditions and following a 50% reduction of MC→GC synaptic weights (50%WMC-GC). B: Membrane potential timeseries of two pairs of MCs with 50%WMC-GC. C: Simulated LFP (top) during odor presentation, with autocorrelation (middle) and frequency power spectrum (bottom), with 50%WMC-GC. D: As in A, but under control conditions compared with an eightfold increase in the MC→GC synaptic weight (800%WMC-GC). E: As in B, but with 800%WMC-GC. F: As in C, but with 800%WMC-GC.
Fig 12
Fig 12. Gamma oscillations and spike synchronization persist under a wide range of MC→GC synaptic weights.
A: Raster plot of MC spikes after MC→GC synaptic weights were reduced by 50% (50%WMC-GC). The red arrow designates the onset of odor input. B: Raster plot of GC spikes with 50%WMC-GC. C: Raster plot of MC spikes after MC→GC synaptic weights were increased eightfold (800%WMC-GC). D: Raster plot of GC spikes with 800%WMC-GC. E: Average odor-evoked MC and GC firing rates and sLFP oscillation frequency as functions of MC→GC synaptic weight. F: Synchronization and oscillation indices as functions of MC→GC synaptic weight. The default MC→GC synaptic weight was 1 (indicated by black arrows in E, F). Error bars denote standard deviations (SD).
Fig 13
Fig 13. OB gamma oscillations are robust to variation in the steady-state upper bound of afferent input.
A: Odor-evoked firing rates of all 25 MCs under control conditions (top) and following a reduction in the steady-state upper input bound (US2) from 1.0 nA to 0.4 nA (bottom). B: Timeseries of cumulative GC-mediated GABAA synaptic conductances in two representative MCs under control conditions (top) and following a reduction in the steady-state upper input bound from 1.0 nA to 0.4 nA (bottom). C: Membrane potential timeseries in two representative MCs under control conditions (top) and following a reduction in the steady-state upper input bound from 1.0 nA to 0.4 nA (bottom). D: Simulated LFP (top) during odor presentation, with autocorrelation (middle) and frequency power spectrum (bottom), after the steady-state upper input bound was lowered to 0.4 nA. E: Average odor-evoked MC and GC firing rates and sLFP oscillation frequency as functions of the steady-state upper bound of afferent input (US2). F: Synchronization and oscillation indices as functions of the steady-state upper input bound (US2). In these simulations, the steady-state lower input bound was maintained at its default (0.2 nA). The default upper input bound was 1.0 nA (indicated by black arrows in E, F). Error bars denote standard deviations (SD).
Fig 14
Fig 14. OB gamma oscillations are robust to variation in the steady-state lower bound of afferent input.
A: Raster plot of MC spikes when the steady-state lower input bound (US1) was increased fourfold, from 0.2 nA to 0.8 nA. The red arrow designates the onset of odor input. B: Simulated LFP (top) during odor presentation, with autocorrelation (middle) and frequency power spectrum (bottom), after the steady-state lower input bound (US1) was increased to 0.8 nA. C: Average odor-evoked MC and GC firing rates and sLFP frequency as functions of the steady-state lower input bound (US1). D: Synchronization and oscillation indices as functions of the steady-state lower input bound (US1). In these simulations, the steady-state upper input bound was maintained at its default (1.0 nA). The default lower input bound was 0.2 nA (indicated by black arrows in C, D). Error bars denote standard deviations (SD).
Fig 15
Fig 15. PGC inhibition enables OB gamma oscillations by limiting MC excitation and firing rate heterogeneity.
A: Spike timing histograms of MCs (top) and GCs (bottom) without PGC inhibition (0%WPGC-MC). Vertical lines accentuate the alignment of spike time distributions. B: Steady-state OSN input intensities (top) and the odor-evoked firing rates of all 25 mitral cells (bottom) after PGC-mediated inhibition was blocked. C: Membrane potential timeseries of two example pairs of MCs during odor presentation in the absence of PGC inhibition. D: Simulated LFP (top) during odor presentation, with autocorrelation (middle) and frequency power spectrum (bottom), in the absence of PGC inhibition. E: As in A, but with a twofold increase in PGC→MC synaptic weights (200%WPGC-MC). F: As in B, but with a twofold increase in PGC→MC synaptic weights. G: As in C, but with a twofold increase in PGC→MC synaptic weights. H: As in D, but with a twofold increase in PGC→MC synaptic weights. I: Average odor-evoked MC and GC firing rates and sLFP oscillation frequency as functions of PGC→MC synaptic weight. J: Synchronization and oscillation indices as functions of PGC→MC synaptic weight. The default PGC→MC synaptic weight was 4 (indicated by black arrows in I, J). Error bars denote standard deviations (SD).
Fig 16
Fig 16. OB gamma oscillation is robust to variation in network size.
A: Raster plot of MC spikes after increasing the number of granule cells in the model (NGC) to 225. The red arrow designates the onset of odor input. B: Raster plot of GC spikes with NGC = 225. C: Simulated LFP (top) during odor presentation, with autocorrelation (middle) and frequency power spectrum (bottom), with NGC = 225. D: Raster plot of MC spikes after increasing the number of granule cells (NGC) to 400. E: Raster plot of GC spikes with NGC = 400. F: As in C, but with NGC = 400. The default network size was NGC = 100.

Similar articles

Cited by

References

    1. Shepherd GM, Chen WR, Greer CA. Olfactory bulb In: The Synaptic Organization of the Brain (5th ed.), edited by Shepherd GM. Oxford, UK: Oxford Univ. Press; 2004. pp. 165–216.
    1. Cleland TA. Construction of odor representations by olfactory bulb microcircuits. Prog Brain Res. 2014; 208:177–203. doi: 10.1016/B978-0-444-63350-7.00007-3 - DOI - PubMed
    1. Kay LM, Lazzara P. How global are olfactory bulb oscillations? J Neurophysiol. 2010; 104(3):1768–1773. doi: 10.1152/jn.00478.2010 - DOI - PMC - PubMed
    1. Freeman WJ, Viana Di Prisco G. Relation of olfactory EEG to behavior: time series analysis. Behav Neurosci. 1986; 100(5):753–763. - PubMed
    1. Freeman WJ, Baird B. Relation of olfactory EEG to behavior: spatial analysis. Behav Neurosci. 1987; 101(3):393–408. - PubMed

LinkOut - more resources