

Prokaryotic diversity and biogeochemical characteristics of benthic microbial ecosystems at La Brava, a hypersaline lake at Salar de Atacama, Chile
- PMID: 29140980
- PMCID: PMC5687714
- DOI: 10.1371/journal.pone.0186867
Prokaryotic diversity and biogeochemical characteristics of benthic microbial ecosystems at La Brava, a hypersaline lake at Salar de Atacama, Chile
Abstract
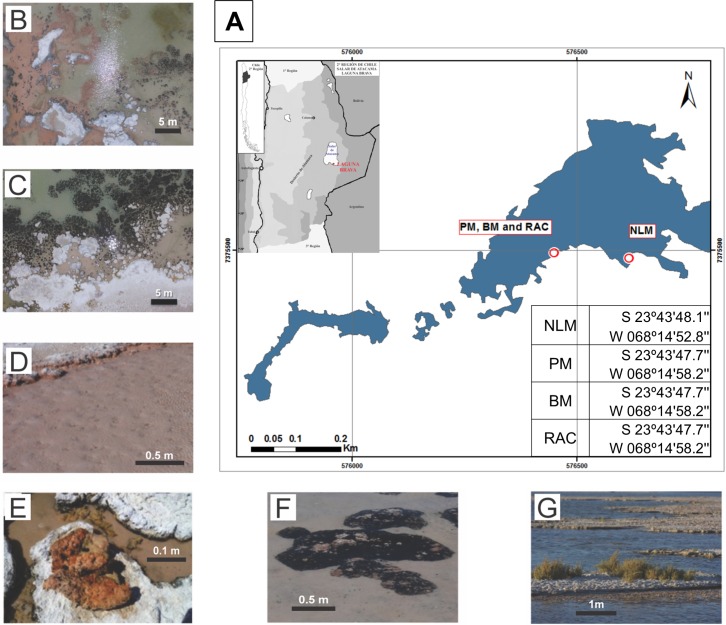
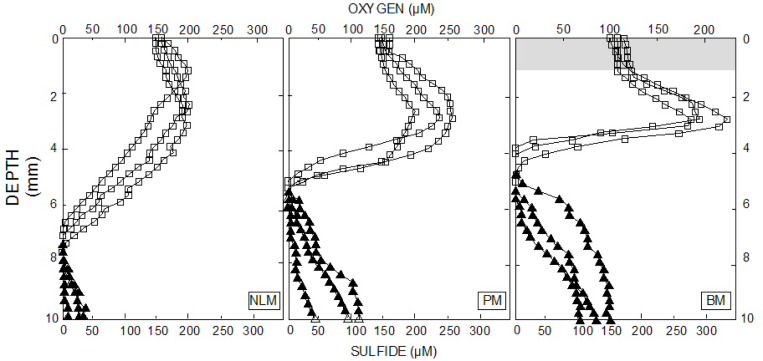
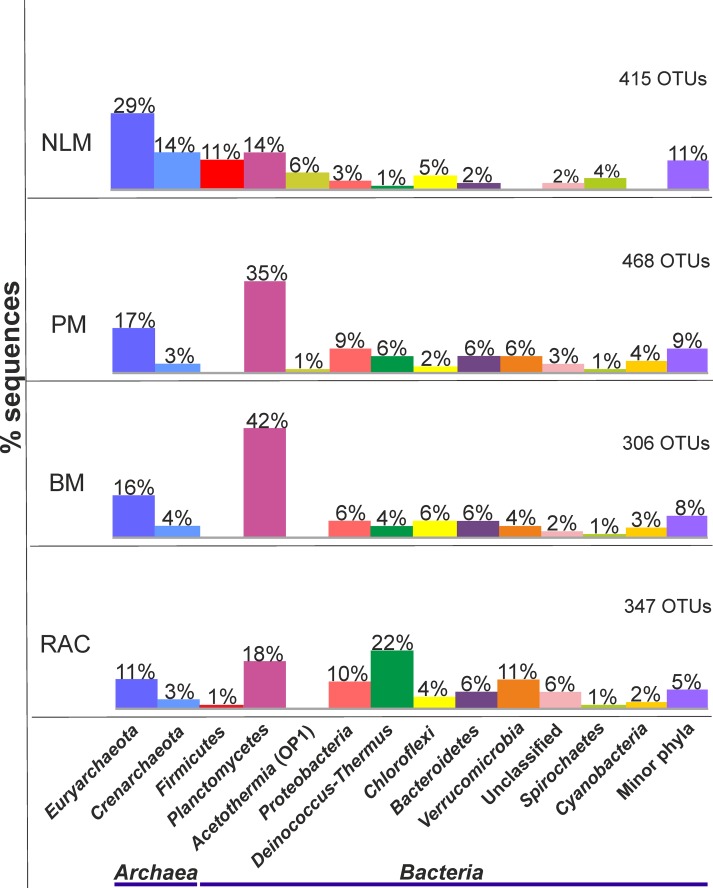
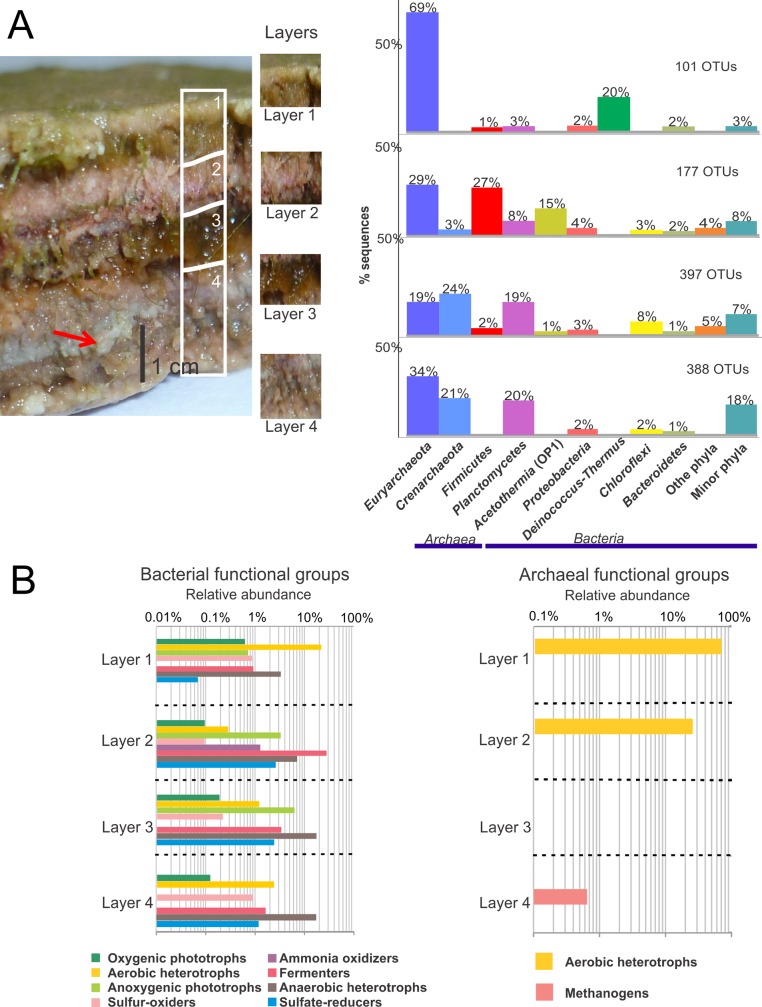
Benthic microbial ecosystems of Laguna La Brava, Salar de Atacama, a high altitude hypersaline lake, were characterized in terms of bacterial and archaeal diversity, biogeochemistry, (including O2 and sulfide depth profiles and mineralogy), and physicochemical characteristics. La Brava is one of several lakes in the Salar de Atacama where microbial communities are growing in extreme conditions, including high salinity, high solar insolation, and high levels of metals such as lithium, arsenic, magnesium, and calcium. Evaporation creates hypersaline conditions in these lakes and mineral precipitation is a characteristic geomicrobiological feature of these benthic ecosystems. In this study, the La Brava non-lithifying microbial mats, microbialites, and rhizome-associated concretions were compared to each other and their diversity was related to their environmental conditions. All the ecosystems revealed an unusual community where Euryarchaeota, Crenarchaeota, Acetothermia, Firmicutes and Planctomycetes were the most abundant groups, and cyanobacteria, typically an important primary producer in microbial mats, were relatively insignificant or absent. This suggests that other microorganisms, and possibly novel pathways unique to this system, are responsible for carbon fixation. Depth profiles of O2 and sulfide showed active production and respiration. The mineralogy composition was calcium carbonate (as aragonite) and increased from mats to microbialites and rhizome-associated concretions. Halite was also present. Further analyses were performed on representative microbial mats and microbialites by layer. Different taxonomic compositions were observed in the upper layers, with Archaea dominating the non-lithifying mat, and Planctomycetes the microbialite. The bottom layers were similar, with Euryarchaeota, Crenarchaeota and Planctomycetes as dominant phyla. Sequences related to Cyanobacteria were very scarce. These systems may contain previously uncharacterized community metabolisms, some of which may be contributing to net mineral precipitation. Further work on these sites might reveal novel organisms and metabolisms of biotechnological interest.
Conflict of interest statement
Figures


References
-
- Dupraz C, Reid RP, Braissant O, Decho AW, Norman RS, Visscher PT. Processes of carbonate precipitation in modern microbial mats. Earth-Science Rev. 2009;96: 141–162. doi: 10.1016/j.earscirev.2008.10.005 - DOI
-
- Glunk C, Dupraz C, Braissant O, Gallagher KL, Verrecchia EP, Visscher PT. Microbially mediated carbonate precipitation in a hypersaline lake, Big Pond (Eleuthera, Bahamas). Sedimentology. 2011;58: 720–736. doi: 10.1111/j.1365-3091.2010.01180.x - DOI
-
- Houghton J, Fike D, Druschel G, Orphan V, Hoehler TM, Des Marais DJ. Spatial variability in photosynthetic and heterotrophic activity drives localized δ 13 C org fluctuations and carbonate precipitation in hypersaline microbial mats. Geobiology. 2014;12: 557–574. doi: 10.1111/gbi.12113 - DOI - PubMed
-
- Kaźmierczak J, Fenchel T, Kühl M, Kempe S, Kremer B, Łącka B, et al. CaCO3 Precipitation in Multilayered Cyanobacterial Mats: Clues to Explain the Alternation of Micrite and Sparite Layers in Calcareous Stromatolites. Life. Multidisciplinary Digital Publishing Institute; 2015;5: 744–769. doi: 10.3390/life5010744 - DOI - PMC - PubMed
-
- Pace A, Bourillot R, Bouton A, Vennin E, Galaup S, Bundeleva I, et al. Microbial and diagenetic steps leading to the mineralisation of Great Salt Lake microbialites. Sci Rep. Nature Publishing Group; 2016;6: 31495 doi: 10.1038/srep31495 - DOI - PMC - PubMed
MeSH terms
Substances
LinkOut - more resources
Full Text Sources
Other Literature Sources
