. 2017 Nov 15;15(11):e2003091.
doi: 10.1371/journal.pbio.2003091. eCollection 2017 Nov.

Correlates of decisional dynamics in the dorsal anterior cingulate cortex

Affiliations

Correlates of decisional dynamics in the dorsal anterior cingulate cortex

Habiba Azab et al. PLoS Biol. .

Abstract

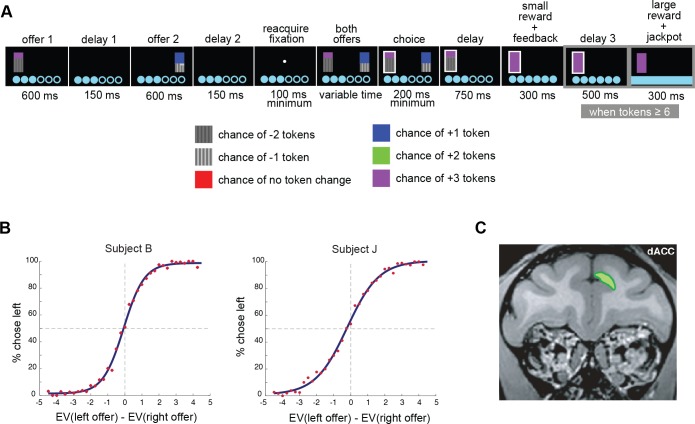
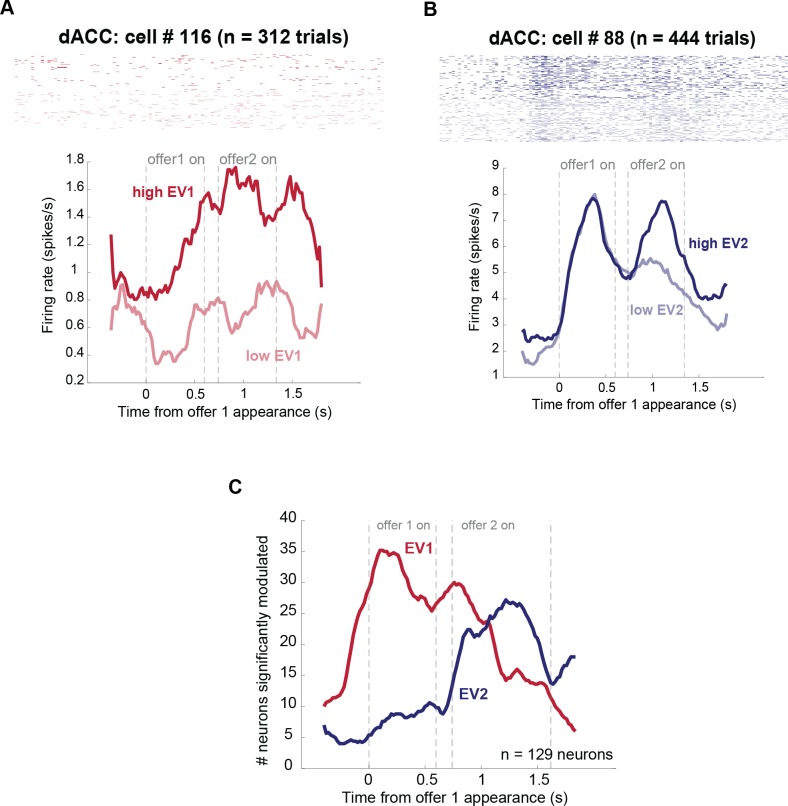
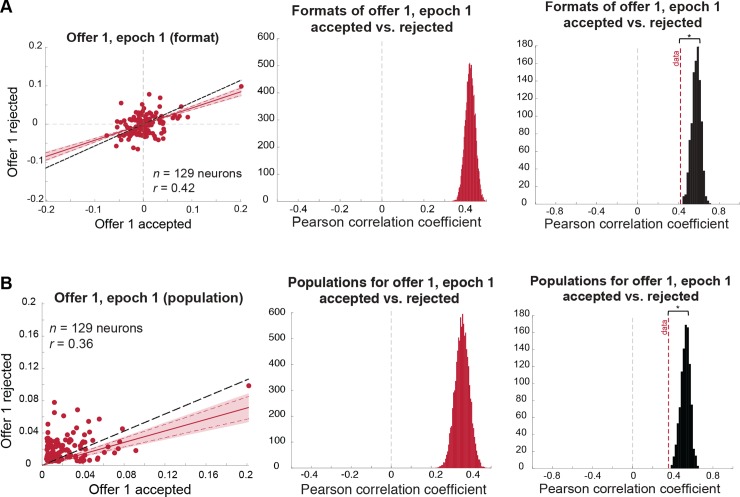
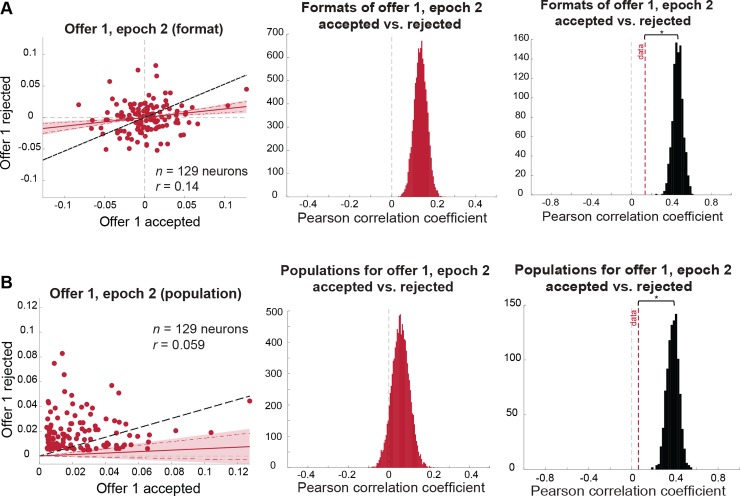
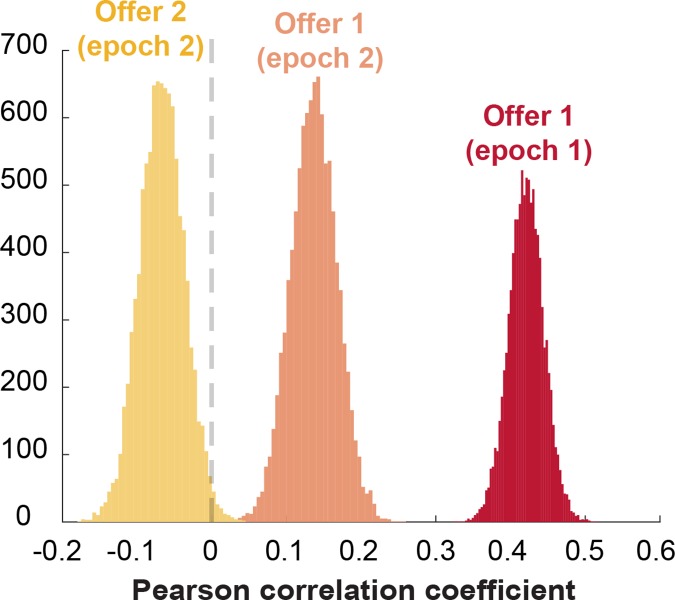
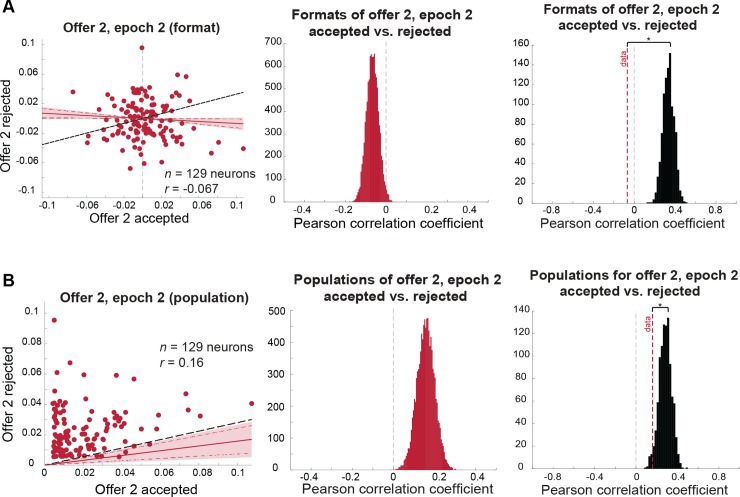
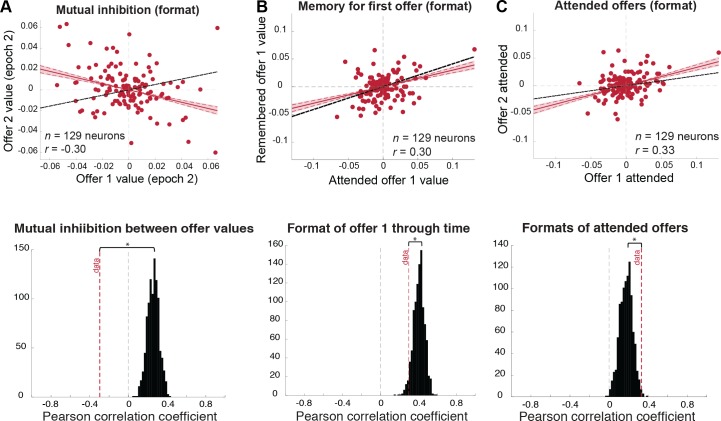
We hypothesized that during binary economic choice, decision makers use the first option they attend as a default to which they compare the second. To test this idea, we recorded activity of neurons in the dorsal anterior cingulate cortex (dACC) of macaques choosing between gambles presented asynchronously. We find that ensemble encoding of the value of the first offer includes both choice-dependent and choice-independent aspects, as if reflecting a partial decision. That is, its responses are neither entirely pre- nor post-decisional. In contrast, coding of the value of the second offer is entirely decision dependent (i.e., post-decisional). This result holds even when offer-value encodings are compared within the same time period. Additionally, we see no evidence for 2 pools of neurons linked to the 2 offers; instead, all comparison appears to occur within a single functionally homogenous pool of task-selective neurons. These observations suggest that economic choices reflect a context-dependent evaluation of attended options. Moreover, they raise the possibility that value representations reflect, to some extent, a tentative commitment to a choice.


Conflict of interest statement

The authors have declared that no competing interests exist.

Figures

Fig 1
Fig 1. Task structure, region of interest, and summary of behavior.
(A) Task: subjects chose between 2 asynchronously presented gambles and won or lost tokens accordingly. When subjects collected 6 or more tokens, they received a large liquid reward and token total reset to 0. (B) Behavior for each subject, fit to a sigmoid function. Subjects chose the left option more often as its value increased, as would be expected, given understanding of the task. (C) Neural responses were recorded from the dorsal banks of the anterior cingulate cortex (refer to Materials and methods). dACC, dorsal anterior cingulate cortex; EV, expected value of gamble.
Fig 2
Fig 2. Values of the 2 offers modulate firing rates of individual dACC neurons.
(A) Firing rate of 1 example neuron significantly modulated by the expected value of the first offer both when it was being presented (multiple linear regression: β = 0.041, p = 0.011) and when it was remembered (β = 0.051, p = 0.0097). (B) Example dACC neuron activity, significantly modulated by the value of the second offer while it was being presented (β = 0.046, p = 0.0061). (C) Percentage of neurons significantly tuned to the value of the first (red) and second (blue) offers through the course of the trial, using a multiple linear regression with a sliding 500-ms window. Data used to generate these plots can be found at https://doi.org/10.5061/dryad.h52f8. dACC, dorsal anterior cingulate cortex; EV, expected value of gamble.
Fig 3
Fig 3. Coding format for offer 1 in the first epoch is similar, regardless of whether it will be accepted or rejected, yet also weakly depends on the upcoming decision.
Results also hold when the outlier cell is removed. (A) Format analysis: (left) scatterplot of offer 1/epoch 1 regression coefficients for trials in which offer 1 is accepted (horizontal axis) versus rejected (vertical axis). Shaded error region indicates 99% credible interval, and dashed red lines indicate the 95% credible interval. The black dashed line indicates the level of correlation we would expect to see under a chance model (see main text and Materials and methods). (Middle) distribution of mean correlation coefficient of data. The mean of this distribution is represented as a red dashed line in the right panel. (Right) distribution of mean correlation coefficients expected under a chance model (black distribution) compared to the mean correlation observed in the data (red dashed line; permutation test with 1,000 permutations: p < 0.001). (B) Population analysis: (left) scatterplot of offer 1/epoch 1 absolute regression coefficients for trials in which offer 1 is accepted (horizontal axis) versus rejected (vertical axis). Shaded error region indicates 99% credible interval, and dashed red lines indicate the 95% credible interval. The black dashed line indicates the level of correlation we would expect to see under a chance model (see main text and Materials and methods). (Middle) distribution of mean correlation coefficient of data. The mean of this distribution is represented as a red dashed line in the right panel. (Right) distribution of the mean correlation coefficients expected under a chance model (black distribution) compared to the mean correlation observed in the data (red dashed line; permutation test with 1,000 permutations: p < 0.001). Data used to generate these plots can be found at https://doi.org/10.5061/dryad.h52f8.
Fig 4
Fig 4. Coding of offer 1 in the comparison epoch remains correlated across accept/reject conditions but with more dependence on the upcoming decision (for statistical comparison between format correlations, see Fig 5).
(A) Format analysis: (left) scatterplot of offer 1, epoch 2 regression coefficients for trials in which offer 1 is accepted (horizontal axis) versus rejected (vertical axis). Shaded error region indicates 99% credible interval, and dashed red lines indicate the 95% credible interval. The black dashed line indicates the level of correlation we would expect to see under a chance model (see main text and Materials and methods). (Middle) distribution of mean correlation coefficient of data. The mean of this distribution is represented as a red dashed line in the right panel. (Right) distribution of mean correlation coefficients expected under a chance model (black distribution) compared to the mean correlation observed in the data (red dashed line; permutation test with 1,000 permutations: p < 0.001). (B) Population analysis: (left) scatterplot of offer 1, epoch 2 absolute regression coefficients for trials in which offer 1 is accepted (horizontal axis) versus rejected (vertical axis). Shaded error region indicates 99% credible interval, and dashed red lines indicate the 95% credible interval. The black dashed line indicates the level of correlation we would expect to see under a chance model (see main text and Materials and methods). (Middle) distribution of mean correlation coefficient of data. The mean of this distribution is represented as a red dashed line in the right panel. (Right) distribution of mean correlation coefficients expected under a chance model (black distribution) compared to the mean correlation observed in the data (red dashed line; permutation test with 1,000 permutations: p < 0.001). Data used to generate these plots can be found at https://doi.org/10.5061/dryad.h52f8.
Fig 5
Fig 5. Encoding formats of offer value when the offer is later accepted versus rejected become successively more separable.
Shown above are the distributions of correlation coefficients between encoding formats of offers when they were later accepted versus rejected, for offer 1 in the first and second epochs and offer 2 in the second epoch. These distributions are all significantly different from each other (statistics reported in main text). Data used to generate these plots can be found at https://doi.org/10.5061/dryad.h52f8.
Fig 6
Fig 6. Coding of offer 2 in the comparison epoch is dependent on the upcoming decision (for statistical comparison between format correlations, see Fig 5).
Red lines indicate mean correlation, red shaded area indicates 99% credible intervals, red dashed lines indicate 95% credible intervals, and black dashed line indicates the correlation expected under a chance model. (A) Format analysis: (left) scatterplot of offer 2, epoch 2 regression coefficients for trials in which offer 2 is accepted (horizontal axis) versus rejected (vertical axis). (Middle) distribution of mean correlation coefficient of data. The mean of this distribution is represented as a red dashed line in the right panel. (Right) distribution of mean correlation coefficients expected under a chance model (black distribution) compared to the mean correlation observed in the data (red dashed line; permutation test with 1,000 permutations: p < 0.001). (B) Population analysis: (left) scatterplot of offer 2, epoch 2 absolute regression coefficients for trials in which offer 2 is accepted (horizontal axis) versus rejected (vertical axis). Shaded error region indicates 99% credible interval and dashed red lines indicate the 95% credible interval. The black dashed line indicates the level of correlation we would expect to see under a chance model (see main text and Materials and methods). (Middle) distribution of mean correlation coefficient of data. The mean of this distribution is represented as a red dashed line in the right panel. (Right) distribution of mean correlation coefficients expected under a chance model (black distribution) compared to the mean correlation observed in the data (red dashed line; permutation test with 1,000 permutations: p = 0.026). Data used to generate these plots can be found at https://doi.org/10.5061/dryad.h52f8.
Fig 7
Fig 7. Formats of encoding values of the 2 offers support a 1-pool architecture of value-based choice.
Red solid lines indicate mean correlation, red shaded area indicates 99% credible intervals, red dashed lines (in scatterplots) indicate 95% credible intervals, and black dashed lines indicate the correlation expected under a chance model. (A) Mutual inhibition during comparison: (top) scatterplot indicating the strength and direction of modulation in response to offer 1 and offer 2 (both during comparison) for each individual neuron in the population. The negative correlation indicates that neurons encode the values of the first and second offers in opposing formats during comparison. (Bottom) this correlation is significantly smaller than would be expected by chance (black distribution; permutation test with 1,000 permutations: p < 0.001). (B) Encoding of offer 1 value through time: (top) scatterplot indicating the strength and direction of modulation in response to offer 1 between the first and second epochs for each individual neuron in the population. The value of the first offer is encoded in correlated formats when it is attended (epoch 1) and when it is remembered (epoch 2). (Bottom) this correlation is not as strong as we would expect by chance (black dashed line; permutation test with 1,000 permutations: p = 0.038). This result holds when the outlier cell is removed. (C) Aligned encoding of attended offer values. (Top) scatterplot indicating the strength and direction of modulation in response to attended offers (offer 1 in the first epoch versus offer 2 in the second epoch). Values of attended offers are encoded in correlated formats across time, in contrast to 2-pool model predictions of mutual inhibition through time. (Bottom) this correlation is significantly larger than expected by chance (black distribution; permutation test with 1,000 permutations: p = 0.0060). This result holds when the outlier cell is removed. Data used to generate these plots can be found at https://doi.org/10.5061/dryad.h52f8.

References

    1. Krajbich I, Armel C, Rangel A. Visual fixations and the computation and comparison of value in simple choice. Nature neuroscience. 2010. October 1;13(10):1292–8. doi: 10.1038/nn.2635 - DOI - PubMed
    1. Krajbich I, Rangel A. Multialternative drift-diffusion model predicts the relationship between visual fixations and choice in value-based decisions. Proceedings of the National Academy of Sciences. 2011. August 16;108(33):13852–7. - PMC - PubMed
    1. Lim SL, O'Doherty JP, Rangel A. The decision value computations in the vmPFC and striatum use a relative value code that is guided by visual attention. Journal of Neuroscience. 2011. September 14;31(37):13214–23. doi: 10.1523/JNEUROSCI.1246-11.2011 - DOI - PMC - PubMed
    1. Boorman ED, Rushworth MF, Behrens TE. Ventromedial prefrontal and anterior cingulate cortex adopt choice and default reference frames during sequential multi-alternative choice. Journal of Neuroscience. 2013. February 6;33(6):2242–53. doi: 10.1523/JNEUROSCI.3022-12.2013 - DOI - PMC - PubMed
    1. Hunt LT, Woolrich MW, Rushworth MF, Behrens TE. Trial-type dependent frames of reference for value comparison. PLoS Comput Biol. 2013;9(9):e1003225 doi: 10.1371/journal.pcbi.1003225 - DOI - PMC - PubMed