. 2017 Nov 15;12(11):e0181025.
doi: 10.1371/journal.pone.0181025. eCollection 2017.

CSF in the ventricles of the brain behaves as a relay medium for arteriovenous pulse wave phase coupling

Affiliations

CSF in the ventricles of the brain behaves as a relay medium for arteriovenous pulse wave phase coupling

William E Butler et al. PLoS One. .

Abstract

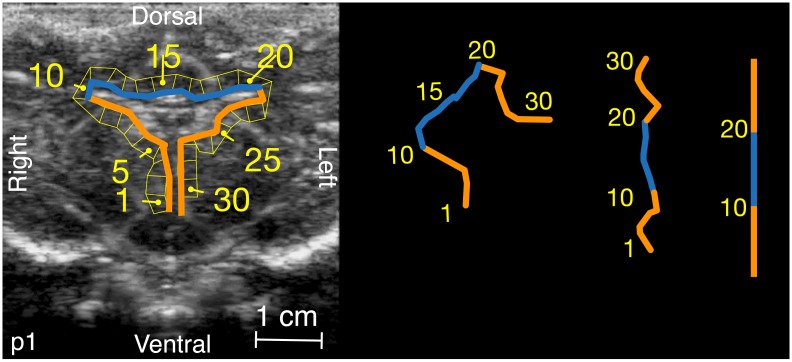
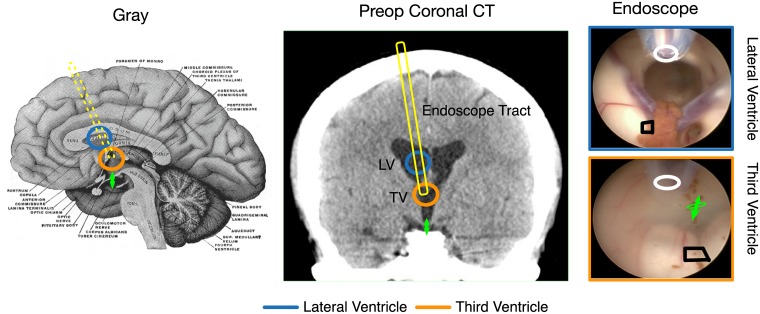
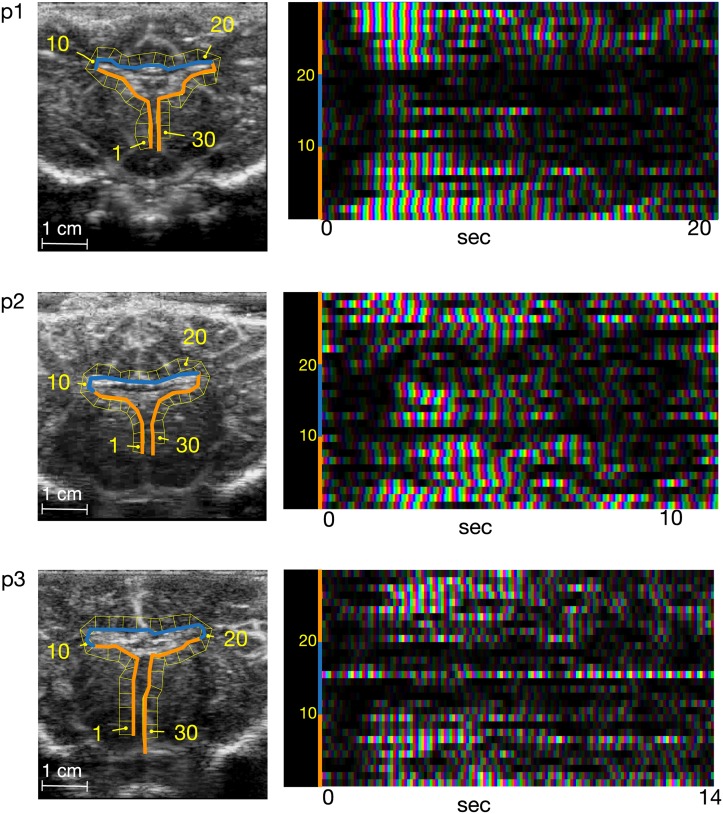
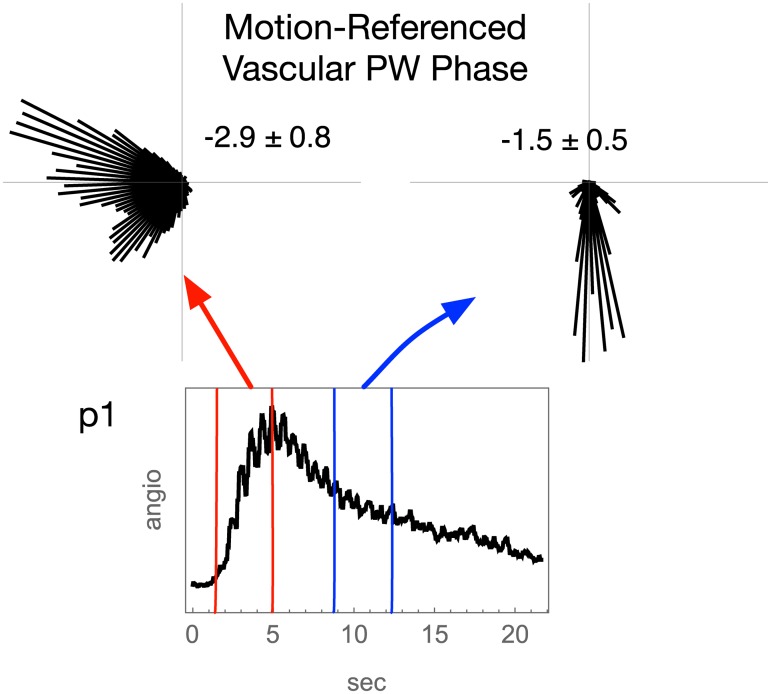
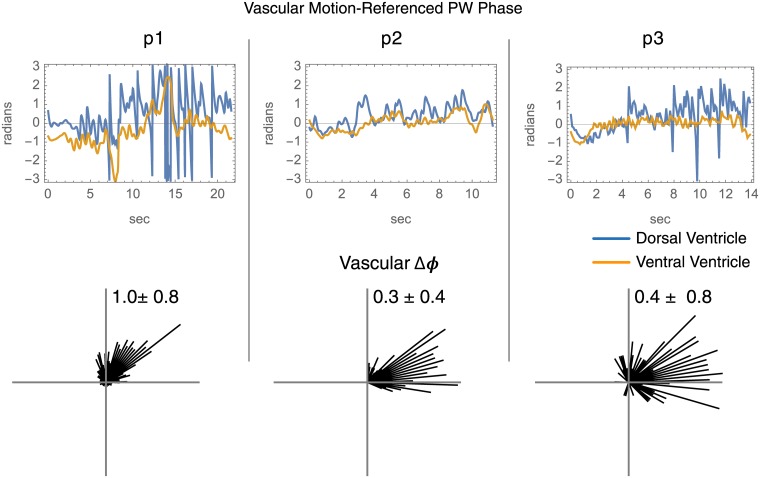
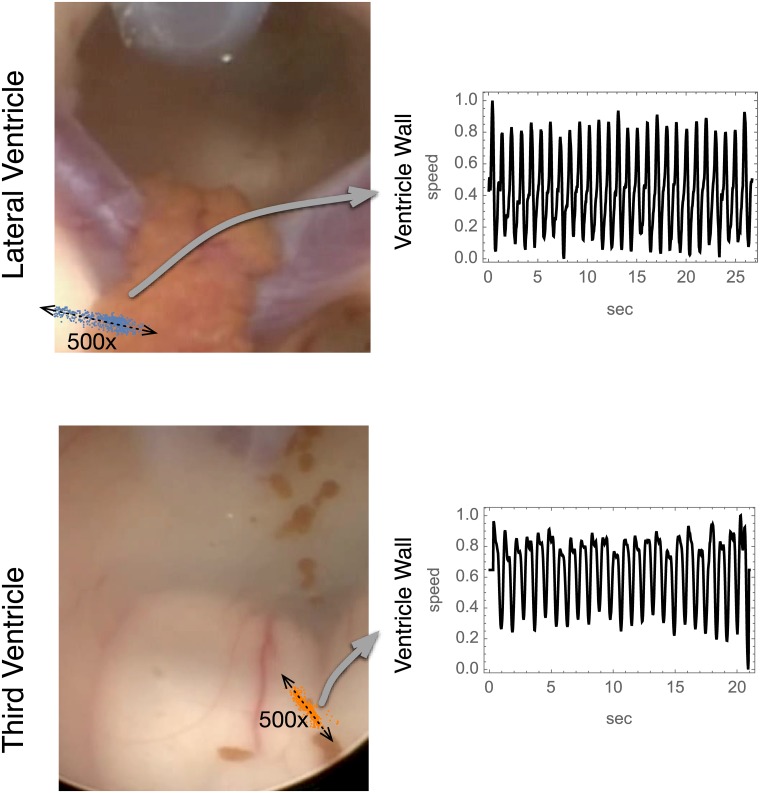
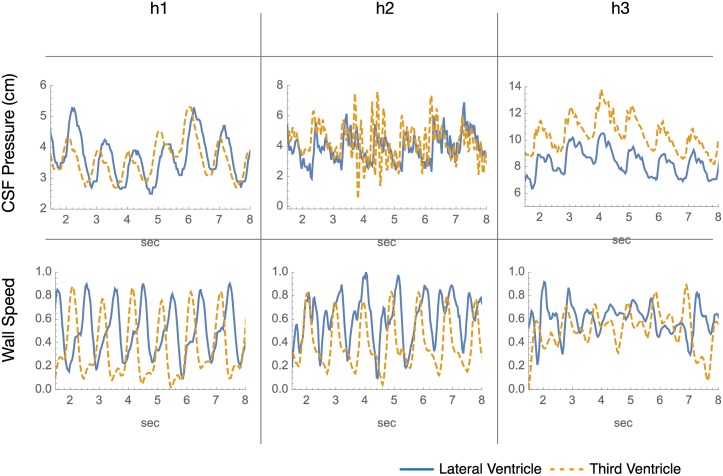
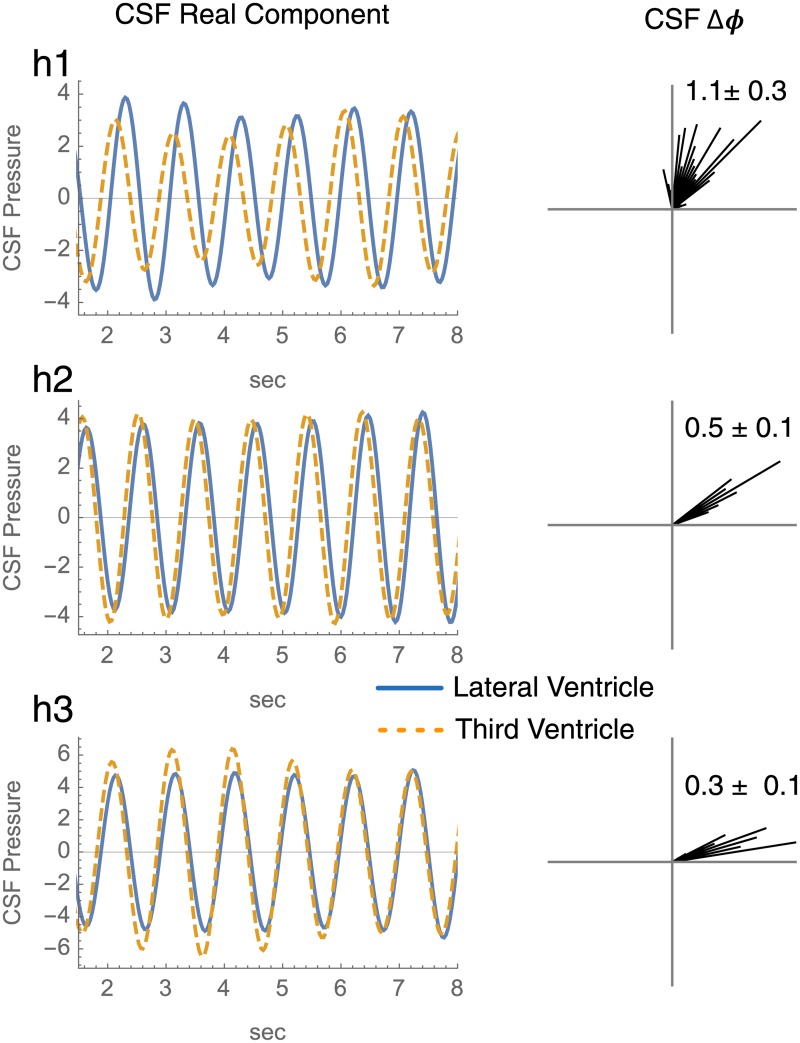
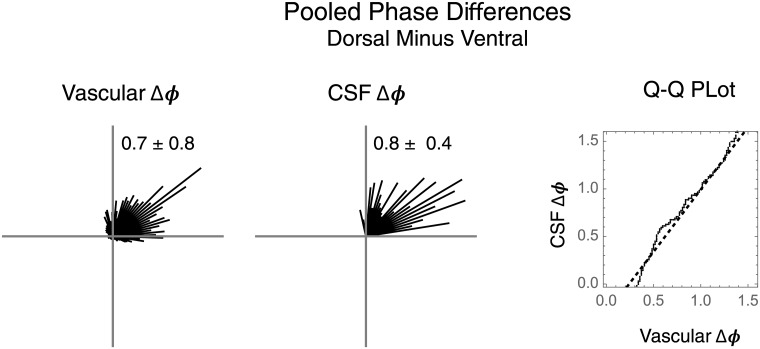
The ventricles of the brain remain perhaps the largest anatomic structure in the human body without established primary purpose, even though their existence has been known at least since described by Aristotle. We hypothesize that the ventricles help match a stroke volume of arterial blood that arrives into the rigid cranium with an equivalent volume of ejected venous blood by spatially configuring cerebrospinal fluid (CSF) to act as a low viscosity relay medium for arteriovenous pulse wave (PW) phase coupling. We probe the hypothesis by comparing the spatiotemporal behavior of vascular PW about the ventricular surfaces in piglets to internal observations of ventricle wall motions and adjacent CSF pressure variations in humans. With wavelet brain angiography data obtained from piglets, we map the travel relative to brain pulse motion of arterial and venous PWs over the ventricle surfaces. We find that arterial PWs differ in CF phase from venous PWs over the surfaces of the ventricles consistent with arteriovenous PW phase coupling. We find a spatiotemporal difference in vascular PW phase between the ventral and dorsal ventricular surfaces, with the PWs arriving slightly sooner to the ventral surfaces. In humans undergoing neuroendoscopic surgery for hydrocephalus, we measure directly ventricle wall motions and the adjacent internal CSF pressure variations. We find that CSF pressure peaks slightly earlier in the ventral Third Ventricle than the dorsal Lateral Ventricle. When matched anatomically, the peri-ventricular vascular PW phase distribution in piglets complements the endo-ventricular CSF PW phase distribution in humans. This is consistent with a role for the ventricles in arteriovenous PW coupling and may add a framework for understanding hydrocephalus and other disturbances of intracranial pressure.


Conflict of interest statement

Competing Interests: The authors have declared that no competing interests exist.

Figures

Fig 1
Fig 1. Peri-ventricular polygons.
The orientation and segment lengths of the inner line are preserved during the rotation and unwinding.
Fig 2
Fig 2. Lateral and third ventricle orientation in human endoscopic third ventriculostomy.
Annotated drawing from Gray and Carter (left), coronal CT from h1 (middle), and endoscope views within the Lateral and Third Ventricles (right). The approximate Lateral Ventricle position is in turquoise, Third Ventricle position in orange, endoscope tract is in yellow, and the green arrow gives the therapeutic fenestration site. In the endoscope views the black polygons give the motion tracking region and the white ovals give the catheter tip positions for CSF pressure transduction.
Fig 3
Fig 3. Peri-ventricular vascular pulse waves.
The surface of the ventricle wall (first column) is unfolded to give the vertical axis of the running CF profile. The horizontal axis is time. Individual vascular PWs over the ventricular surfaces can be resolved.
Fig 4
Fig 4. Peri-ventricular arterial and venous PW phase for p1.
An angiographic time-intensity curve for the ventricular surface shows the inflow (arterial) and outflow (venous) segments of the bolus passage. Circular histograms pf vascular PW relative to brain pulse motion from arterial and venous segments of angiographic bolus travel (top row). The vascular PW phase data are from the wavelet vascular PW piglet images employing a time slice range of about 5 heartbeats as indicated by the red and blue line pairs in the angiographic time intensity curve (middle row). The angular mean and standard deviation are reported.
Fig 5
Fig 5. Peri-ventricular PW phase.
The complex-valued vascular complex-valued PW data from the ventral (orange) and dorsal (turquoise) surfaces are referenced to pulse motion. In the upper row phase is plotted versus time for the dorsal and ventral peri-ventricular zones. The bottom row shows circular histograms of the phase differences between the two zones.
Fig 6
Fig 6. Ventricle wall velocity scattergrams superimposed On Neuro-Endoscopy images.
This scattergram superposition illustrates the direction of ventricle wall motions in relation to anatomy. For clarity the wall excursions are lengthened by 500x. The one-dimensional wall speed is obtained from projecting the two-dimensional wall speed vectors onto the major axis of the scattergram indicated in each case by a dashed double arrow.
Fig 7
Fig 7. CSF pressure and wall speed in lateral and third ventricles.
The waveforms in this Fig for the Lateral and Third Ventricles have been cardiac synchronized. To aid visual wave comparison the time span is reduced and baselines adjusted.
Fig 8
Fig 8. Phase differences of CSF pressure waveforms between lateral and third ventricles in humans after cardiac synchronization.
The left column gives a limited duration of the real components of the Gabor wavelet filtered Lateral (turquoise) and Third Ventricle (orange) CSF pressure waveforms. The right gives the a histogram for the phase differences in each. The angular values are given in radians as mean ± standard deviation.
Fig 9
Fig 9. Dorsal-ventral pooled phase differences.
The piglet vascular PW phase differences are pooled from Fig 5. The human CSF phase differences are pooled from Fig 8. The angular mean and standard deviation are reported. The vascular and CSF phases distributions are matched by quantile to give the Q-Q plot.

References

    1. Wilson MH. Monro-Kellie 2.0: The dynamic vascular and venous pathophysiological components of intracranial pressure. Journal of Cerebral Blood Flow & Metabolism. 2016;36(8):1338–1350. doi: 10.1177/0271678X16648711 - DOI - PMC - PubMed
    1. Butler WE. Wavelet Brain Angiography Suggests Arteriovenous Pulse Wave Phase Locking. PloS ONE. doi: 10.1371/journal.pone0187014 - DOI - PMC - PubMed
    1. Aristotle. Historia Animalium. http://classics.mit.edu/Aristotle/historyanim.mb.txt; 350.
    1. Meairs S, Alonso A. Ultrasound, microbubbles and the blood-brain barrier. Progress in Biophysics and Molecular Biology. 2007;93(1-3):354–362. doi: 10.1016/j.pbiomolbio.2006.07.019 - DOI - PubMed
    1. Saikali S, Meurice P, Sauleau P, Eliat PA, Bellaud P, Randuineau G, et al. A three-dimensional digital segmented and deformable brain atlas of the domestic pig. Journal of Neuroscience Methods. 2010;192(1):102–109. doi: 10.1016/j.jneumeth.2010.07.041 - DOI - PubMed

LinkOut - more resources