. 2018 Feb;38(2):212-224.
doi: 10.1177/0272989X17738753. Epub 2017 Nov 15.

Using Observational Data to Calibrate Simulation Models

Affiliations

Using Observational Data to Calibrate Simulation Models

Eleanor J Murray et al. Med Decis Making. 2018 Feb.

Abstract

Background: Individual-level simulation models are valuable tools for comparing the impact of clinical or public health interventions on population health and cost outcomes over time. However, a key challenge is ensuring that outcome estimates correctly reflect real-world impacts. Calibration to targets obtained from randomized trials may be insufficient if trials do not exist for populations, time periods, or interventions of interest. Observational data can provide a wider range of calibration targets but requires methods to adjust for treatment-confounder feedback. We propose the use of the parametric g-formula to estimate calibration targets and present a case-study to demonstrate its application.

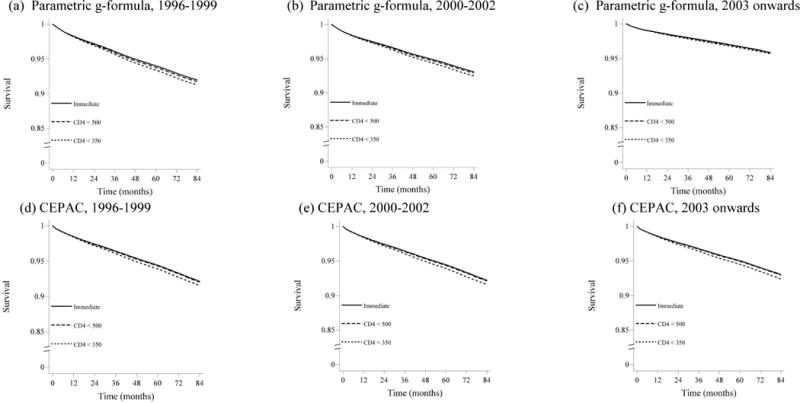
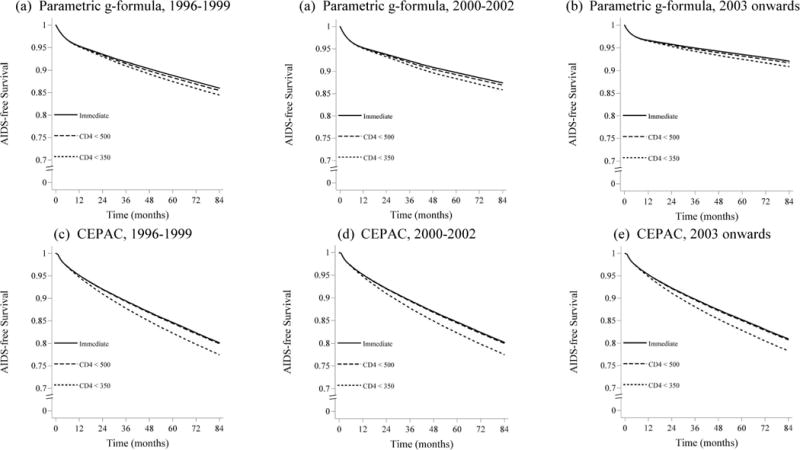
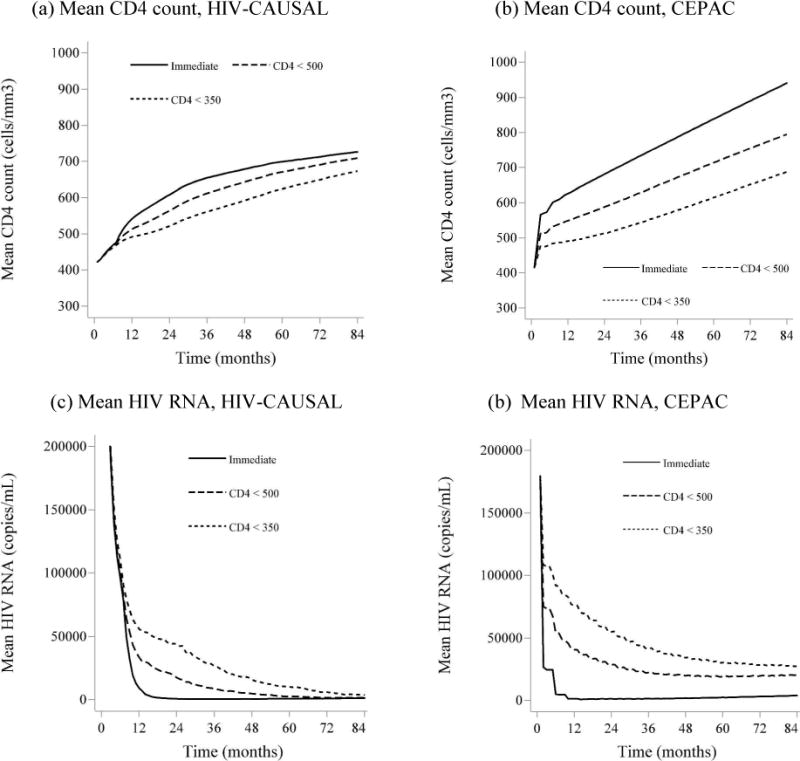
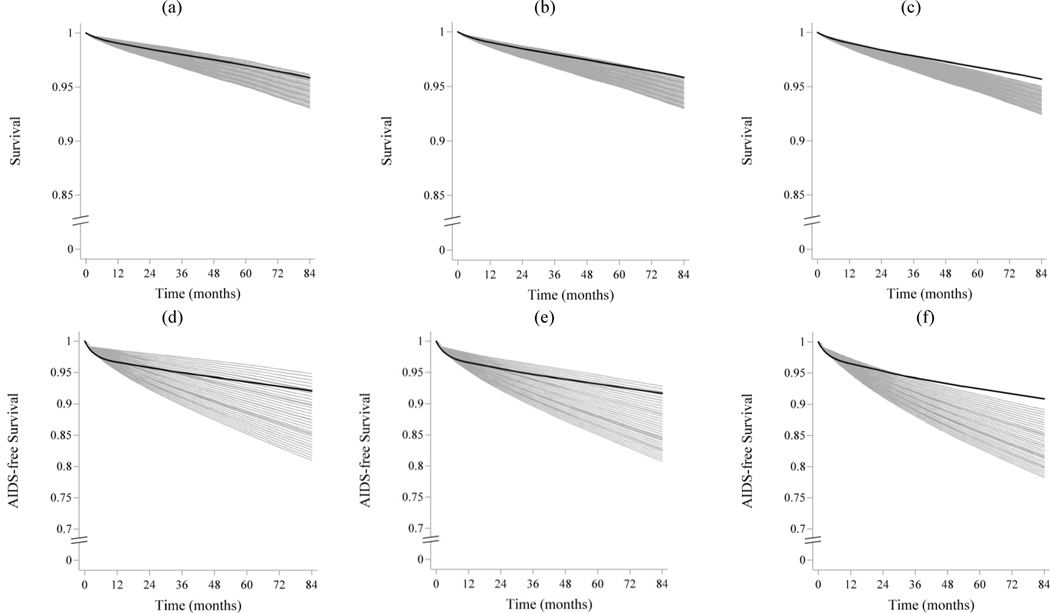
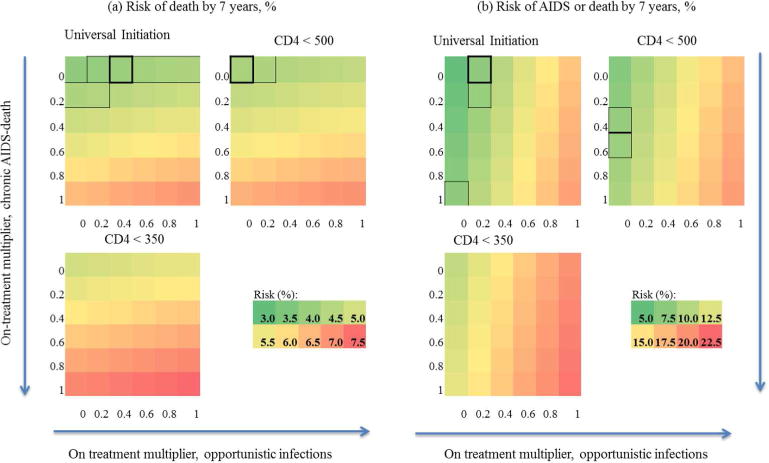
Methods: We used the parametric g-formula applied to data from the HIV-CAUSAL Collaboration to estimate calibration targets for 7-y risks of AIDS and/or death (AIDS/death), as defined by the Center for Disease Control and Prevention under 3 treatment initiation strategies. We compared these targets to projections from the Cost-effectiveness of Preventing AIDS Complications (CEPAC) model for treatment-naïve individuals presenting to care in the following year ranges: 1996 to 1999, 2000 to 2002, or 2003 onwards.

Results: The parametric g-formula estimated a decreased risk of AIDS/death over time and with earlier treatment. The uncalibrated CEPAC model successfully reproduced targets obtained via the g-formula for baseline 1996 to 1999, but over-estimated calibration targets in contemporary populations and failed to reproduce time trends in AIDS/death risk. Calibration to g-formula targets improved CEPAC model fit for contemporary populations.

Conclusion: Individual-level simulation models are developed based on best available information about disease processes in one or more populations of interest, but these processes can change over time or between populations. The parametric g-formula provides a method for using observational data to obtain valid calibration targets and enables updating of simulation model inputs when randomized trials are not available.

Keywords: HIV; agent-based model; calibration; g-formula.


Figures

Figure A1
Figure A1
Survival distribution stratified by baseline time period and antiretroviral therapy initiation strategy estimated using the parametric g-formula applied to HIV-CAUSAL data and using the original CEPAC parameterization. (a)Baseline from Jan 1, 1996 – Dec 31, 1999, parametric g-formula; (b) Baseline from Jan 1, 2000 – Dec 31, 2002, parametric g formula; (c) Baseline on or after Jan 1, 2003, parametric g-formula; (d) Baseline from Jan 1, 1996 – Dec 31, 1999, CEPAC; (e) Baseline from Jan 1, 2000 – Dec 31, 2002, CEPAC; (f) Baseline on or after Jan 1, 2003, CEPAC. All CEPAC estimates use initial parameterization of 1.0 for on-ART multipliers of opportunistic infection incidence and chronic AIDS-related mortality. CEPAC: Cost-Effectiveness of Preventing AIDS Complications model
Figure A2
Figure A2
AIDS-free survival baseline time period and antiretroviral therapy initiation strategy estimated using the parametric g-formula applied to HIV-CAUSAL data and using the original CEPAC parameterization. (a) Baseline from Jan 1, 1996 – Dec 31, 1999, parametric g-formula; (b) Baseline from Jan 1, 2000 – Dec 31, 2002, parametric g-formula; (c) Baseline on or after Jan 1, 2003, parametric g-formula; (d) Baseline from Jan 1, 1996 – Dec 31, 1999, CEPAC; (e) Baseline from Jan 1, 2000 – Dec 31, 2002, CEPAC; (f) Baseline on or after Jan 1, 2003, CEPAC. All CEPAC estimates use initial parameterization of 1.0 for on-ART multipliers of opportunistic infection incidence and chronic AIDS-related mortality. CEPAC: Cost-Effectiveness of Preventing AIDS Complications model
Figure A3
Figure A3
Mean of the main study variables under no intervention when outcome is mortality: observed (solid line) and estimated via the parametric g-formula (dotted line). HIV-CAUSAL Collaboration, on or after Jan 1, 2003. (a) Cumulative incidence of death; (b) Cumulative incidence of AIDS; (c) Mean proportion on treatment; (d) Mean CD4 count, natural log scale; (e) Mean HIV RNA.
Figure A4
Figure A4
Mean of the main study variables under no intervention when outcome is mortality: observed (solid line) and estimated via the parametric g-formula (dotted line). HIV-CAUSAL Collaboration, Jan 1, 2000 – Dec 31, 2002. (a) Cumulative incidence of death; (b) Cumulative incidence of AIDS; (c) Mean proportion on treatment; (d) Mean CD4 count, natural log scale; (e) Mean HIV RNA, natural log scale.
Figure A5
Figure A5
Mean of the main study variables under no intervention when outcome is mortality: observed (solid line) and estimated via the parametric g-formula (dotted line). HIV-CAUSAL Collaboration, Jan 1, 1996 – Dec 31, 1999. (a) Cumulative incidence of death; (b) Cumulative incidence of AIDS; (c) Mean proportion on treatment; (d) Mean CD4 count, natural log scale; (e) Mean HIV RNA, natural log scale.
Figure A6
Figure A6
Mean of CD4 count and HIV RNA under intervention Estimating using CEPAC and via the parametric g-formula in HIV-CAUSAL Collaboration, using baseline on or after Jan 1, 2003. All CEPAC estimates use initial parameterization of 1.0 for multipliers. (a) Mean CD4 count in HIV-CAUSAL (cells/μl); (b) Mean CD4 count in CEPAC (cells/μl); (c) Mean HIV RNA in HIV-CAUSAL (copies/mL); (d) Mean HIV RNA in CEPAC (copies/mL).
Figure 1
Figure 1
Survival and AIDS-free survival over follow-up estimated via the parametric g-formula applied to HIV-CAUSAL data and each of 36 CEPAC calibration runs, varying on-treatment multipliers for opportunistic infection incidence and chronic AIDS-related mortality from 0 to 1 by 0.2. CEPAC calibration runs (grey);, parametric g-formula estimates (black). All runs have baseline on or after Jan 1, 2003. Survival (a–c), AIDS-free survival (d–f). Immediate universal treatment initiation(a,d); Initiation at CD4 <500 cells/μl(b,e); and Initiation at CD4 <350 cells/μl(c,f). CEPAC: Cost-Effectiveness of Preventing AIDS Complications model.
Figure 2
Figure 2
7-year mortality (a) and combined mortality/AIDS risk (b) from CEPAC calibration runs for baseline on or after Jan 1, 2003, varying on-ART multipliers for chronic AIDS-related mortality and opportunistic infections from 0 to 1 by 0.2, stratified by treatment strategy. Scales for each outcome shown below the strategy ‘CD4 < 500’. On-treatment multiplier for chronic AIDS-related mortality increases from 0 to 1 down y-axis, on-treatment multiplier for opportunistic infections increases from 0 to 1 across x-axis, following direction of arrows. Black boxes indicate closest matchs to parametric g-formula estimates when baseline is on or after Jan 1, 2003; grey boxes indicate 95% confidence interval for parametric g-formula using 500 bootstrap samples. For the strategy ‘treat at CD4 < 350’, no CEPAC runs resulted in risk estimates within the g-formula 95% confidence intervals for either outcome. CEPAC: Cost-Effectiveness of Preventing AIDS Complications model.

References

    1. Marshall BDL, Galea S. Formalizing the role of agent-based modeling in causal inference and epidemiology. American Journal of Epidemiology. 2015;181(2):92–9. doi: 10.1093/aje/kwu274. - DOI - PMC - PubMed
    1. Abuelezam NN, Rough K, Seage GR., 3rd Individual0based simulation models of HIV transmission: reporting quality and recommendations. PLoS One. 2013;8(9):e75624. doi: 10.1371/journal.pone.0075624. Epub 2013/10/08. - DOI - PMC - PubMed
    1. Siebert U, Alagoz O, Bayoumi AM, Jahn B, Owens DK, Cohen DJ, et al. State-transition modeling: a report of the ISPOR-SMDM modeling good research practices task force-3. Value in Health. 2012;15(6):812–20. doi: 10.1016/j.jval.2012.06.014. Epub 2012/09/25. - DOI - PubMed
    1. Weinstein MC, O’Brien B, Hornberger J, Jackson J, Johannesson M, McCabe C, et al. Principles of good practice for decision analytic modeling in health-care evaluation: report of the ISPOR task force on good research practices–modeling studies. Value in Health. 2003;6(1):9–17. Epub 2003/01/22. - PubMed
    1. Eddy DM, Hollingworth W, Caro JJ, Tsevat J, McDonald KM, Wong JB. Model transparency and validation: a report of the ISPOR-SMDM modeling good research practices task force-7. Value in Health. 2012;15(6):843–50. doi: 10.1016/j.jval.2012.04.012. - DOI - PubMed

Publication types

LinkOut - more resources