. 2017 Nov 14;21(7):1953-1967.
doi: 10.1016/j.celrep.2017.10.021.

A Comprehensive Patient-Derived Xenograft Collection Representing the Heterogeneity of Melanoma

Affiliations

A Comprehensive Patient-Derived Xenograft Collection Representing the Heterogeneity of Melanoma

Clemens Krepler et al. Cell Rep. .

Abstract

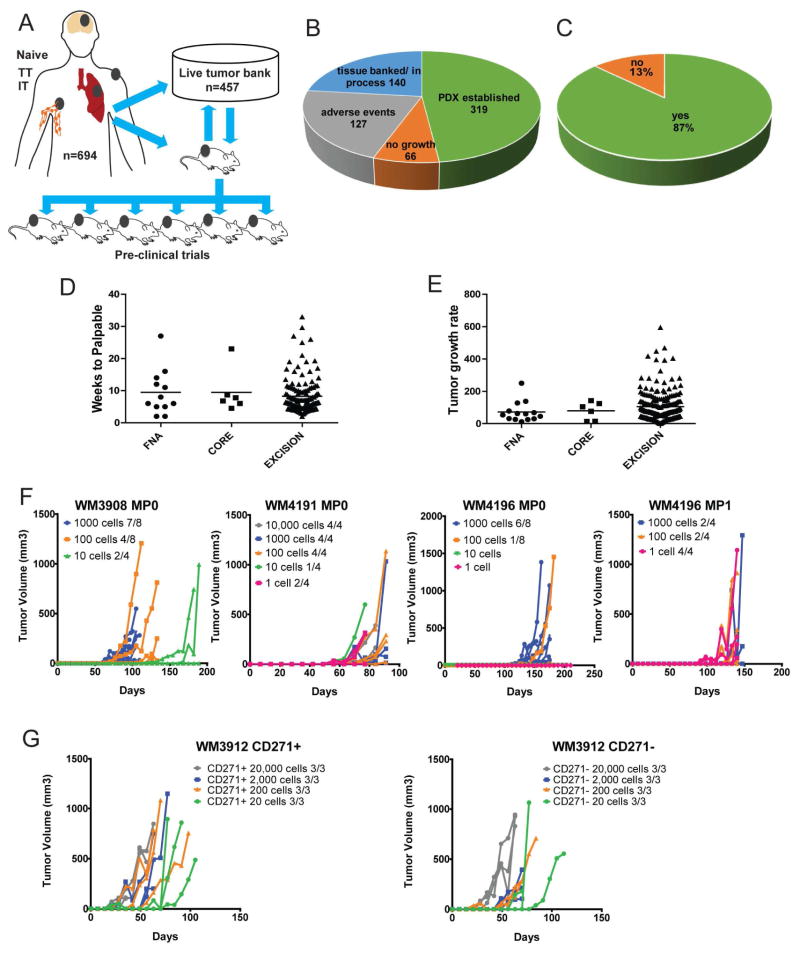
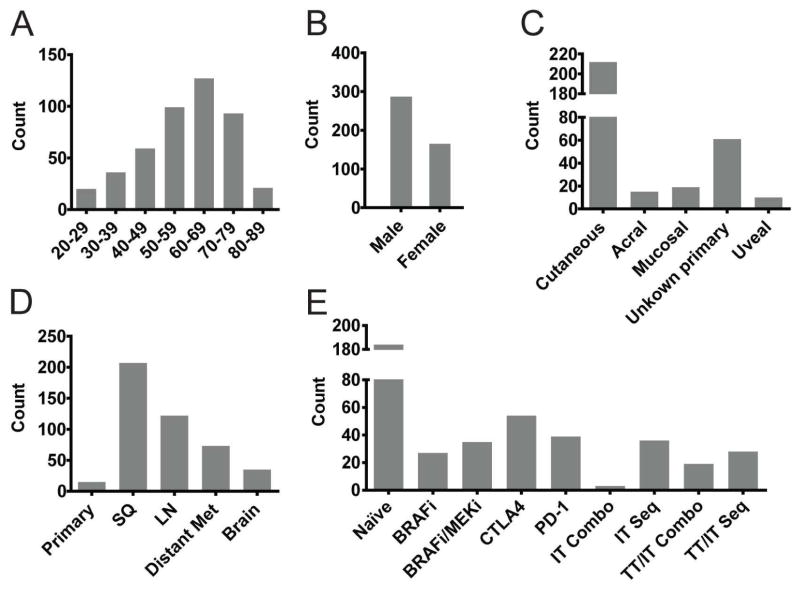
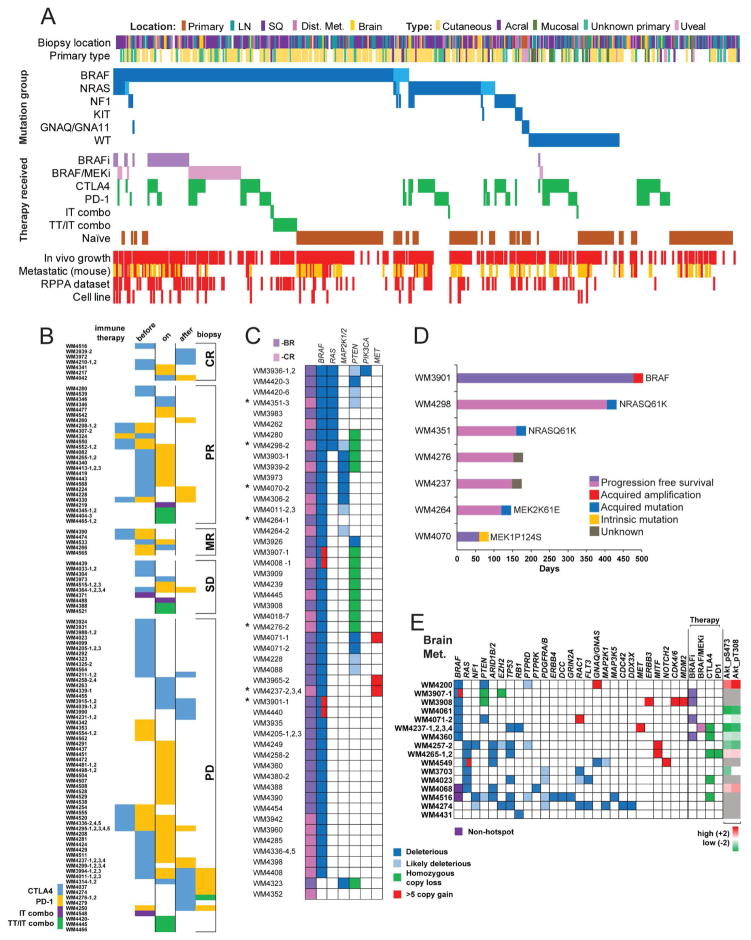
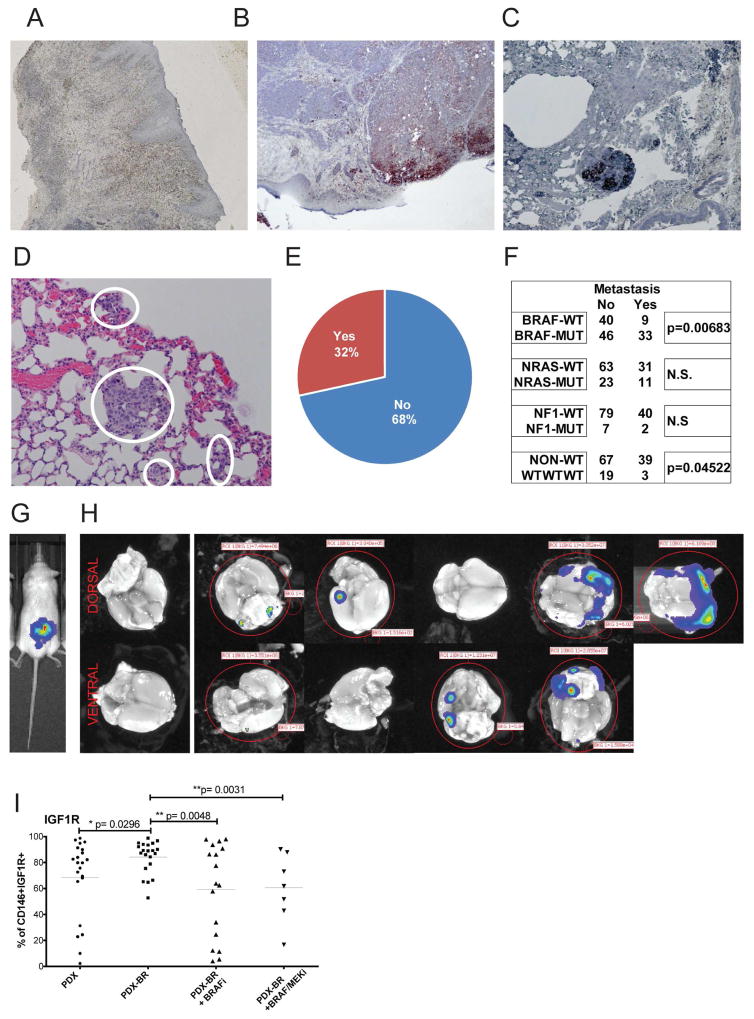
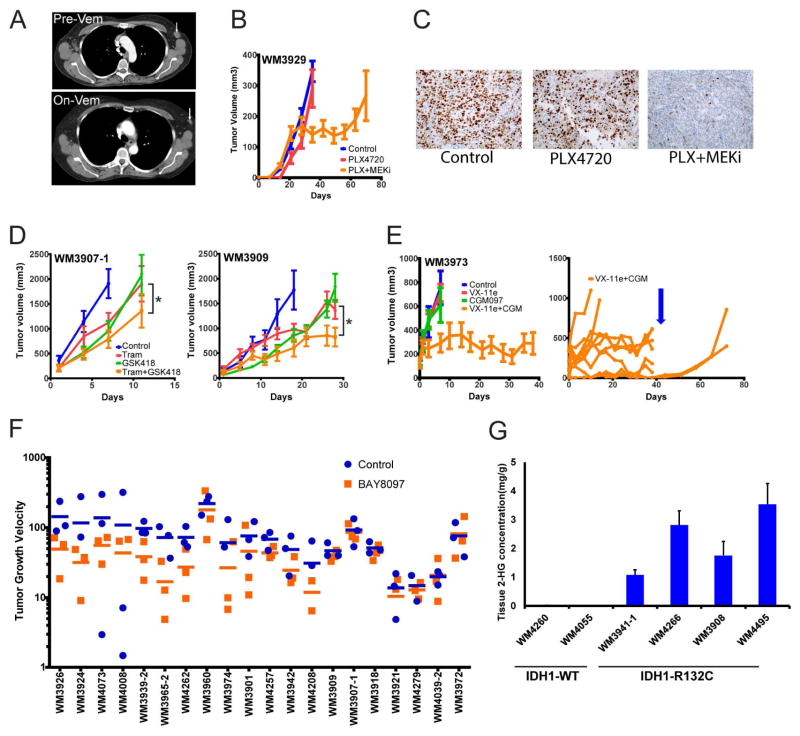
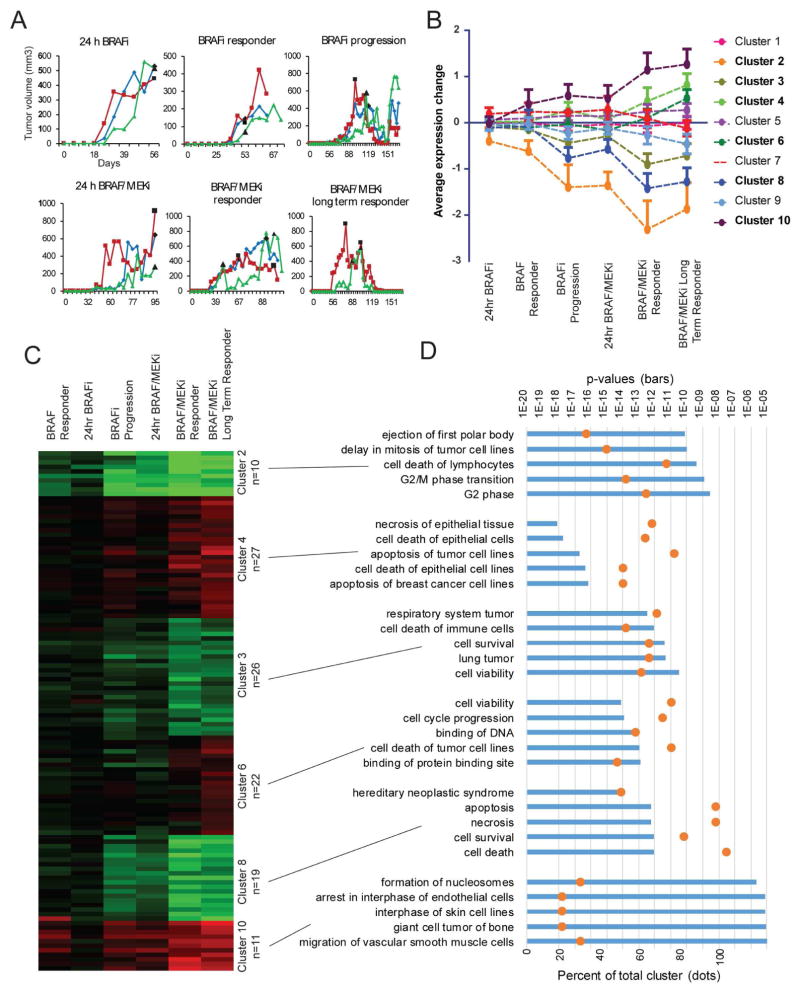
Therapy of advanced melanoma is changing dramatically. Following mutational and biological subclassification of this heterogeneous cancer, several targeted and immune therapies were approved and increased survival significantly. To facilitate further advancements through pre-clinical in vivo modeling, we have established 459 patient-derived xenografts (PDX) and live tissue samples from 384 patients representing the full spectrum of clinical, therapeutic, mutational, and biological heterogeneity of melanoma. PDX have been characterized using targeted sequencing and protein arrays and are clinically annotated. This exhaustive live tissue resource includes PDX from 57 samples resistant to targeted therapy, 61 samples from responders and non-responders to immune checkpoint blockade, and 31 samples from brain metastasis. Uveal, mucosal, and acral subtypes are represented as well. We show examples of pre-clinical trials that highlight how the PDX collection can be used to develop and optimize precision therapies, biomarkers of response, and the targeting of rare genetic subgroups.

Keywords: BRAF inhibitor resistance; ERK inhibitor; MDM2 inhibitor; PI3K beta inhibitor; immune checkpoint blockade; in vivo models; melanoma; melanoma brain metastasis; patient-derived xenografts; targeted therapy.


Figures

Figure 1
Figure 1. Establishment and biology of PDX models
(A) A total of 694 melanoma tissue samples from naïve, pre-, on-, or post- therapy time points receiving targeted kinase inhibitors (TT) or immune checkpoint inhibitors (IT) were used to generate PDX and/or banked as live tissue. (B) Success rate of establishing a tumor graft (green), banking of live tissue with the potential of establishing a PDX or establishment in progress (blue), no tumor growth at 6 to 12 months (orange), adverse events (gray) where we were not able to establish a PDX due to reasons other than tumor take (this analysis excludes uveal primary samples). (C) Take rate of cutaneous melanoma derived tissue. (D) Time to palpable for all FNA, core, and excisional biopsy patient samples. (E) Tumor growth rate comparison of FNA, core, and biopsies. Growth was calculated as tumor volume/weeks. (F) Fresh tumor biopsies (MP0) or PDX after MP1 from three patients were prepared as cell suspensions, leucocytes and endothelial cells excluded and injected s.c. into NSG mice at indicated cell numbers. (G) Single cell suspension was prepared as before and sorted for CD271 marker. CD271+ and negative cells were injected at indicated cell numbers.
Figure 2
Figure 2. Demographics of patient samples used to generate PDX
(A) Age of patients at time of biopsy in 10-year increments. (B) Gender of patients. (C) Primary tumor type. (D) Site of tissue biopsy; categorized into primary melanoma, subcutaneous metastasis (SQ), lymph node metastasis (LN), distant metastasis to organs (Distant met), and brain metastasis (Brain). (E) Targeted kinase or immune checkpoint inhibitor therapies the patient had received before or during the biopsy was taken. Samples without available data were excluded from the analysis.
Figure 3
Figure 3. Overview of PDX collection, immune therapy, targeted therapy resistant, and brain metastasis derived subsets
(A) All PDX and live frozen tissue samples sorted by driver mutations and therapy received by the patients. Driver mutations are dark blue for hotspot and light blue for non-hotspot mutation. PDX from patients progressed on targeted therapies are shades of purple, patients treated with immune checkpoint inhibitors are green: sequential, combination CTLA4+PD-1 (IT combo), or combination with BRAF inhibition (TT/IT combo). Red indicates in vivo growth, presence of RPPA data, or a corresponding cell line. Samples that spontaneously metastasize to lungs in mice are red, yellow indicates no lung metastasis, white was not assessed. (B) Patients were treated with CTLA4 or PD-1 blocking therapy before, during, or after biopsy. Combination therapies are indicated. PDX are sorted by best response in the patients. Additional PDX with unknown response are not shown. (C) Genetic data of BRAF (−BR) and BRAF/MEK (−CR) inhibitor-resistant PDX. Deleterious and likely deleterious mutations, homozygous loss, and high copy number gains (>5) are shown. Numbering after dash (1–4) indicate additional PDX available from the same patient. Asterisks indicate resistant PDX with available patient matched pre-therapy derived PDX.(D) Patient matched pre- and post-therapy PDX models. Progression free survival of patients treated with BRAF or BRAF/MEK inhibitor (x-axis). Columns are labeled with putative resistance mechanisms. (E) Genetic profile and therapy received of 22 PDX with available sequencing data out of 31 total brain metastasis PDX. Deleterious and likely deleterious mutations, homozygous loss, and high copy number gains (>5) are shown. As an indication of PI3K pathway activation status RPPA levels of phosphorylated AKT are shown.
Figure 4
Figure 4. Melanoma PDX metastasize spontaneously
(A) Animals were grafted with neonatal foreskin grafts and melanoma PDX cells were injected into established grafts. (B) Melanoma lesions formed in the human skin reconstructs. (C) Melanomas spontaneously metastasized to the mouse lungs from the human skin graft. H&E staining, and representative images. (D) Example of spontaneous micro-metastasis to lung. (E) Percentage of PDX that metastasize to lungs in more than 80% of animals from the subcutaneous tumor graft at the time point of maximal tumor volume. (F) Number of PDX with spontaneous lung metastasis compared to main mutational subgroups. (G) Luciferase transfected brain metastasis PDX injected s.c.. (H) Spontaneous metastases to the mouse brain were imaged ex vivo after a latency of 120 days after survival surgery. (I) Percentage of IGF1R positive cells in PDX from naïve patients, from patients progressed on BRAF inhibitor (−BR), on BRAF inhibitor or BRAF/MEKi combination diet.
Figure 5
Figure 5. PDX models in pre-clinical trials
(A) Computerized tomography scans of patient with early relapse on vemurafenib whose tumor was used to generated a PDX from a pre-therapy LN metastasis. Arrow indicates the lymph node metastasis biopsied, imaged before and 3 months on vemurafenib therapy. (B) The PDX bearing mice were fed a chemical additive diet containing PLX4720 200ppm as single agent or in combination with PD-0325901 7ppm (PLX+MEKi). The combination diet inhibited the PDX tumors’ growth, followed by early on-therapy relapse. (C) Ki67 staining indicating actively proliferating cells from tumor grafts on indicated treatments. (D) Two PDX models from patients relapsed on BRAF inhibition (n=10/group) were treated with chemical addictive diet containing the MEK inhibitor trametinib 2.1ppm (Tram), the PI3K beta inhibitor GSK231418 214.3ppm (GSK418) or the combination of both. (*) The combination significantly inhibited tumor growth over single agents in both models. (E) PDX model from a BRAF-V600E patient relapsed on vemurafenib (PFS 46 weeks, best response stable disease) that had an additional activating MEK mutation, TP53 WT, and a biomarker signature indicating sensitivity to p53 re-activation. PDX tumors (n=10/group) were treated with the ERK inhibitor BVD-523 50mg/kg twice daily oral gavage, the MDM2 inhibitor CGM097 100mg/kg once daily oral gavage, or the combination of both. (E, right panel) Single mouse growth curves of the BVD-523 + CGM treated group highlighting the heterogeneity of response in PDX models. While most tumors showed stable disease, two mice had early relapse and two mice had complete responses (CR). Dosing was stopped on day 38 (blue arrow) and the 2 CR mice showed regrowth of residual disease. (F) Twenty PDX of BRAFV600 mutant patients (naïve and BRAF inhibitor resistant), NRAS mutant, and BRAF-WT NRAS-WT (n=5 models each) were treated with the BET inhibitor BAY8097 10mg/kg once daily oral gavage (orange) or vehicle control (n=3/group, blue) in a rapid in vivo screen. Although variability within the PDX models was high, tumor growth velocity was decreased in a subset of models. Response was independent of mutation status. (G) IDH1 mutant PDX have increased 2-HG onco-metabolite levels in tumor tissue compared to IDH1 WT PDX.
Figure 6
Figure 6. Protein pathway activation over time and in response to MAPK inhibition
WM4007 was generated from a pre-BRAF inhibitor therapy biopsy. (A) PDX growth curves for mice treated with PLX4720 (BRAFi) or PLX4720+PD-0325901 (BRAF/MEKi) diet started at time points indicated by black data points. (B) Protein expression change patterns identified in RPPA data with K means clustering. All proteins within each cluster are averaged and standard deviation shown. Clusters in bold had variation above 0.1 and were analyzed further. (C) Hierarchical clustering of RPPA data normalized to controls depicting the significant K means clusters along each time point. (D) Ingenuity Pathway Analysis (IPA) was used to assign proteins within each cluster into distinct biological processes. The top five significant gene ontology terms within each cluster are displayed with bars, top axis. The percentage of each cluster’s proteins found within each biological functional category are displayed with orange dots, bottom axis.

References

    1. Alexandrov LB, Nik-Zainal S, Wedge DC, Aparicio SA, Behjati S, Biankin AV, Bignell GR, Bolli N, Borg A, Borresen-Dale AL, et al. Signatures of mutational processes in human cancer. Nature. 2013;500:415–421. - PMC - PubMed
    1. Arafeh R, Qutob N, Emmanuel R, Keren-Paz A, Madore J, Elkahloun A, Wilmott JS, Gartner JJ, Di Pizio A, Winograd-Katz S, et al. Recurrent inactivating RASA2 mutations in melanoma. Nat Genet. 2015;47:1408–1410. - PMC - PubMed
    1. Atefi M, von Euw E, Attar N, Ng C, Chu C, Guo D, Nazarian R, Chmielowski B, Glaspy JA, Comin-Anduix B, et al. Reversing melanoma cross-resistance to BRAF and MEK inhibitors by co-targeting the AKT/mTOR pathway. PLoS ONE. 2011;6:e28973. - PMC - PubMed
    1. Bedard P, Tabernero J, Kurzrock R, Britten CD, Stathis A, Perez-Garcia JM, Zubel A, Le NT, Carter K, Bellew KM, et al. A phase lb, open-label, multicenter, dose-escalation study of the oral pan-PI3K inhibitor BKM120 in combination with the oral MEK1/2 inhibitor GSK1120212 in patients (pts) with selected advanced solid tumors. ASCO Meeting Abstracts. 2012;30:3003. - PubMed
    1. Boiko AD, Razorenova OV, van de Rijn M, Swetter SM, Johnson DL, Ly DP, Butler PD, Yang GP, Joshua B, Kaplan MJ, et al. Human melanoma-initiating cells express neural crest nerve growth factor receptor CD271. Nature. 2010;466:133–137. - PMC - PubMed

LinkOut - more resources