. 2017 Nov 14;21(7):2005-2016.
doi: 10.1016/j.celrep.2017.10.095.

Widespread Translational Remodeling during Human Neuronal Differentiation

Affiliations

Widespread Translational Remodeling during Human Neuronal Differentiation

John D Blair et al. Cell Rep. .

Abstract

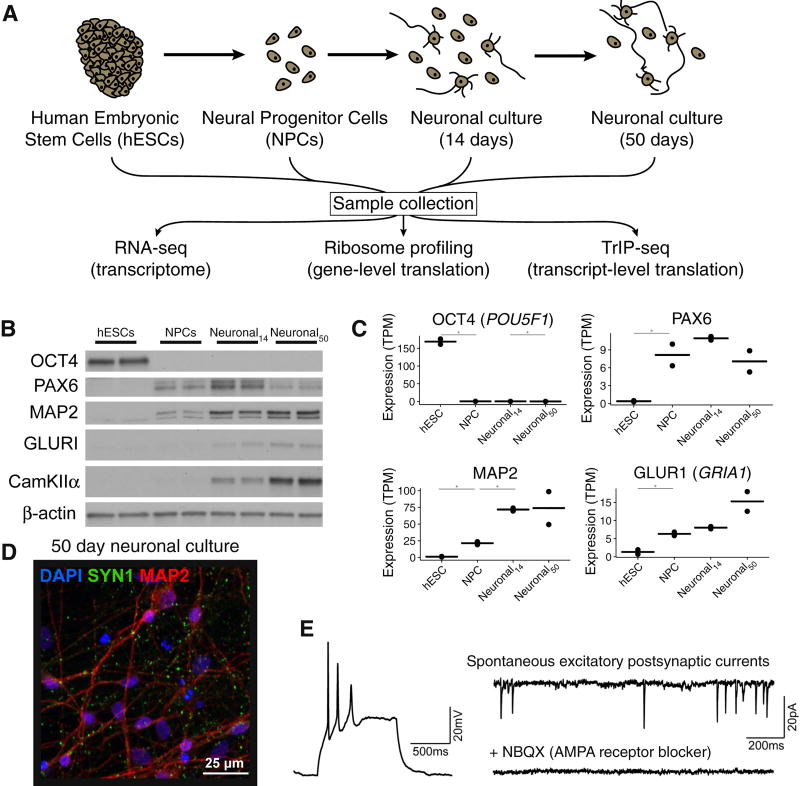
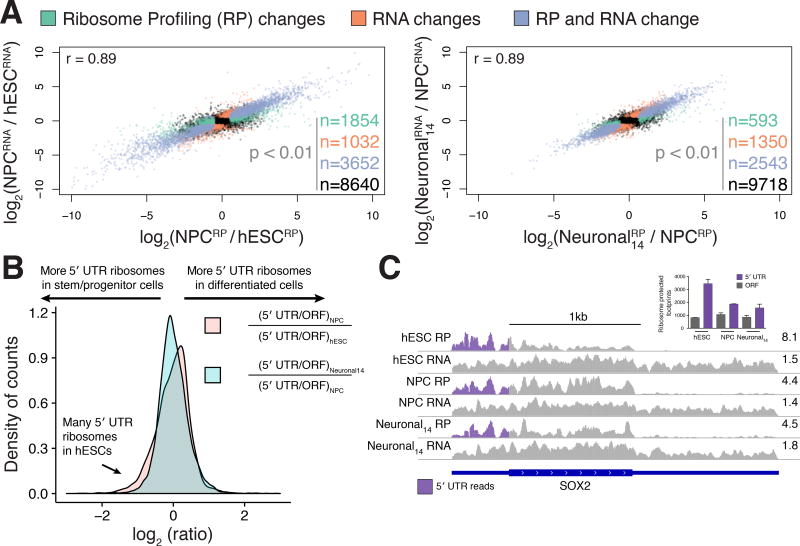
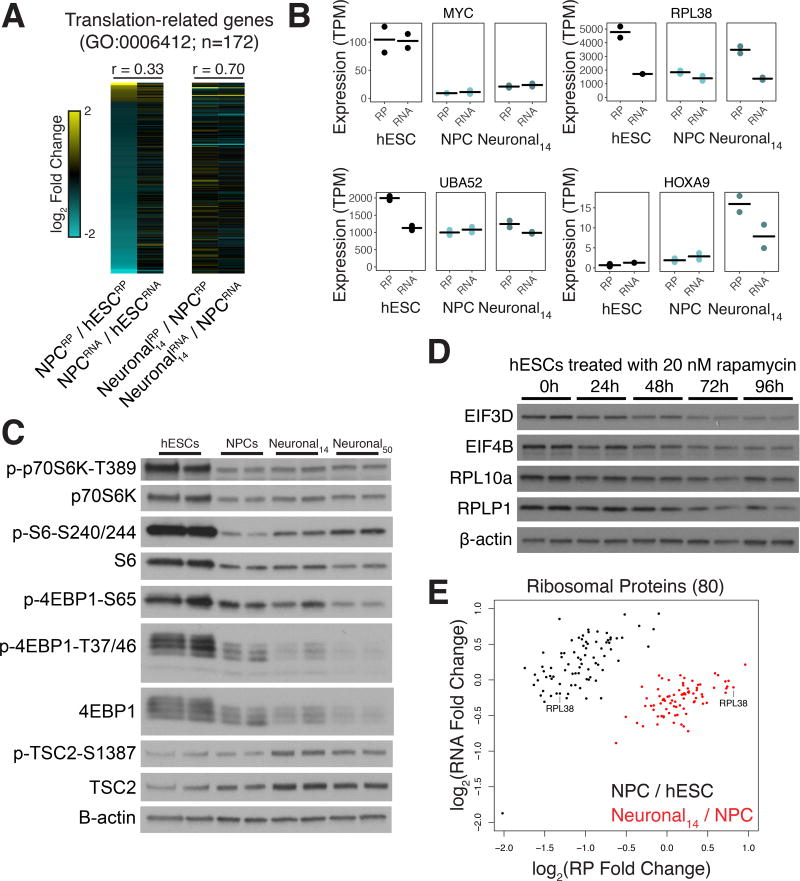
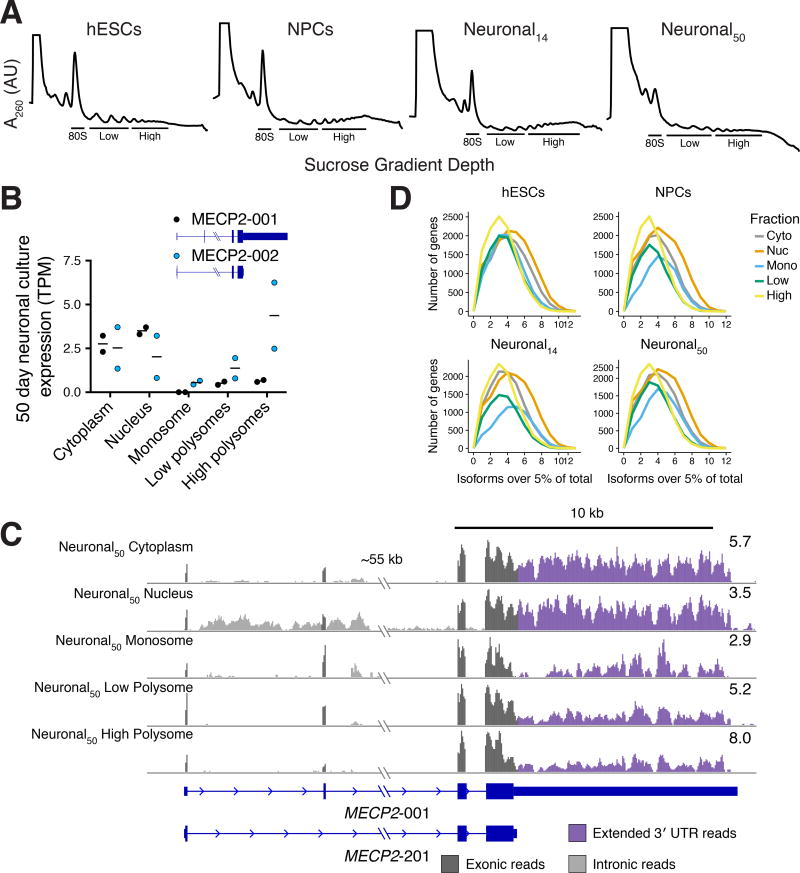
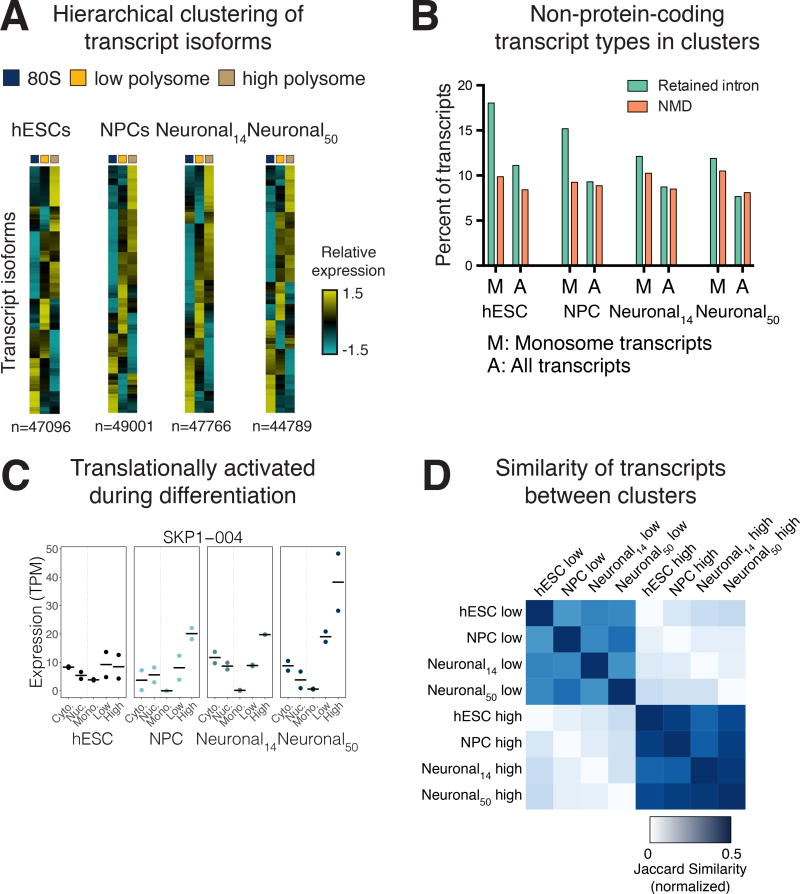
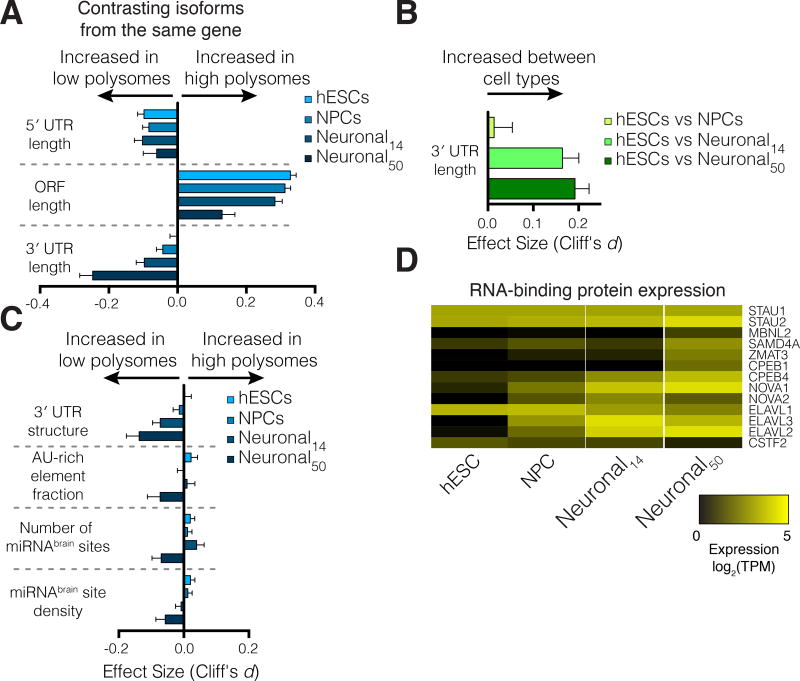
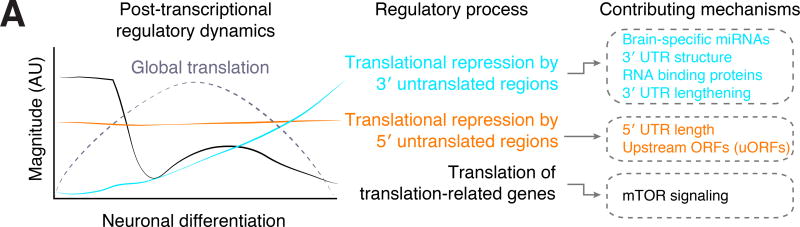
Faithful cellular differentiation requires temporally precise activation of gene expression programs, which are coordinated at the transcriptional and translational levels. Neurons express the most complex set of mRNAs of any human tissue, but translational changes during neuronal differentiation remain incompletely understood. Here, we induced forebrain neuronal differentiation of human embryonic stem cells (hESCs) and measured genome-wide RNA and translation levels with transcript-isoform resolution. We found that thousands of genes change translation status during differentiation without a corresponding change in RNA level. Specifically, we identified mTOR signaling as a key driver for elevated translation of translation-related genes in hESCs. In contrast, translational repression in active neurons is mediated by regulatory sequences in 3' UTRs. Together, our findings identify extensive translational control changes during human neuronal differentiation and a crucial role of 3' UTRs in driving cell-type-specific translation.

Keywords: RNA; TrIP-seq; cellular differentiation; human stem cell; neural progenitor cell; neurogenesis; neuron; polysome profiling; ribosome profiling; translational control.


Figures

Figure 1
Figure 1. Measuring global changes in transcription and translation during human neuronal differentiation
(A) The experimental design. Human embryonic stem cells (hESCs) were differentiated into neural progenitor cells using dual-SMAD inhibition followed by neuronal differentiation. Samples were collected from each cell population and RNA-seq, ribosome profiling, and TrIP-seq libraries were prepared from each. (B) Western blotting of five cell-type markers during differentiation. (C) Examples of marker genes from cytoplasmic RNA-seq. TPM: gene-level expression in transcripts-per-million. *: differentially expressed at p < 0.01. Bar: mean expression; points: expression in each replicate. (D) A representative image of 50-day old in vitro differentiated human neuronal cultures. Green: synapsin; red: MAP2; blue: DAPI. (E) Left, example whole cell current clamp recording of a neuron showing action potentials elicited by a 25pA depolarizing current injection. Right, example spontaneous excitatory post-synaptic currents (sEPSCs) showing network connectivity. sEPSCs were abolished by blocking AMPA receptors with NBQX (bottom right).See also Figure S1.
Figure 2
Figure 2. Gene-level translational control during human neuronal differentiation
(A) RNA-seq versus ribosome profiling fold changes between hESCs and NPCs (left) or NPCs and 14-day neuronal cultures (right) are plotted. Green: differentially expressed (DE) genes in ribosome profiling (RP); orange: DE genes in RNA-seq; blue: DE genes in both RNA-seq and RP; black: genes that do not change expression (p > 0.01). (B) Log-ratios of 5′ UTR to ORF ribosome profiling reads shows high 5′ UTR ribosome density for a group of genes in hESCs compared to differentiated cell types. (C) Relative upstream translation decreasing in the SOX2 gene. Purple: ribosome profiling reads mapping to the 5′ UTR. Right: reads per million. Inset: counts of the ribosome protected footprints mapping to the 5′ UTR or main ORF in different cell types; error is standard deviation. See also Figure S2.
Figure 3
Figure 3. Elevated translation through mTORC1 in hESCs
(A) A heatmap of the log2 fold changes between cell types indicated in either RP or RNA-seq. Cyan: higher in early cell-type; yellow: higher in late cell type. Above: pearson correlation of RP and RNA-seq fold changes. (B) Ribosome profiling and RNAseq expression profiles for MYC, RPL38, UBA52 and HOXA9 across differentiation. Bar: mean expression; points: expression in each replicate. (C) Western blots for phospho-p70S6K, phospho-S6, and phospho-4EBP1 as a readout of mTOR activity in differentiating neuronal cells, and the mTOR repressor TSC2. (D) Protein levels from hESCs treated with 20 nM rapamycin for the indicated times in hours for four genes with elevated translation in hESCs in (A). (E) Log2 fold changes in RNA vs ribosome profiling levels for 80 ribosomal proteins between cell types.
Figure 4
Figure 4. Transcript-level translational control during human neuronal differentiation
(A) Polysome profiles for hESCs, NPCs, day 14 neuronal cultures and day 50 neuronal cultures. RNA was collected from the indicated fractions for TrIP-seq. (B) Two differentially translated transcripts of the MECP2 gene are expressed in 50-day neuronal cultures, which differ in the length of their UTRs and translation level. Bar: mean expression; points: expression in each replicate. (C) Reads from the MECP2 locus. (D) The number of transcript isoforms per gene expressed above 5% of the total gene expression are plotted in different subcellular fractions.
Figure 5
Figure 5. Trends in transcript-level translation during human neuronal differentiation
(A) Heatmaps of hierarchical clusterings of transcript isoform expression. See Figure S3B for dendrograms and average plots. (B) Select transcript types are shown for clusters of transcripts that are primarily present in the monosome fraction. Most other transcripts are annotated as protein coding. (C) Contrasting lowly- and highly-translated clusters between cell types identifies transcripts, such as SKP1-004, that are differentially translated between cell types. Bar: mean expression; points: expression in each replicate. (D) The normalized Jaccard similarity of polysome-low and polysome-high clusters between cell types is plotted. See also Figure S3.
Figure 6
Figure 6. 3′ untranslated regions drive differential translation between cell types
(A) The relative length of 3′ UTRs between lowly- and highly-translated transcripts from the same gene increases during differentiation. Error bars: 95% confidence interval, also in (B,C). (B) Relative 3′ UTR length increases for transcripts of the same gene expressed between cell types. (C) 3′ UTR structure, the fraction of 3′ UTRs containing AU-rich elements, and the influence of brain-specific miRNA binding sites increase in 50-day old neuronal cultures, suggesting these features may drive translational repression by 3′ UTRs. (D) Expression changes in select RNA binding proteins that influence either 3′ end selection or post-transcriptional control. See also Figure S4.
Figure 7
Figure 7. Dynamic translational regulation during human neuronal differentiation
Left: A diagram of the approximate dynamics of post-transcriptional regulatory processes during human neuronal differentiation. Cyan: 3′ UTR-mediated translational repression, orange: 5′ UTR-mediated translational repression, black: preferential translation of mRNAs produced by translation-related genes. Right: Mechanisms that contribute to the regulatory processes in center. Individual mRNAs may be subject to regulation by one or many of these mechanisms. Our study and previous work indicates that global translation increases upon differentiation and decreases as neurons mature, shown in a dashed line.

References

    1. Agarwal V, Bell GW, Nam JW, Bartel DP. Predicting effective microRNA target sites in mammalian mRNAs. Elife. 2015;4 - PMC - PubMed
    1. An JJ, Gharami K, Liao GY, Woo NH, Lau AG, Vanevski F, Torre ER, Jones KR, Feng Y, Lu B, et al. Distinct role of long 3’ UTR BDNF mRNA in spine morphology and synaptic plasticity in hippocampal neurons. Cell. 2008;134:175–187. - PMC - PubMed
    1. Arribere JA, Gilbert WV. Roles for transcript leaders in translation and mRNA decay revealed by transcript leader sequencing. Genome Res. 2013;23:977–987. - PMC - PubMed
    1. Bani-Yaghoub M, Tremblay RG, Lei JX, Zhang D, Zurakowski B, Sandhu JK, Smith B, Ribecco-Lutkiewicz M, Kennedy J, Walker PR, et al. Role of Sox2 in the development of the mouse neocortex. Dev Biol. 2006;295:52–66. - PubMed
    1. Bhat M, Robichaud N, Hulea L, Sonenberg N, Pelletier J, Topisirovic I. Targeting the translation machinery in cancer. Nat Rev Drug Discov. 2015;14:261–278. - PubMed