. 2017 Nov 16;18(1):216.
doi: 10.1186/s13059-017-1339-3.

Intron retention enhances gene regulatory complexity in vertebrates

Affiliations

Intron retention enhances gene regulatory complexity in vertebrates

Ulf Schmitz et al. Genome Biol. .

Abstract

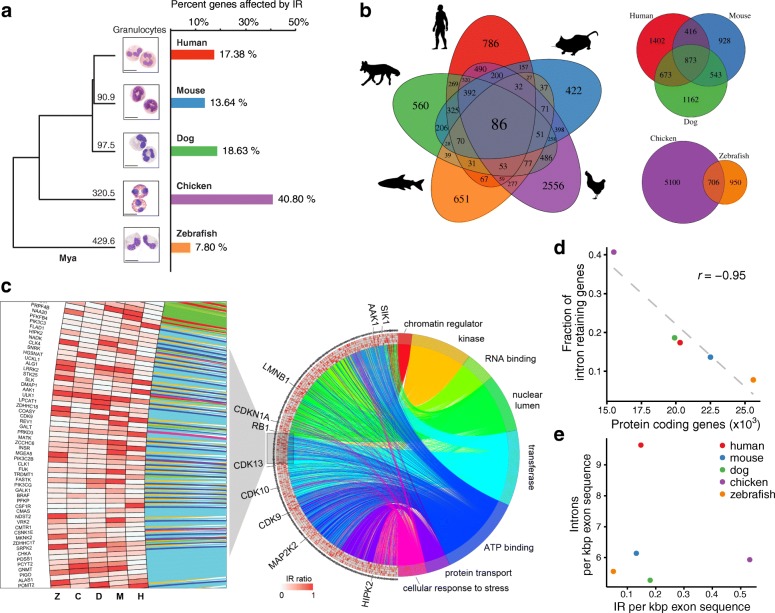
Background: While intron retention (IR) is now widely accepted as an important mechanism of mammalian gene expression control, it remains the least studied form of alternative splicing. To delineate conserved features of IR, we performed an exhaustive phylogenetic analysis in a highly purified and functionally defined cell type comprising neutrophilic granulocytes from five vertebrate species spanning 430 million years of evolution.

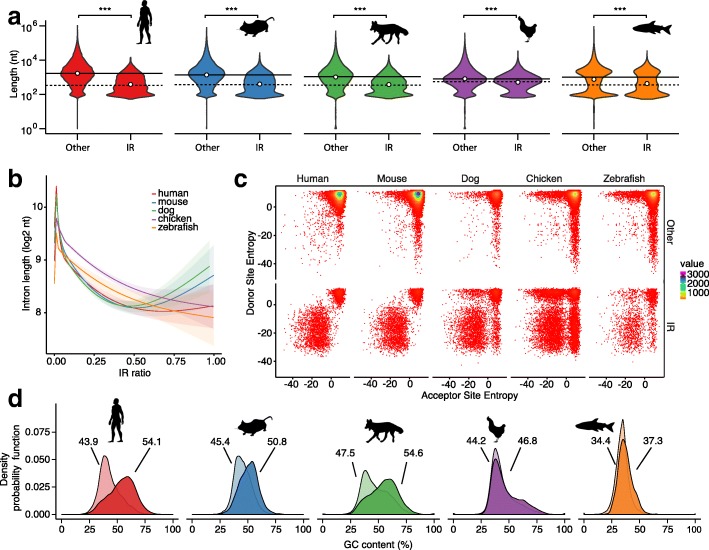
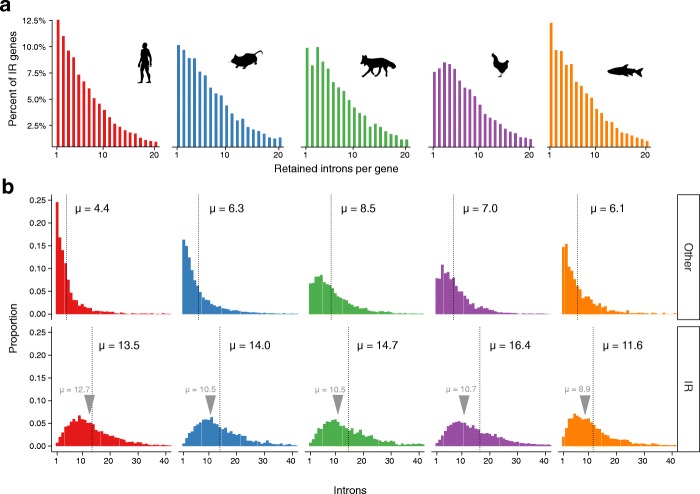
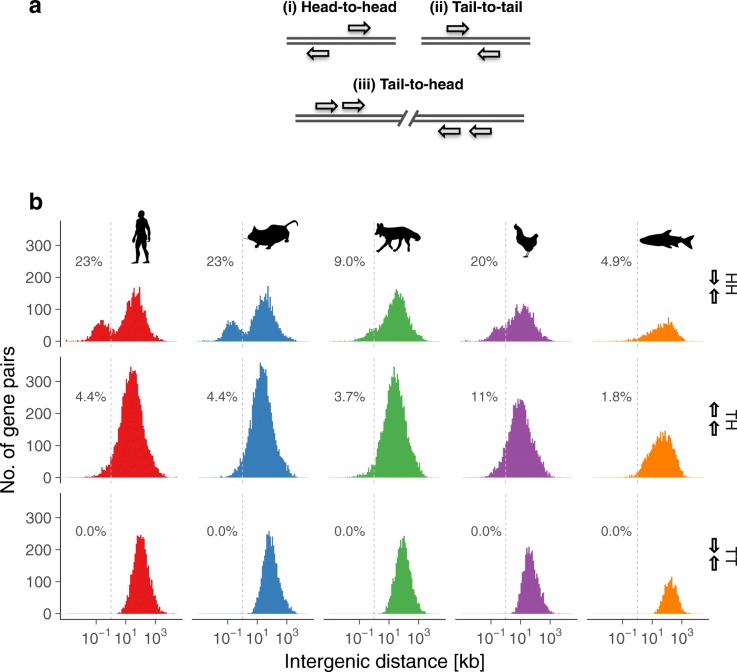
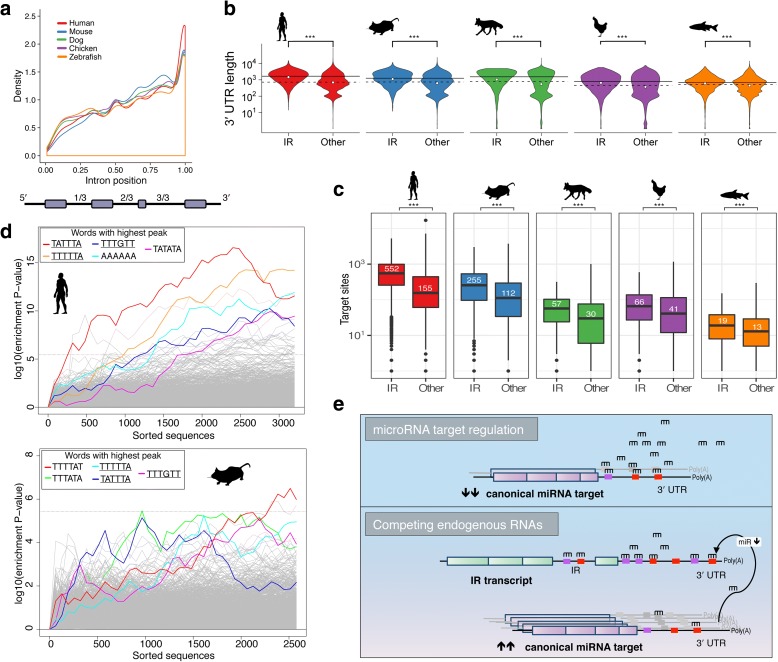
Results: Our RNA-sequencing-based analysis suggests that IR increases gene regulatory complexity, which is indicated by a strong anti-correlation between the number of genes affected by IR and the number of protein-coding genes in the genome of individual species. Our results confirm that IR affects many orthologous or functionally related genes in granulocytes. Further analysis uncovers new and unanticipated conserved characteristics of intron-retaining transcripts. We find that intron-retaining genes are transcriptionally co-regulated from bidirectional promoters. Intron-retaining genes have significantly longer 3' UTR sequences, with a corresponding increase in microRNA binding sites, some of which include highly conserved sequence motifs. This suggests that intron-retaining genes are highly regulated post-transcriptionally.

Conclusions: Our study provides unique insights concerning the role of IR as a robust and evolutionarily conserved mechanism of gene expression regulation. Our findings enhance our understanding of gene regulatory complexity by adding another contributor to evolutionary adaptation.

Keywords: Alternative splicing; Evolution; Gene regulation; Granulocytes; Intron retention; Transcriptomic complexity.


Conflict of interest statement

Ethics approval and consent to participate

The human whole blood sample was obtained with ethics approval from the Human Research Ethics Committee of the Royal Prince Alfred Hospital (HREC/08/RPAH/222). The human participant has given written informed consent. Experimental methods comply with the Helsinki Declaration. Ethics approval for the primary mouse granulocytes from bone marrow of male C57BL/6J mice (8–10 weeks) was obtained from RPAH AEC Protocol no. 2013/045. Dog peripheral blood samples were collected from Novartis Animal Health with ethics approval (Protocol no. YAR-13-001 and RPAH AEC Protocol no. 2013/045). Chicken peripheral blood was collected with ethics approval (UQ AEC no. SVS/365/13/ANNANDALE and RPAH AEC Protocol no. 2013/045). The zebrafish experiments were approved by the Monash University Animal Ethics Committee (protocol MAS-2010-18).

Consent for publication

Not applicable.

Competing interests

The authors declare that they have no competing interests.

Publisher’s Note

Springer Nature remains neutral with regard to jurisdictional claims in published maps and institutional affiliations.

Figures

Fig. 1
Fig. 1
IR conservation in mammalian and vertebrate species. a Phylogenetic tree of species under investigation and morphology of FACS sorted human, mouse, dog, chicken, and zebrafish granulocytes (Mya = million years ago) following Giemsa or Wright staining. The horizontal bar plot shows the fraction of expressed genes affected by IR in each species. b The five-way symmetric Venn diagram shows the intersections of orthologous intron-retaining genes between species. Eighty-six orthologs are conjointly affected by IR in all five species. The three-way asymmetric Venn diagram shows the intersecting gene sets of intron-retaining orthologs in placental mammals (human, mouse, dog), while the asymmetric two-way Venn diagram below illustrates the intersection of intron-retaining orthologs in the non-placental vertebrates (chicken and zebrafish). c Circos plot illustrating links between genes and annotation terms that are repeatedly enriched in the species-specific gene clusters. The right semicircle depicts the enriched terms. The left semicircle includes five concentric rings that represent color-coded IR ratios of orthologous genes in all five species, starting from human (H), mouse (M), dog (D), chicken (C), and zebrafish (Z). Left: A magnified section of the concentric rings. Orthologous genes sometimes do not have consistent IR values across the species; however, the IR functional specificity is conserved by targeting functionally related genes. A scalable version of this figure in vector format is provided in Additional file 5. d IR data from granulocytes exhibits a strong anti-correlation (Pearson correlation; r = –0.95) between the fraction of expressed intron-retaining genes and the number of protein-coding genes in a genome. e Number of retained introns per kbp exon sequence in relation to the average number of introns per kpb exon sequence in a genome
Fig. 2
Fig. 2
Characteristics of retained introns. a Violin plots showing the log10 length distribution of non-retained (left violin in each subplot) and retained introns (right violin). Mann–Whitney U test was used to determine significance, denoted by *** (p < 0.001). b Generalized additive model with smoothness estimation of the intron length/IR ratio relationship. c Bivariate histograms illustrating strengths of splice site pairs (as maximum entropy) [37] of retained introns and all other introns using hexagon binning (100 × 100 bins). d Density of the GC content in retained (dark color) and non-retained introns (light color). Numbers indicate the mean GC content
Fig. 3
Fig. 3
Characteristics of intron-retaining genes. a Histograms of the number of retained introns in intron-retaining genes. b Distribution of intron number in transcripts without (upper panel) and with IR (lower panel) as a proportion of all transcripts. Genes that do not contain retained introns (Other) include expressed genes (FPKM > 1) only. Gray arrows above the curves indicate the average number of introns per gene in each species
Fig. 4
Fig. 4
Bidirectional promoters in intron-retaining genes. a Gene orientation scheme with arrow heads at the 3′ end. b Histograms of binned intergenic distances between intron-retaining genes (right). The intergenic distance is determined as distance (in kb) between the transcription start sites of two genes (–/+; HH) or end of transcripts (+/–; TT), when on opposite strands, and between end of transcript and transcription start site, when both genes are on the same strand (+/+ or –/–; TH). The percentages indicated in each plot refer to the fraction of gene pairs with an intergenic distance of ≤ 1 kb
Fig. 5
Fig. 5
Relative position of retained introns and miRNA binding site enrichment. a Probability density function of the position of retained introns in relation to the other introns in the gene structure. Values between 0 and 1 represent the relative intron position, which is calculated by dividing the intron position by the total number of introns in a transcript. b Densities of 3′ UTR lengths as violin plots. Densities of 3′ UTR sequence lengths in transcripts with (IR) and without retained introns (Other). The solid and dashed horizontal lines mark the median 3′ UTR length of genes with and without retained introns, respectively, and the white dots their mean. Genes that do not contain retained introns (Other) include lowly and non-expressed genes. c Comparison of the number of predicted miRNA binding sites in the 3′ UTR sequences of genes with retained introns and non-intron-retaining genes. The white numbers indicate the median value, illustrated also by a horizontal line in each box. Genes that do not contain retained introns (Other) include lowly and non-expressed genes. d Sylamer [55] plots illustrating 6mer seed sites enriched in the 3′ UTR sequences (x-axis) of intron-retaining genes in human and mouse based on a hypergeometric significance test. The canonical polyadenylation signal (AATAAA), which is also enriched in both species, is not highlighted. Mutually enriched seed site sequences are underlined. The horizontal dotted line represents an E-value threshold (Bonferroni-corrected) of 0.01. The corresponding plots for dog, chicken, and zebrafish are in Additional file 2: Figure S17. e Model of intron-retaining transcripts as competing endogenous RNAs. Wilcoxon test was used to determine significance, denoted by *** (p < 0.001)

References

    1. Barash Y, Calarco JA, Gao W, Pan Q, Wang X, Shai O, Blencowe BJ, Frey BJ. Deciphering the splicing code. Nature. 2010;465:53–9. doi: 10.1038/nature09000. - DOI - PubMed
    1. Braunschweig U, Barbosa-Morais NL, Pan Q, Nachman EN, Alipanahi B, Gonatopoulos-Pournatzis T, et al. Widespread intron retention in mammals functionally tunes transcriptomes. Genome Res. 2014;24:1774–86. doi: 10.1101/gr.177790.114. - DOI - PMC - PubMed
    1. Wong JJ, Ritchie W, Ebner OA, Selbach M, Wong JW, Huang Y, et al. Orchestrated intron retention regulates normal granulocyte differentiation. Cell. 2013;154:583–95. doi: 10.1016/j.cell.2013.06.052. - DOI - PubMed
    1. Edwards CR, Ritchie W, Wong JJ, Schmitz U, Middleton R, An X, et al. A dynamic intron retention program in the mammalian megakaryocyte and erythrocyte lineages. Blood. 2016;127:e24–e34. doi: 10.1182/blood-2016-01-692764. - DOI - PMC - PubMed
    1. Ni T, Yang W, Han M, Zhang Y, Shen T, Nie H, et al. Global intron retention mediated gene regulation during CD4+ T cell activation. Nucleic Acids Res. 2016;44:6817–29. doi: 10.1093/nar/gkw591. - DOI - PMC - PubMed

Publication types