. 2017 Dec 4;214(12):3645-3667.
doi: 10.1084/jem.20170391. Epub 2017 Nov 15.

Development and plasticity of meningeal lymphatic vessels

Affiliations

Development and plasticity of meningeal lymphatic vessels

Salli Antila et al. J Exp Med. .

Abstract

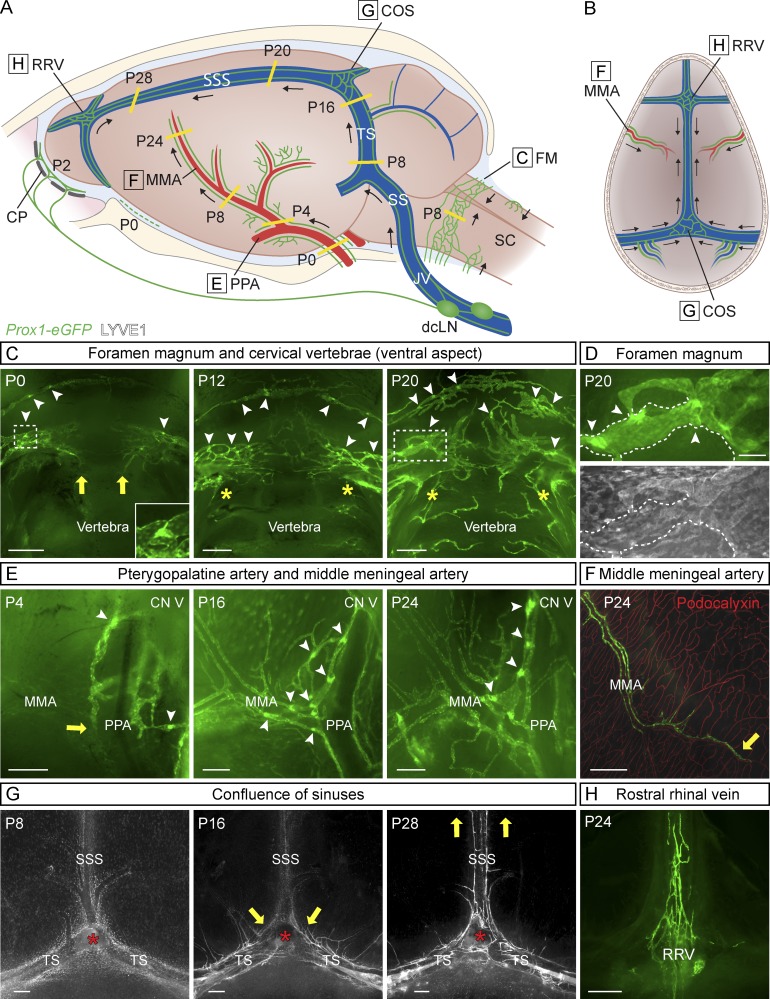
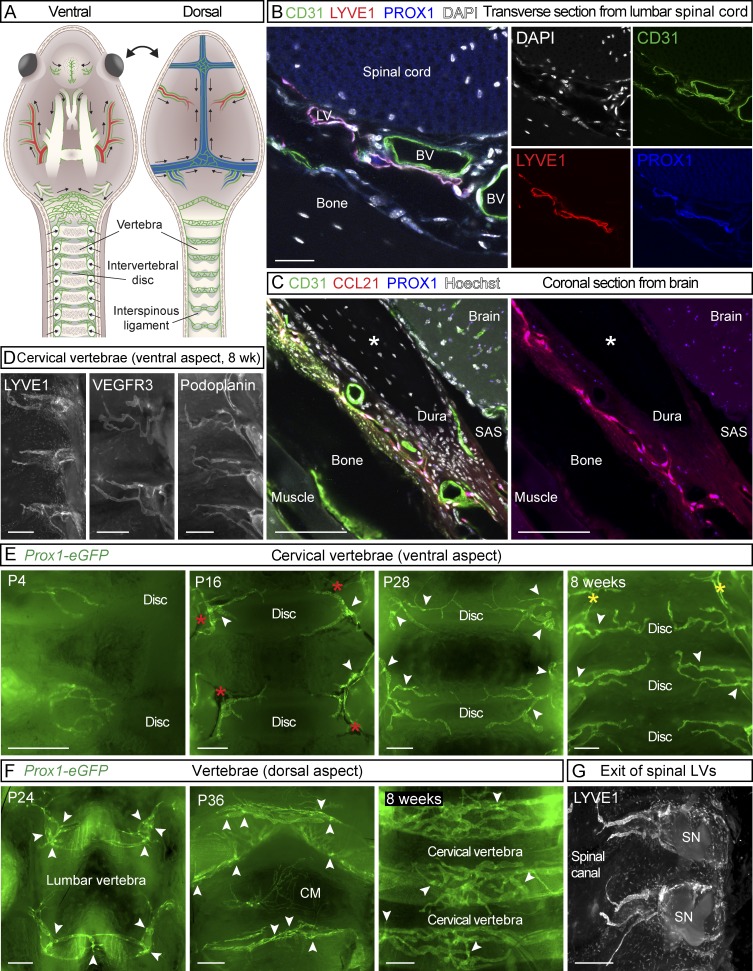
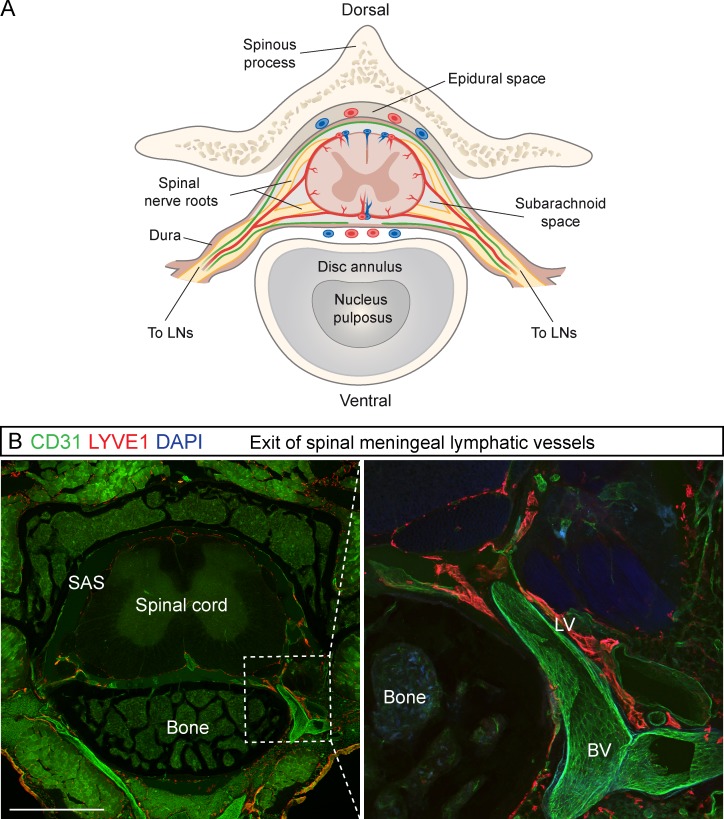
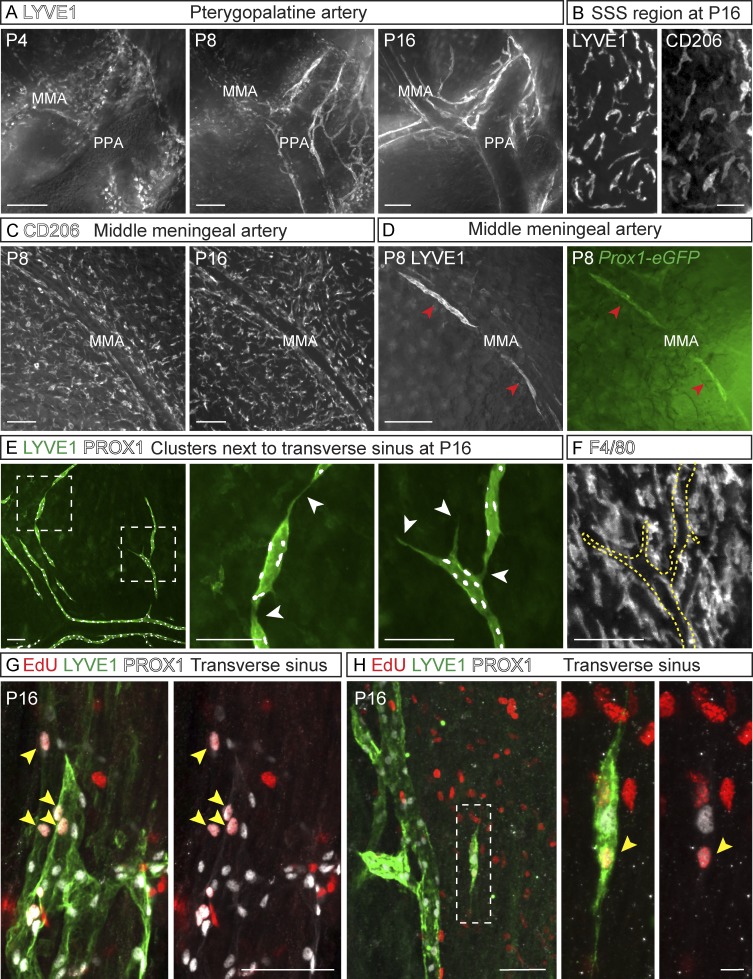
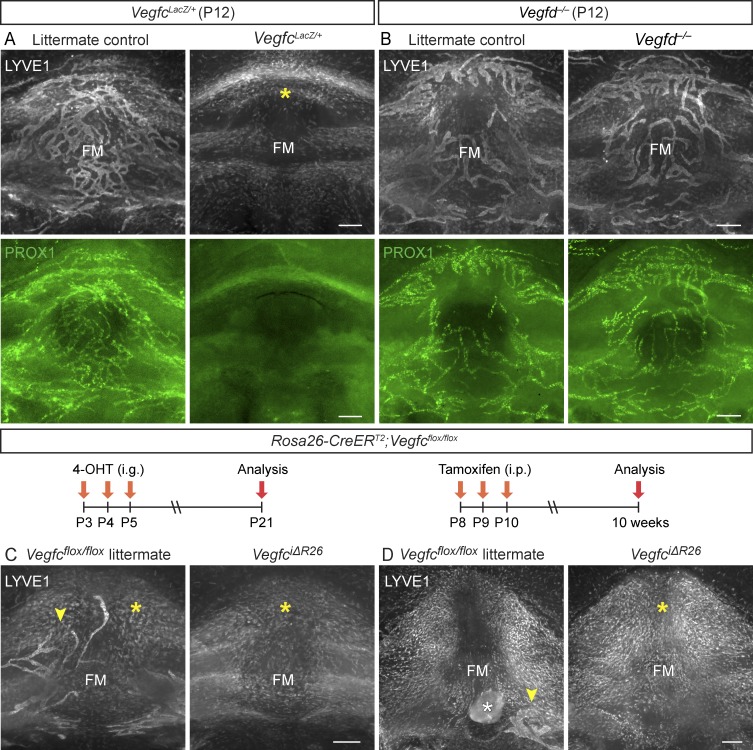
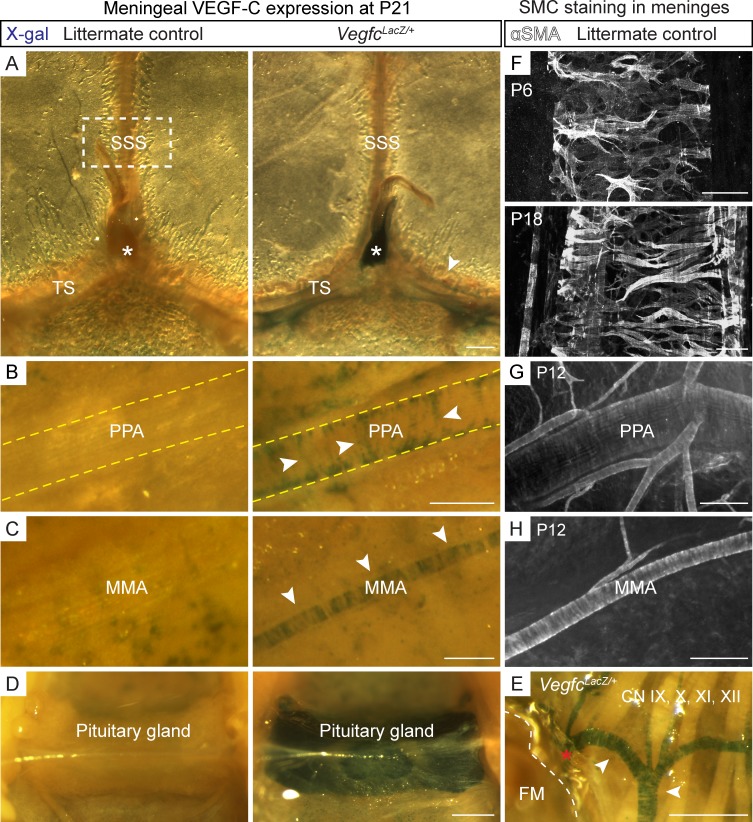
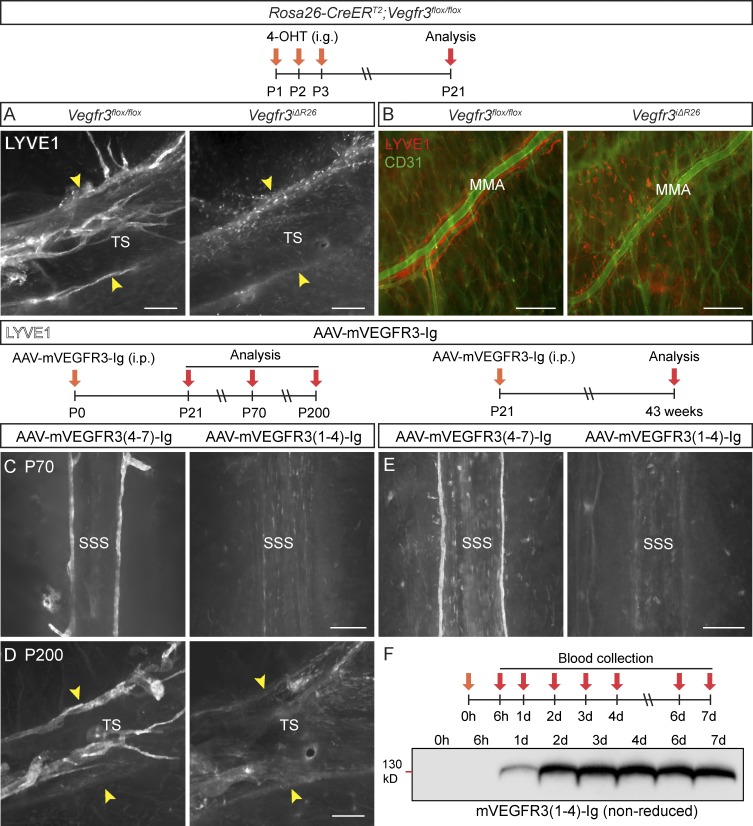
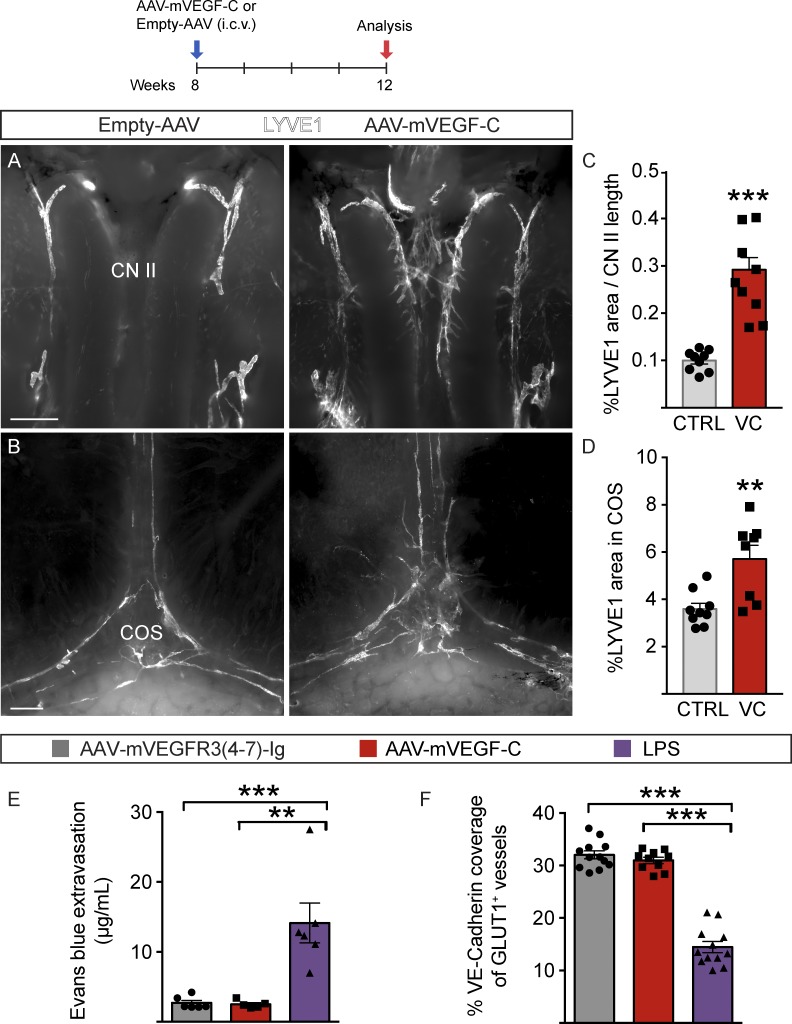
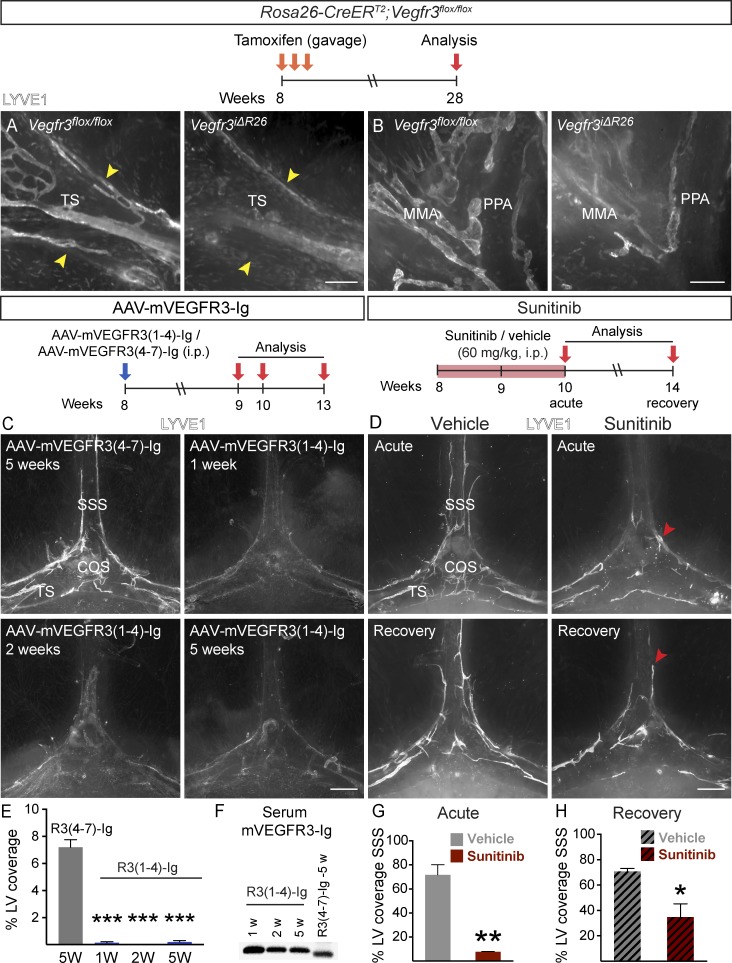
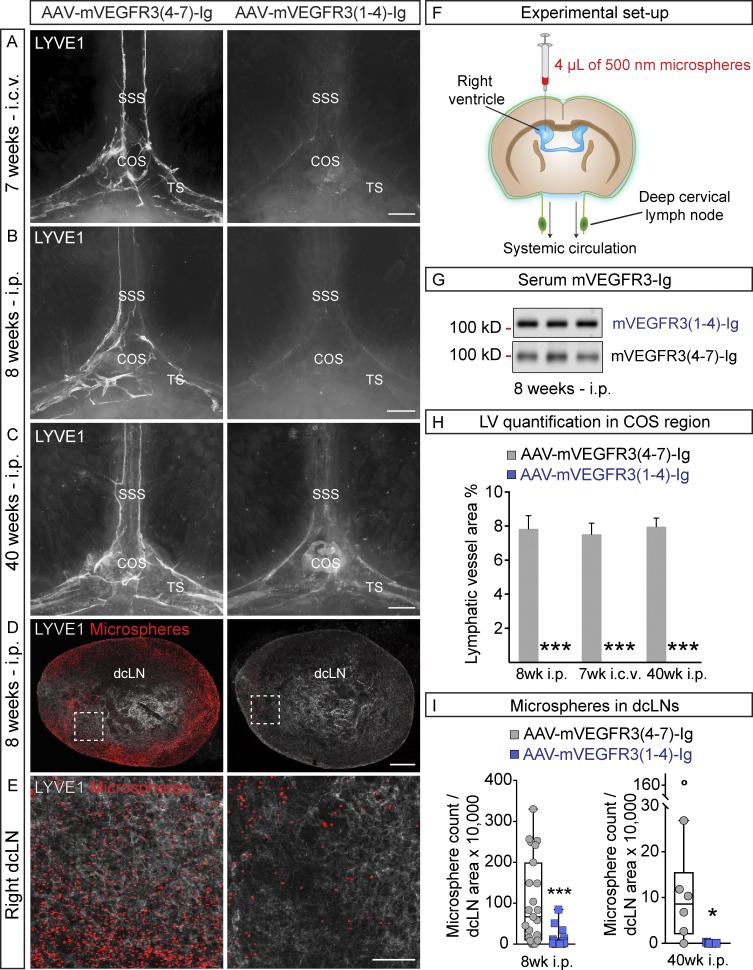
The recent discovery of meningeal lymphatic vessels (LVs) has raised interest in their possible involvement in neuropathological processes, yet little is known about their development or maintenance. We show here that meningeal LVs develop postnatally, appearing first around the foramina in the basal parts of the skull and spinal canal, sprouting along the blood vessels and cranial and spinal nerves to various parts of the meninges surrounding the central nervous system (CNS). VEGF-C, expressed mainly in vascular smooth muscle cells, and VEGFR3 in lymphatic endothelial cells were essential for their development, whereas VEGF-D deletion had no effect. Surprisingly, in adult mice, the LVs showed regression after VEGF-C or VEGFR3 deletion, administration of the tyrosine kinase inhibitor sunitinib, or expression of VEGF-C/D trap, which also compromised the lymphatic drainage function. Conversely, an excess of VEGF-C induced meningeal lymphangiogenesis. The plasticity and regenerative potential of meningeal LVs should allow manipulation of cerebrospinal fluid drainage and neuropathological processes in the CNS.


Figures

Figure 1.
Figure 1.
Postnatal development of the meningeal lymphatic network. (A and B) Schematic illustration showing meningeal LVs (green) superimposed on the corresponding anatomical structures at different postnatal (P) days (A) and the direction of LV growth (B). CN V, CN V (trigeminal nerve); CP, cribriform plate; SC, spinal cord. (C–H) Development of the meningeal lymphatic network, detected by Prox1-eGFP (green) reporter and LYVE1 immunostaining (gray). Meningeal LVs around the FM at P0, P12, and P20 (C and D); around the PPA and MMA at P4, P16, and P24 (E); around the MMA at P24 (F; showing BV immunostaining for podocalyxin in red); around the COS at P8, P16, and P28 (G); and around the RRV at P24 (H). Dashed boxes in C (P0 and P20) surround the lymphatic valves magnified in C (P0) and D (P20). (D) Close-up of lymphatic valves (arrowheads) in the FM region at P20; note the lack of LYVE1 staining of collecting LVs (dashed line). Yellow lines in A and arrows in C and E–G point to the growing LV front. Arrowheads in C–E mark lymphatic valves. Asterisks in C indicate the connection between LVs around the FM and LVs around the spinal canal. Asterisks in G indicate remnants of the excised pineal gland. Data shown are representative of n = 3–6 per time point and staining. Bars: (C and F–H) 400 µm; (D) 100 µm; (E) 200 µm.
Figure 2.
Figure 2.
LVs in spinal meninges. (A) Schematic illustration of meningeal LVs (green) attached to the ventral and dorsal sides of the cranium and spinal canal after removal of the brain and spinal cord. SN; spinal nerve. (B) Transverse section of lumbar spine of an adult mouse showing LVs in dura, immunostained for CD31 (green), LYVE1 (red), and PROX1 (blue). (C) Coronal sections of adult skull showing the meningeal LVs, immunostained for CD31 (green), CCL21 (red), and PROX1 (blue). Asterisk indicates an artifactual space created during preparation. (D) LYVE1, VEGFR3, and podoplanin immunostaining of spinal meninges. (E and F) Development of the meningeal LVs in the spinal canal on the ventral (E) and dorsal (F) aspects during the indicated postnatal (P) days. (G) LVs exiting the spinal canal together with the spinal nerves. Arrowheads in E and F point to lymphatic valves, and red asterisks in E indicate BVs. Yellow asterisks in E indicate the connection between LVs around the FM and LVs around the spinal canal. Data shown are representative of n = 3–6 per time point and staining. Bars: (B) 20 µm; (C) 50 µm; (D, F, and G) 400 µm; (E) 300 µm.
Figure 3.
Figure 3.
LV exit from the spinal canal along the spinal nerves and BVs. (A) Schematic transverse view of the spinal cord and its blood (red) and lymphatic (green) vessels. (B) Transverse section of spinal cord with a close-up showing the exit of the LVs and BVs along the spinal nerve bundle in LYVE1 (red) and CD31 (green) immunostaining, respectively (n = 3). Bar, 2 mm.
Figure 4.
Figure 4.
Sprout extension and fusion of cell clusters in meningeal lymphangiogenesis. (A) LYVE1 staining of LVs developing around the PPA. (B) LYVE1+/CD206+ macrophage-like cells around the SSS at P16. (C) CD206 immunostaining around the MMA. (D) LYVE1 (gray) and Prox1-eGFP (green)–positive cell clusters (arrowheads) around the MMA. (E) LYVE1 (green) and PROX1 (gray) immunostaining of LEC clusters around the TS at P16. Dashed boxes indicate areas of the close-up images shown in E. Arrowheads indicate connections of the clusters with each other and with the already-formed LVs. (F) F4/80 immunostaining of macrophage-like cells for comparison. Dashed line indicates the LEC clusters shown in E. (G and H) EdU-positive LECs (arrowheads in G) in the tip cell area around the TS and (H) in isolated clusters stained for PROX1 (gray) and LYVE1 (green). EdU was administered 6 h before tissue harvest. Data shown are representative of n = 2–4 per time point and staining. Bars: (A and D) 200 µm; (B, F, and G) 50 µm; (C and E) 100 µm; (H) 10 µm.
Figure 5.
Figure 5.
VEGF-C, but not VEGF-D, is essential for normal meningeal LV development. (A and B) LYVE1 (gray) and PROX1 (green) staining of the FM area in P12 VegfcLacZ/+ (n = 3, 3; P = 0.0429; A) and Vegfd−/− mice and their littermate controls (n = 3, 3; P = 0.2264; B). (C and D) Comparison of LYVE1 staining in the FM area in Vegfcflox/flox littermate controls and VegfciΔR26 mice (C) at P21 (n = 3, 3; P = 0.4391) and (D) at 10 wk of age (n = 3, 6; P = 0.0457). The time course of 4-OHT or tamoxifen injections and analysis is illustrated above the images. Yellow (A, C, and D) and white (D) asterisks indicate LYVE1-positive macrophage-like cells and extra tissue left after dissection, respectively. Arrowheads point to LV fragments. Data shown are representative of two independent experiments using littermate mice. Student’s t test was used to calculate p-values. Bars, 200 µm.
Figure 6.
Figure 6.
Smooth muscle cells provide a vascular source of VEGF-C for meningeal LVs. (A–E) β-Galactosidase staining of meningeal tissue showing VEGF-C expression around the TS and SSS and in the pineal gland (asterisks; A), PPA (B), MMA (C), pituitary gland (hypophysis; D), and FM (dashed line) and the CNs (E) in VegfcLacZ/+ mice at P21. Note the “stripe-like” pattern resembling the wrapping of SMCs around the BVs (arrowheads). The asterisk in E shows VEGF-C expressing meningeal BV that continues from the skull base to the spinal canal. (F–H) αSMA staining around the SSS from the boxed area in A at P6 and P18 (F), PPA at P12 (G), and MMA at P12 (H). Data shown are representative of n = 2–4 per time point and staining using littermate mice. Bars: (A) 400 µm; (B, E, and G) 200 µm; (C and H) 100 µm; (D) 500 µm; (F) 50 µm.
Figure 7.
Figure 7.
VEGFR-3 is essential for meningeal LV development. (A and B) Comparison of dural LYVE1 staining in P21 mice deleted of Vegfr3 (Vegfr3iΔR26, n = 4) and their littermate controls (Vegfr3flox/flox, n = 9) around the TS (A) and MMA (B). BVs stained for CD31 (green). (C and D) LYVE1 staining around the SSS and TS in mice injected with the indicated AAVs at P0 and analyzed at P70 (n = 6, 6; C) or P200 (n = 3, 3; D). (E) LYVE1 staining around the SSS in mice injected with the same vectors on P21 and analyzed 40 wk later (n = 7, 6). The width of the TS is indicated by the arrowheads in A and D. (F) Western blot showing VEGFR3-Ig protein in serum of an individual mouse at the indicated time points after i.p. AAV injection. Data shown are representative of two independent experiments. Bars, 200 µm.
Figure 8.
Figure 8.
Meningeal LV growth in response to AAV–mVEGF-C. (A–E) Analysis of meningeal LVs in mice injected i.c.v. with AAV–mVEGF-C (n = 9) or AAV without payload (empty-AAV; n = 9). LYVE1 staining of the CN II (A) and COS area (B), and quantification of LYVE1 area-percentage per CN II length (C) and COS region (D). CTRL, Empty-AAV; VC, AAV–mVEGF-C. (E and F) Analysis of BBB integrity in 12-wk-old mice injected i.c.m. with AAV–mVEGF-C (n = 5) or AAV–mVEGFR34–7-Ig (control, n = 6) at 8 wk of age. Comparison is made to mice treated with i.p. LPS (n = 6). Quantification of EB extravasation into brain tissue 3 h after i.v. administration (E) and VE-Cadherin and BV-specific GLUT1 colocalization in brain sections (F). Data shown are representative of two independent experiments. A Student’s t test was used to calculate p-values. **, P < 0.01; ***, P < 0.001. Values are expressed as mean ± SEM. Bars: (A) 100 µm; (B) 500 µm.
Figure 9.
Figure 9.
VEGFR-3 signaling is required for LV maintenance in adult meninges. (A and B) Comparison of LYVE1 staining around the TS (A) and PPA (B) in Rosa26-Vegfr3flox/flox (n = 4) and Vegfr3iΔR26 mice (n = 4) 20 wk after tamoxifen administration. Arrowheads indicate TS width. (C and D) LYVE1 staining around the COS (C) at the indicated time points after AAV–mVEGFR31–4-Ig or AAV–mVEGFR34–7-Ig injection (n = 3, 3 in each time point) and in mice administered daily with 60 mg/kg sunitinib (D) and analyzed as indicated (n = 3, 3 in both time-points). Arrowheads point to the rostral end of the LV front in acute and recovery phases. (E) Quantification of the LV area in the experiment shown in C. (F) Western blot showing mVEGFR3-Ig protein in serum at the indicated time points after AAV injection. (G and H) Quantification of SSS length covered by LVs in sunitinib-treated mice in the acute phase (G) and recovery phase (H). Data shown are representative of two independent experiments. A Student’s t test was used to calculate p-values. *, P < 0.05; **, P < 0.01; ***, P < 0.001. Values are expressed as mean ± SEM. Bars: (A) 200 µm; (B) 150 µm; (C and D) 500 µm. W, weeks.
Figure 10.
Figure 10.
Regression of meningeal LVs decreases drainage of i.c.v.-injected microspheres. (A–C) Representative images of LYVE1-stained LVs around the COS 7 wk after i.c.v. injection (A; n = 6, 6), 8 wk after i.p. injection (B; n = 6, 6), and 40 wk after i.p. injection (C; n = 7, 6) of the indicated AAVs into 9-, 8-, and 3-wk-old mice, respectively. (D) Representative images of LYVE1–stained dcLNs (gray) containing fluorescent microsphere (red) in mice subjected to the functional assay schematically described in F. Analysis was done 8 wk after i.p. injection of the indicated AAVs into 8-wk-old mice (n = 12, 12). (E) Representative close-up images of the boxed areas in D. (G) Western blot showing mVEGFR3-Ig protein in serum 8 wk after i.p. AAV injection. (H) Quantification of LVs in the experiments shown in A–C. (I) Quantification of the number of microspheres in dcLNs, normalized to dcLN area in the experiments shown in B–E. Data shown are representative of two independent experiments. A Student’s t test was used to calculate p-values. *, P < 0.05; ***, P < 0.001. Values are expressed as mean ± SEM. Bars: (A–C) 500 µm; (D) 200 µm; (E) 50 µm.

Comment in

  • The amazing brain drain.
    Blanchette M, Daneman R. Blanchette M, et al. J Exp Med. 2017 Dec 4;214(12):3469-3470. doi: 10.1084/jem.20172031. Epub 2017 Nov 21. J Exp Med. 2017. PMID: 29162645 Free PMC article.

References

    1. Alitalo K. 2011. The lymphatic vasculature in disease. Nat. Med. 17:1371–1380. 10.1038/nm.2545 - DOI - PubMed
    1. Alitalo A.K., Proulx S.T., Karaman S., Aebischer D., Martino S., Jost M., Schneider N., Bry M., and Detmar M.. 2013. VEGF-C and VEGF-D blockade inhibits inflammatory skin carcinogenesis. Cancer Res. 73:4212–4221. 10.1158/0008-5472.CAN-12-4539 - DOI - PubMed
    1. Anisimov A., Alitalo A., Korpisalo P., Soronen J., Kaijalainen S., Leppänen V.M., Jeltsch M., Ylä-Herttuala S., and Alitalo K.. 2009. Activated forms of VEGF-C and VEGF-D provide improved vascular function in skeletal muscle. Circ. Res. 104:1302–1312. 10.1161/CIRCRESAHA.109.197830 - DOI - PMC - PubMed
    1. Aparicio-Gallego G., Blanco M., Figueroa A., García-Campelo R., Valladares-Ayerbes M., Grande-Pulido E., and Antón-Aparicio L.. 2011. New insights into molecular mechanisms of sunitinib-associated side effects. Mol. Cancer Ther. 10:2215–2223. 10.1158/1535-7163.MCT-10-1124 - DOI - PubMed
    1. Aspelund A., Tammela T., Antila S., Nurmi H., Leppänen V.M., Zarkada G., Stanczuk L., Francois M., Mäkinen T., Saharinen P., et al. . 2014. The Schlemm’s canal is a VEGF-C/VEGFR-3-responsive lymphatic-like vessel. J. Clin. Invest. 124:3975–3986. 10.1172/JCI75395 - DOI - PMC - PubMed

MeSH terms