. 2018 Jan 2;215(1):159-175.
doi: 10.1084/jem.20171052. Epub 2017 Nov 15.

Prostate-specific membrane antigen cleavage of vitamin B9 stimulates oncogenic signaling through metabotropic glutamate receptors

Affiliations

Prostate-specific membrane antigen cleavage of vitamin B9 stimulates oncogenic signaling through metabotropic glutamate receptors

Charalambos Kaittanis et al. J Exp Med. .

Erratum in

Abstract

Prostate-specific membrane antigen (PSMA) or folate hydrolase 1 (FOLH1) is highly expressed on prostate cancer. Its expression correlates inversely with survival and increases with tumor grade. However, the biological role of PSMA has not been explored, and its role in prostate cancer remained elusive. Filling this gap, we demonstrate that in prostate cancer, PSMA initiates signaling upstream of PI3K through G protein-coupled receptors, specifically via the metabotropic glutamate receptor (mGluR). PSMA's carboxypeptidase activity releases glutamate from vitamin B9 and other glutamated substrates, which activate mGluR I. Activated mGluR I subsequently induces activation of phosphoinositide 3-kinase (PI3K) through phosphorylation of p110β independent of PTEN loss. The p110β isoform of PI3K plays a particularly important role in the pathogenesis of prostate cancer, but the origin of its activation was so far unknown. PSMA expression correlated with PI3K-Akt signaling in cells, animal models, and patients. We interrogated the activity of the PSMA-PI3K axis through positron emission tomography and magnetic resonance imaging. Inhibition of PSMA in preclinical models inhibited PI3K signaling and promoted tumor regression. Our data present a novel oncogenic signaling role of PSMA that can be exploited for therapy and interrogated with imaging.


Figures

Figure 1.
Figure 1.
Expression of PSMA in patients is associated with activated Akt. (A and B) Elevated PSMA expression is associated with disease relapse (A) and metastases (B) in prostate cancer (MSKCC cohort PMID 25024180). High PSMA expression is defined as expression z-score >2, and low PSMA expression is defined as z-score ≤ 2. (C) Immunohistochemistry on representative samples from prostate cancer patients shows that enhanced PSMA expression correlates with elevated phosphorylation of the Akt target 4EBP1. (D) Gene set enrichment analysis comparing prostate cancer patients with normal PSMA levels with prostate cancer patients with high (z-score >2) PSMA levels. The dataset from the MSKCC prostate cancer cohort (PMID 25024180) was used.
Figure 2.
Figure 2.
Expression of enzymatically active PSMA up-regulates the Akt–mTOR pathway. (A) PSMA-expressing cells are associated with enrichment of Akt and mTOR signaling signatures. Gene set enrichment analysis comparing PSMA-expressing cells (LNCaP-Ctrl) with their PSMA-negative counterparts (LNCaP-KD). The gene set data were derived from the mean of three independent experiments obtained through the Affymetrix platform. (B) In the brain, PSMA, encoded by the FOLH1 gene and termed glutamate carboxypeptidase II (GCP-II), modulates glutamatergic neurotransmission via activation of postsynaptic metabotropic glutamate receptor (mGluR) system through the proteolytic cleavage of the amide bond of NAAG. (C–E) Increased phosphorylation of Akt, S6, and 4EBP1 in PSMA-expressing cells was determined with immunoblot analysis. Relative intensities normalized to actin levels (n = 3). (F and G) Expression of enzymatically active PSMA leads to phosphorylation of Akt, mTOR, and S6, as determined through a reverse-phase protein array (R&D Systems, Inc.). Changes in phosphorylation calculated as deviations from the control cell line (LNCaP-Ctrl for the PSMA knockdown cells [LNCaP-KD], PC3-Ctrl for PC3-PSMA that overexpress PSMA, and LNCaP-Ctrl for LNCaP-Ctrl cells that were treated for 2 h with the PSMA inhibitor 2-PMPA; n = 4 per condition). Graphs show mean ± SEM. **, P < 0.01 (unpaired t test).
Figure 3.
Figure 3.
PSMA up-regulates Akt through activation of PI3K-p110β via mGluR I. (A) Immunohistochemistry of PC3-Ctrl and PC3-PSMA tumors grown on male, athymic nude mice shows elevated Akt1 phosphorylation in the PSMA-expressing tumors. Representative images of slices fixed in paraffin and stained with anti–human PSMA, pan-Akt, and phospho-Akt1 antibodies (bars, 100 µm). (B) Global changes in the phosphorylation status of components of the PI3K pathway were determined with the NanoPro 1000 system (Protein Simple). NanoPro-based analysis of PI3K’s catalytic subunits in LNCaP-Ctrl cells following 2 h stimulation with monoglutamated folate (Glu-Fol) or an mGluR I agonist (L-Quisqualic acid; PSMA inhibitor: 2-PMPA) in basal medium deprived of serum, folate and glutamate, showing that PSMA facilitates the phosphorylation of PI3K-p110β though activation of mGluR I. Before stimulation, the cells were starved for 24 h in basal medium. Phosphorylation alterations were calculated as the difference observed between the treatment group and unstimulated cells (n = 3 per condition). (C) Inhibition of PI3K-p110β suppresses Akt activation, similar to PSMA and mGluR I inhibition in prostate cancer. LNCaP-Ctrl cells were treated with Glu-Fol and inhibitors for 2 h. Phosphorylation was assessed through a reverse-phase protein array (n = 3 per treatment). (D) The fluorescent Akt-specific substrate LS456, whose fluorescence emission shifts from emission in the near-infrared range (λ = 800 nm) to the red sector of the visible light (λ = 700 nm) upon phosphorylation by the kinase, was used to assess Akt activation by PSMA. LNCaP-Ctrl cells were treated with Glu-Fol and pharmacological agents for 2 h, as described above for panel B of this figure (n = 12 per treatment). (E) Inhibition of PSMA’s enzymatic activity with 2-PMPA decreases Akt’s phosphorylation in PSMA-expressing cells. Cells were grown in complete medium and treated for 2 h with 2-PMPA. Control cells were treated with 1× PBS. Changes in Akt’s phosphorylation were determined with a reverse-phase protein array (n = 3 per treatment). Graphs show mean ± SEM. ns, not significant; *, P < 0.05; ***, P < 0.001; ****, P < 0.0001 (ordinary one-way ANOVA).
Figure 4.
Figure 4.
Released glutamate from PSMA-processed glutamate folate activates mGluR I and up-regulates cytoplasmic calcium levels. (A) PSMA activates Akt in a p110b-dependent fashion, using glutamate as the molecular messenger. PC3-Ctrl cells grown on 96-well plates were supplemented with Glu-Fol, recombinant PSMA, and inhibitors for 2 h. The change in 700-nm fluorescence intensity emission of the Akt-specific substrate LS456 was calculated based on unstimulated cells (n = 12 per treatment). (B) The released glutamate by PSMA engages mGluR I, mobilizing calcium to the cytoplasm. PC3-Ctrl cells were incubated in basal medium deprived of serum, folate, and glutamate for 4 h at 37°C, 5% CO2 (mGluR I agonist: (S)-3,5,-DHPG; n = 8 per condition). Detection was achieved with the Fluo-4 Direct calcium kit. (C) Intracellular calcium levels upon stimulation of cells expressing wild-type (PSMAwt) and enzymatically inactive PSMA (PSMAmut). Changes in [Ca2+] were calculated with respect to nonstimulated PC3-PSMAwt or PC3-PSMAmut cells grown in basal RPMI medium, as mentioned above for panel B of this figure (mGluR I agonist: (S)-3,5,-DHPG; n = 8 per condition). Graphs show mean ± SEM. *, P < 0.05, ***, P < 0.001; ****, P < 0.0001 (ordinary one-way ANOVA).
Figure 5.
Figure 5.
Inhibition of PSMA improves response to chemotherapy in vitro. (A–D) Inhibition of FOLH’s enzymatic activity and PI3K-p110β reduces the viability of PSMA-expressing prostate cancer cells. Cells were treated with PI3K inhibitors (Pan: BKM120; PI3Kα: BYL719; PI3Kβ: GSK2636771; [inhibitor] = 200 nM) and 2-PMPA (200 nM) for 48 h at 37°C, 5% CO2 (n = 12 per treatment). Viability was determined with the Alamar blue assay. Graphs show means ± SEM. ns, not significant; **, P < 0.01; ***, P < 0.001; ****, P < 0.0001 (ordinary one-way ANOVA).
Figure 6.
Figure 6.
Inhibition of PSMA’s enzymatic activity in vivo provides a treatment benefit. (A and B) Male, athymic nude mice with LNCaP-Ctrl xenografts on both of their flanks were treated daily with vehicle (1× PBS) or PSMA inhibitor (2-PMPA) administered i.v. immediately after implantation of the cells (n = 10 mice per cohort). Graphs show mean ± SEM. ****, P < 0.0001 (unpaired t test). Inset shows the day where the tumors were first detected (n = 10 mice per cohort). (C) Survival curves of mice bearing LNCaP-Ctrl xenografts on their flanks (n = 10 animals per cohort). The animals received daily i.v. treatment (vehicle: 1× PBS; PSMA inhibitor: 2-PMPA) during the course of the study (75 d after implantation; day 0, implantation day). p-value was determined using the Gehan–Breslow–Wilcoxon test. (D) Waterfall plot of animals having bilateral LNCaP-Ctrl xenografts on their flanks (n = 5 mice per group). Treatment was administered daily i.v. on day 24 after xenograft implantation (enzalutamide, 0.5 mg/kg; 2-PMPA, 20 mg/kg; Enz + 2-P, 0.5 mg/kg enzalutamide and 20 mg/kg 2-PMPA). The black arrowhead on the timelines of C and D indicates the day of xenograft implantation, the purple arrowhead the day treatment started, the purple line the length of treatment, and the continuous blue line that the treatment was daily.
Figure 7.
Figure 7.
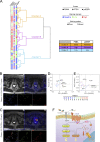
Expression of PSMA in patients allows their stratification in distinct groups that reflect activation of the Akt/mTOR pathway. (A) Clustering analysis of patient tissue microarray data formed three distinct clusters where elevated PSMA expression correlated with enhanced 4EBP1 phosphorylation in cluster B, whereas decreased PSMA expression was associated with decreased 4EBP1 phosphorylation in cluster C. Cluster A underlines disease and sample heterogeneity, where mixed PSMA staining (sample with PSMA-positive and negative foci) was associated with either lack or low phosphorylation of 4EBP1. The expression of PTEN is displayed but was not considered in the clustering analysis. (B and C) PET/MRI of prostate cancer patients using the PSMA-specific probe 68Ga-HBED-CC, and immunofluorescence microscopy analysis of cancer tissue from patients obtained after prostatectomy. Twelve patients were imaged with PET/MRI, and tissue samples from multiple sites of the biopsy were screened. Representative images are shown, with the corresponding microscopy slides stained for PSMA, pAKTS473 (Cell Signaling), and Hoechst 33342 (bars, 50 µm). (D and E) Biplot representation suggests that PSMA expression is associated with Akt phosphorylation at residues S473 and T308 and that PSMA immunostaining and PSMA-based PET (SUV values) are both good indicators of Akt’s phosphorylation, as these parameters are closer to Akt in the two-dimensional space defined by the primary principal components PC1 and PC2 than other clinical parameters. The open circles show the samples stained per patient and underlie sample variability caused by the heterogeneous nature of the disease. Biplots derived from PCA of patients imaged with PET/MR and their samples underwent histopathological analyses, including immunofluorescence microscopy for phosphorylation of Akt on residues S473 and T308. Gleason, Gleason score; SUVmean, mean standardized uptake value of PSMA tracer. (F) Schematic representation of the overall pathway involving PSMA and induction of tumor-supporting signaling based on our data. Free glutamate released from PSMA after processing of glutamate-containing substrates activates mGluR I receptors found on the plasma membrane of prostate cancer cells. Activation of the glutamatergic system induces downstream calcium signaling and activation of the PI3K cascade, positively regulating tumor growth.

Comment in

References

    1. Carver B.S., Chapinski C., Wongvipat J., Hieronymus H., Chen Y., Chandarlapaty S., Arora V.K., Le C., Koutcher J., Scher H., et al. . 2011. Reciprocal feedback regulation of PI3K and androgen receptor signaling in PTEN-deficient prostate cancer. Cancer Cell. 19:575–586. 10.1016/j.ccr.2011.04.008 - DOI - PMC - PubMed
    1. Chang S.S., O’Keefe D.S., Bacich D.J., Reuter V.E., Heston W.D., and Gaudin P.B.. 1999. Prostate-specific membrane antigen is produced in tumor-associated neovasculature. Clin. Cancer Res. 5:2674–2681. - PubMed
    1. Cizmecioglu O., Ni J., Xie S., Zhao J.J., and Roberts T.M.. 2016. Rac1-mediated membrane raft localization of PI3K/p110β is required for its activation by GPCRs or PTEN loss. eLife. 5:e17635 10.7554/eLife.17635 - DOI - PMC - PubMed
    1. Cohen-Solal K.A., Boregowda R.K., and Lasfar A.. 2015. RUNX2 and the PI3K/AKT axis reciprocal activation as a driving force for tumor progression. Mol. Cancer. 14:137 10.1186/s12943-015-0404-3 - DOI - PMC - PubMed
    1. Colombatti M., Grasso S., Porzia A., Fracasso G., Scupoli M.T., Cingarlini S., Poffe O., Naim H.Y., Heine M., Tridente G., et al. . 2009. The prostate specific membrane antigen regulates the expression of IL-6 and CCL5 in prostate tumour cells by activating the MAPK pathways. PLoS One. 4:e4608 10.1371/journal.pone.0004608 - DOI - PMC - PubMed

Publication types