. 2017 Dec 4;214(12):3531-3541.
doi: 10.1084/jem.20171048. Epub 2017 Nov 15.

Host resistance to endotoxic shock requires the neuroendocrine regulation of group 1 innate lymphoid cells

Affiliations

Host resistance to endotoxic shock requires the neuroendocrine regulation of group 1 innate lymphoid cells

Linda Quatrini et al. J Exp Med. .

Abstract

Upon infection, the immune system produces inflammatory mediators important for pathogen clearance. However, inflammation can also have deleterious effect on the host and is tightly regulated. Immune system-derived cytokines stimulate the hypothalamic-pituitary-adrenal (HPA) axis, triggering endogenous glucocorticoid production. Through interaction with ubiquitously expressed glucocorticoid receptors (GRs), this steroid hormone has pleiotropic effects on many cell types. Using a genetic mouse model in which the gene encoding the GR is selectively deleted in NKp46+ innate lymphoid cells (ILCs), we demonstrated a major role for the HPA pathway in host resistance to endotoxin-induced septic shock. GR expression in group 1 ILCs is required to limit their IFN-γ production, thereby allowing the development of IL-10-dependent tolerance to endotoxin. These findings suggest that neuroendocrine axes are crucial for tolerization of the innate immune system to microbial endotoxin exposure through direct corticosterone-mediated effects on NKp46-expressing innate cells, revealing a novel strategy of host protection from immunopathology.


Figures

Figure 1.
Figure 1.
Repeated LPS injections promote resistance to endotoxic shock and GC production. (A) Protocol to induce endotoxin-induced sepsis or endotoxin tolerance. For the sepsis model, mice not injected or injected with PBS at day 1 (D-1) behave equally (not depicted). (B) Survival curve for mice receiving LPS injections according to the protocol in A. n = 11–12 mice pooled from two independent experiments; ***, P < 0.001 (Mantel-Cox test). (C and D) Cytokines and corticosterone concentrations in the serum. Data are presented as mean ± SEM. Each symbol in D represents a single mouse. n = 6–10 mice pooled from two independent experiments; *, P < 0.05; **, P < 0.01; ***, P < 0.001; ****, P < 0.0001 (one-way ANOVA).
Figure 2.
Figure 2.
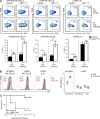
Corticosterone inhibits IFN-γ production by NK cells through GR signaling. (A and B) GR expression and isotype control (Ig) in NK cells (NKp46+NK1.1+CD3CD19), T cells (CD3+NK1.1CD19), B cells (CD19+CD3), macrophages (CD11b+F4/80+), neutrophils (CD11b+Ly6G+), and DCs (CD11c+MHCII+) from the spleen (A) and NK cells (NKp46+NK1.1+CD3CD19DX5+CD49a) and resident ILC1s (NKp46+NK1.1+CD3CD19DX5CD49a+) in the liver (B). The numbers on the plots represent the mean fluorescence intensity. The data shown are representative of two independent experiments with five mice per group. (C) Splenocytes were left untreated (medium) or stimulated for 4 h with IL-12 and IL-18 in the presence of 500 nM corticosterone (cort) or vehicle alone. The percentage of IFN-γ+ NKp46+ cells is indicated for each FACS plot. Histograms represent these percentages as means + SEM (n = 7–8 mice pooled from three independent experiments; *, P < 0.05; Mann–Whitney U test).
Figure 3.
Figure 3.
Spleen and liver group 1 ILC responsiveness to GCs is required for the development of endotoxin tolerance. (A) Percentage of IFN-γ+ NK cells (NKp46+NK1.1+CD3CD19DX5+CD49a) and ILC1s (NKp46+NK1.1+CD3CD19DX5CD49a+) in the spleen and liver of control and GRNcr1-iCre mice, as determined 6 h after LPS priming and challenge. Data are presented as representative FACS plots and as mean ± SEM (n = 5–7 mice pooled from two independent experiments; *, P < 0.05; **, P < 0.01; ***, P < 0.001; Mann–Whitney U test). (B) GR expression and isotype control (Ig) measured 6 h after PBS injection or LPS challenge. FACS histograms and the mean value of the GR/Ig ratio from one representative experiment with three mice per group are shown. Each symbol represents a single mouse. (C) Survival curve for control and GRNcr1-iCre mice (n = 7–11 mice pooled from two experiments; **, P < 0.01; Mantel–Cox test).
Figure 4.
Figure 4.
Higher levels of IFN-γ in GRNcr1-iCre mice are associated with lower systemic IL-10 concentrations. (A) Cytokines in the serum, as determined 6 h after priming and after challenge with LPS. Data are presented as mean ± SEM (n = 14–16 mice pooled from three experiments; **, P < 0.01; ****, P < 0.0001; Student’s t test). (B) FACS plots showing IL-10 intracellular staining in Ly6C+CD11blow cells 6 h after challenge with LPS, after gating out CD19+, CD3+, and CD11c+ cells. The data shown are representative of two independent experiments with seven mice per group.
Figure 5.
Figure 5.
IFN-γ neutralization restores tolerance to endotoxin and IL-10 production in GRNcr1-iCre mice. (A, B, and D) Mice received LPS injections and were treated with anti–IFN-γ (B) or anti–IL-10 (D) neutralizing antibodies or isotype control (IgG1) antibodies at the priming phase. (B) Survival curves for control and GRNcr1-iCre mice treated with anti–IFN-γ neutralizing antibodies (n = 8–11 mice from two independent experiments, plotted in separated graphs; **, P < 0.01; Mantel–Cox test). (C) Cytokines in the serum as determined 6 h after challenge with LPS. Data are presented as mean ± SEM (n = 8–14 mice pooled from three independent experiments; **, P < 0.01; one-way ANOVA). (D) Survival curves for control and GRNcr1-iCre mice treated with anti–IL-10 neutralizing antibodies (n = 8–11 mice from two independent experiments, plotted on separate graphs; **, P < 0.01; Mantel–Cox test).

Similar articles

Cited by

References

    1. Adib-Conquy M., Adrie C., Fitting C., Gattolliat O., Beyaert R., and Cavaillon J.M.. 2006. Up-regulation of MyD88s and SIGIRR, molecules inhibiting Toll-like receptor signaling, in monocytes from septic patients. Crit. Care Med. 34:2377–2385. 10.1097/01.CCM.0000233875.93866.88 - DOI - PubMed
    1. Balkhy H.H., and Heinzel F.P.. 1999. Endotoxin fails to induce IFN-gamma in endotoxin-tolerant mice: deficiencies in both IL-12 heterodimer production and IL-12 responsiveness. J. Immunol. 162:3633–3638. - PubMed
    1. Berg D.J., Kühn R., Rajewsky K., Müller W., Menon S., Davidson N., Grünig G., and Rennick D.. 1995. Interleukin-10 is a central regulator of the response to LPS in murine models of endotoxic shock and the Shwartzman reaction but not endotoxin tolerance. J. Clin. Invest. 96:2339–2347. 10.1172/JCI118290 - DOI - PMC - PubMed
    1. Bertini R., Bianchi M., and Ghezzi P.. 1988. Adrenalectomy sensitizes mice to the lethal effects of interleukin 1 and tumor necrosis factor. J. Exp. Med. 167:1708–1712. 10.1084/jem.167.5.1708 - DOI - PMC - PubMed
    1. Bhattacharyya S., Brown D.E., Brewer J.A., Vogt S.K., and Muglia L.J.. 2007. Macrophage glucocorticoid receptors regulate Toll-like receptor 4-mediated inflammatory responses by selective inhibition of p38 MAP kinase. Blood. 109:4313–4319. 10.1182/blood-2006-10-048215 - DOI - PMC - PubMed