. 2017 Dec 4;214(12):3775-3790.
doi: 10.1084/jem.20161868. Epub 2017 Nov 15.

Igβ ubiquitination activates PI3K signals required for endosomal sorting

Affiliations

Igβ ubiquitination activates PI3K signals required for endosomal sorting

Margaret Veselits et al. J Exp Med. .

Abstract

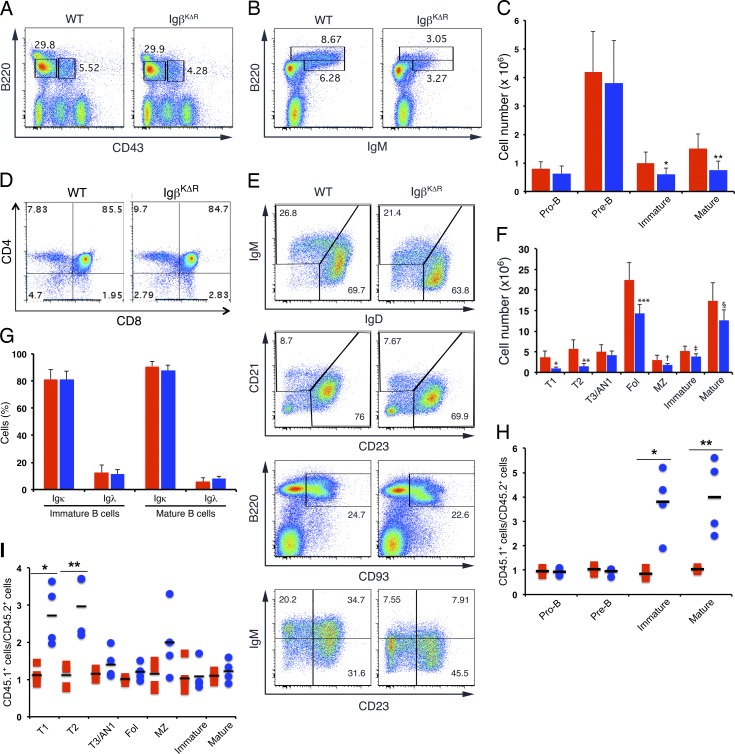
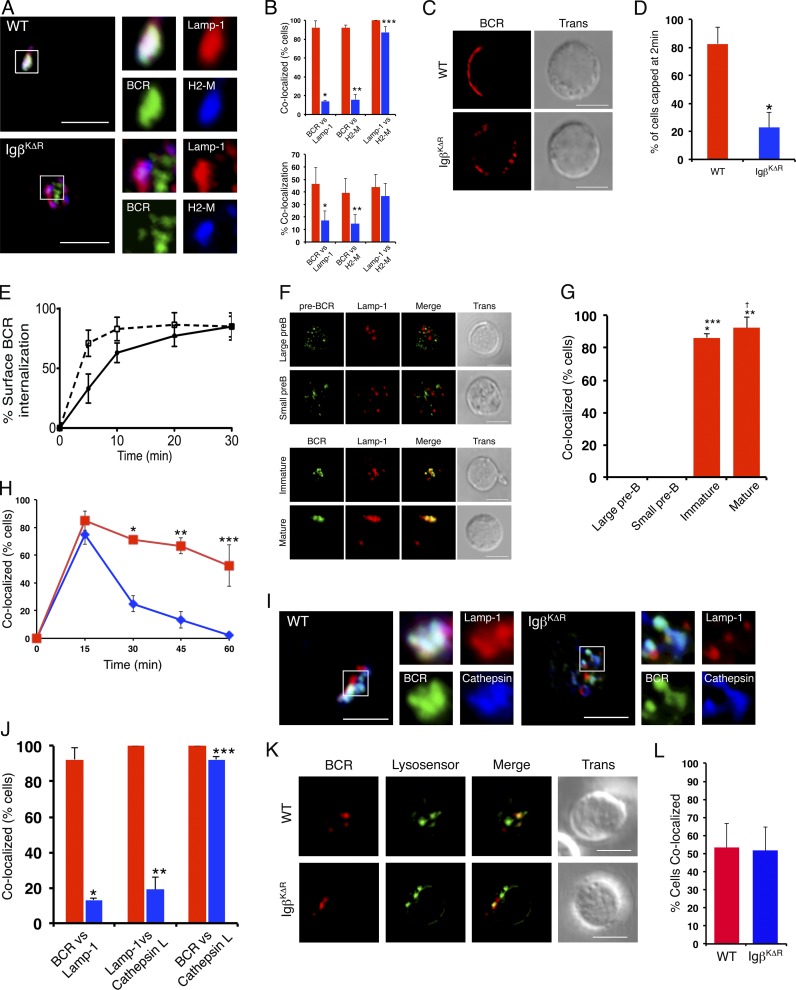
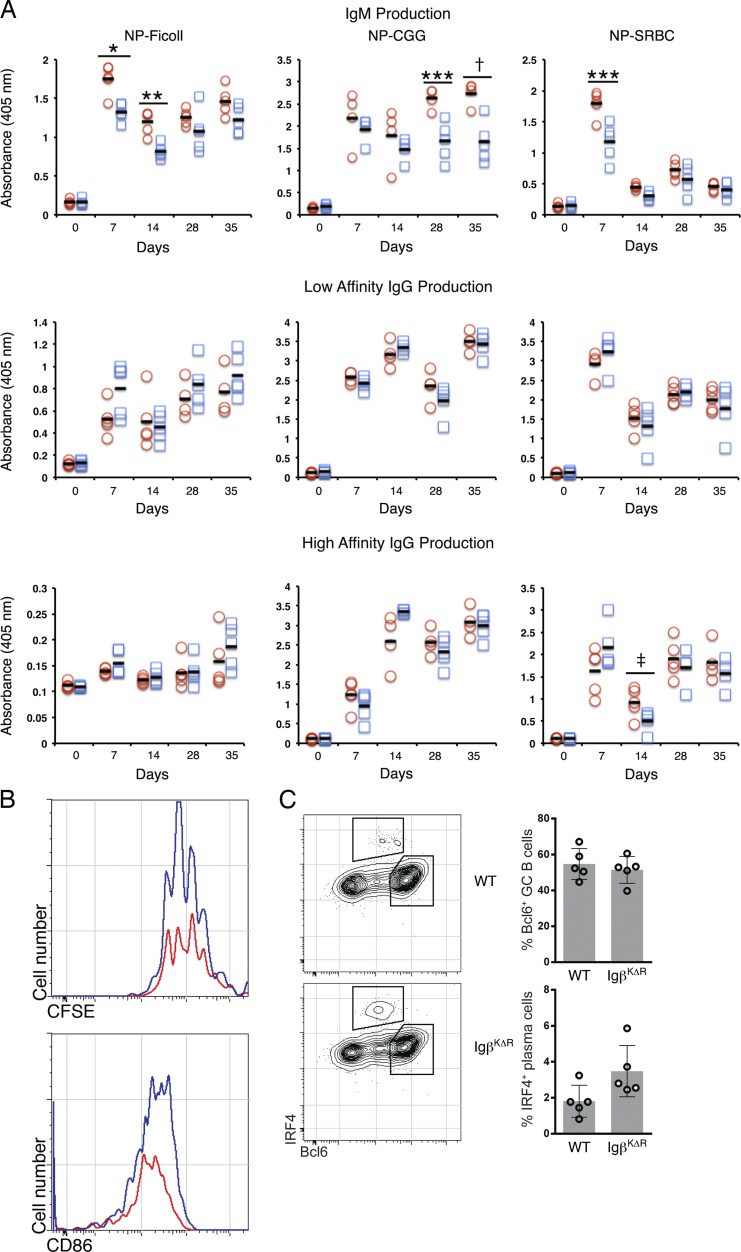
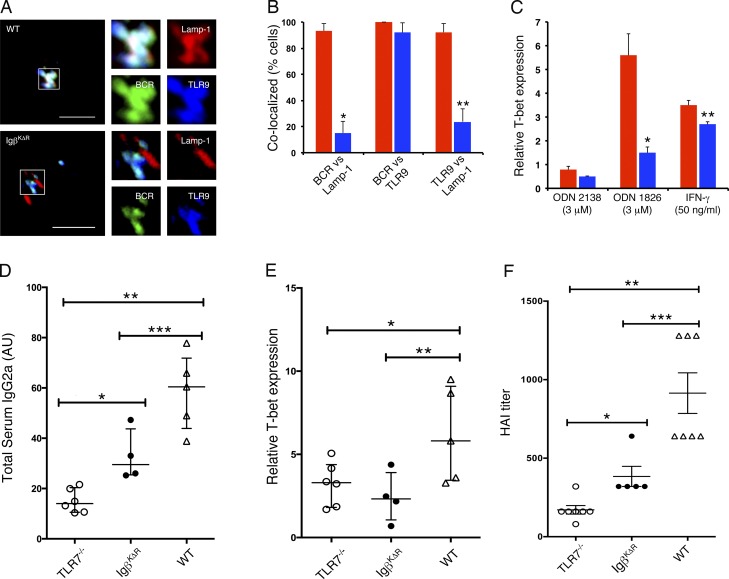
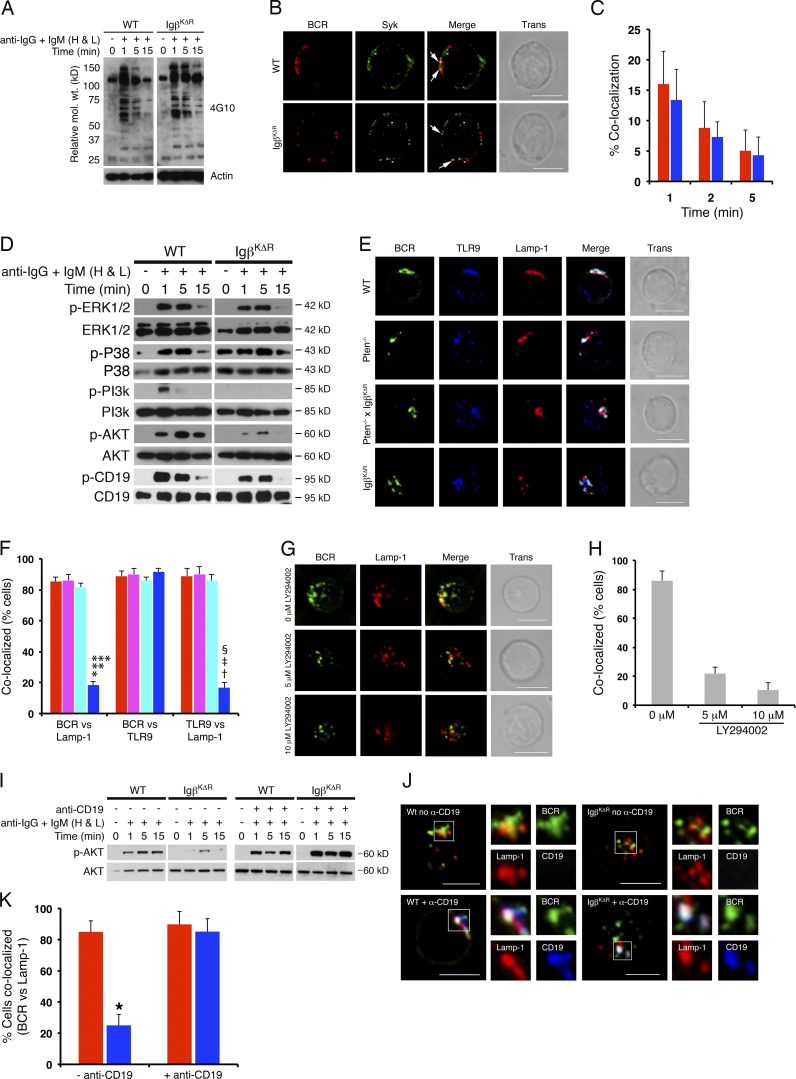
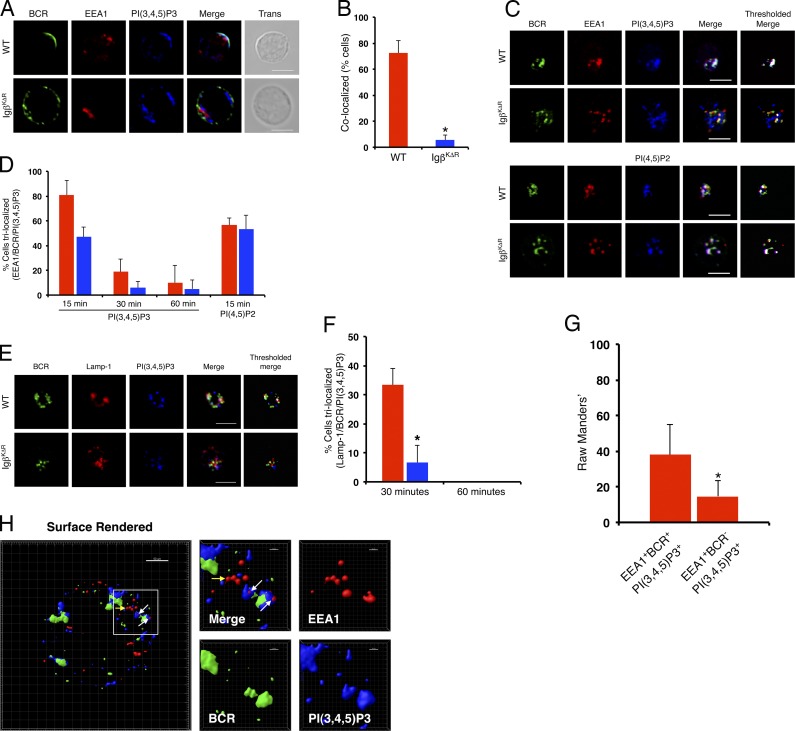
A wealth of in vitro data has demonstrated a central role for receptor ubiquitination in endocytic sorting. However, how receptor ubiquitination functions in vivo is poorly understood. Herein, we report that ablation of B cell antigen receptor ubiquitination in vivo uncouples the receptor from CD19 phosphorylation and phosphatidylinositol 3-kinase (PI3K) signals. These signals are necessary and sufficient for accumulating phosphatidylinositol (3,4,5)-trisphosphate (PIP3) on B cell receptor-containing early endosomes and proper sorting into the MHC class II antigen-presenting compartment (MIIC). Surprisingly, MIIC targeting is dispensable for T cell-dependent immunity. Rather, it is critical for activating endosomal toll-like receptors and antiviral humoral immunity. These findings demonstrate a novel mechanism of receptor endosomal signaling required for specific peripheral immune responses.


Figures

Figure 1.
Figure 1.
Selective defect in late B cell development in IgβKΔR mice. (A–C) BM cells from WT and IgβKΔR mice were isolated, stained with antibodies specific for B220, CD43, and IgM, and analyzed by flow cytometry (A and B). Total numbers of each population (C) are provided for WT (red) and IgβKΔR (blue) mice; error bars indicate mean ± SD. *, P = 0.0167; **, P = 0.0022 (n = 3). (D) Thymic CD3+ lymphocytes were analyzed by flow cytometry for CD4 and CD8 expression (n = 3 mice). (E and F) Splenic B cells from the indicated mice were stained with antibodies specific for B220, IgM, IgD, CD21, CD23, and CD93 and then analyzed by flow cytometry. Representative flow cytometric plots are shown in E, and total numbers of each population from WT (red) and IgβKΔR (blue) are shown in F. *, P = 0.0046; **, P = 0.0021; ***, P = 0.0044; †, P = 0.0009; ‡, P = 0.0012; §, P = 0.0033 (n = 4 mice per condition). (G) Flow cytometry of WT (red) and IgβKΔR (blue) BM immature and mature B cells stained for Igκ and Igλ (n = 3). (H and I) BM from WT CD45.1 mice was mixed 50:50 with WT CD45.2 (red) or IgβKΔR CD45.2 (blue) BM and then transferred into irradiated WT CD45.1 mice. After 8–9 wk, BM (*, P = 0.006; **, P = 0.009; H) and spleen (*, P = 0.003; **, P = 0.002; I) were analyzed by flow cytometry. Each point represents one mouse. Horizontal lines represent means. MZ, marginal zone. Fol, follicular B cells.
Figure 2.
Figure 2.
Defective capping and MIIC targeting of IgβKΔR BCRs. (A and B) WT and IgβKΔR splenocytes were stimulated with FITC-conjugated IgG and IgM (H+L) F(ab)2 antibodies for 30 min in vitro, then fixed, stained with antibodies specific for Lamp-1 and H2-M, and visualized by confocal microscopy. Representative images. Quantitation of WT (red) or IgβKΔR (blue) samples (n = 3; B) based on percentage of cells with >25% overlap between the indicated markers (top) or percent colocalization of total immunofluorescence (Manders’ Coefficient; bottom). Top: *, P = 1.3 × 10⁻¹²; **, P = 3.6 × 10⁻¹⁵; ***, P = 0.0061. Bottom: *, P = 4.0 × 10⁻⁵; **, P = 10−6. (C and D) Cells were stimulated as in A for 2 min, fixed, and visualized by confocal microscopy. Representative images (n = 3) provided in C with quantitation of percentage of cells displaying capping provided in D; *, P = 1.4 × 10⁻⁵. (E) Internalization of BCRs from surface of WT (closed circles) or IgβKΔR (open squares) B splenocytes after stimulation with PE-conjugated IgG- and IgM (H+L)-specific F(ab)2 antibodies; P = 0.0291 (two-way ANOVA; n = 3). (F and G) WT BM large pre–B cell, small pre–B cell, immature, and mature B cell populations were isolated by flow cytometry. Pre-BCRs were stimulated with biotin-conjugated anti-SL156, and BCRs were stimulated FITC-conjugated IgG and IgM (H+L) F(ab)2 antibodies, respectively, for 30 min at 37°C, and then fixed and counterstained with anti–Lamp-1 antibodies. The pre-BCR was stained with rabbit antibiotin, followed by donkey anti–rabbit Alexa Fluor 488, and all cells were visualized by confocal microscopy. Representative images are provided in F, whereas the fraction of each cell population demonstrating >25% colocalization between the receptor and Lamp-1 are provided in G (n = 3). *, P = 8.10−10 versus large pre–B; **, P = 9.8 × 10⁻¹⁶ versus large pre–B; ***, P = 1.03 × 10⁻⁹ versus small pre–B; †, P = 1.4 × 10⁻¹⁵ versus small pre–B. (H) WT (red) or IgβKΔR (blue) B splenocytes were stimulated with FITC-conjugated IgG- and IgM (H+L)-specific F(ab)2 antibodies for the indicated times in vitro, fixed, and stained with EEA1-specific antibodies, and the percentage of cells demonstrating >25% BCR colocalization with EEA1 was plotted as a function of time. *, P = 0.293; **, P = 6.22 × 10⁻⁶; ***, P = 0.0004. (I and J) WT or IgβKΔR B splenocytes were stimulated with FITC-conjugated IgG- and IgM (H+L)-specific F(ab)2 antibodies for 30 min in vitro, fixed, and stained with antibodies specific for Lamp-1 and Cathepsin L. Representative images. Quantitative assessment of colocalization of the indicated markers for WT (red) or IgβKΔR (blue) cells (J; n = 3). *, P = 1.16 × 10⁻¹⁶; **, P = 4.92 × 10⁻¹²; ***, P = 0.0010. (K and L) Cells were loaded with 1 µM LysoSensor and then stimulated with Texas red–conjugated IgG- and IgM (H+L)-specific F(ab)2 antibodies for 30 min. (K) Cells were visualized by confocal microscopy. (I) Provided are the percentage of cells demonstrating >25% colocalization. WT (red bar) and IgβKΔR (blue bar); error bars represent mean ± SD (n = 3). Bars, 5 µm.
Figure 3.
Figure 3.
Normal T-dependent and T-independent humoral immunity in IgβKΔR mice. (A) WT (open red circles) or IgβKΔR (open blue squares) mice were immunized with T-independent (NP-Ficoll) or T-dependent (NP-CGG or NP-SRBC) antigens, and sera were assayed for NP-specific IgM antibodies (top) and either low-affinity (middle) or high-affinity (bottom) IgG antibodies by ELISA on the indicated days (each symbol represents assay from one mouse). *, P = 0.002; **, P = 0.001; ***, P = 0.005; †, P = 0.004; ‡, P = 0.05. Horizontal lines represent means. (B and C) WT MD4 or IgβKΔRxMD4 were labeled with CFSE and transferred along with HEL-SRBC into B6.SJL-PtprcaPepcb/BoyJ mice. (B) Spleens were harvested 3 d after transfer and analyzed by flow cytometry (n = 5 each group). (C) Spleens were harvested 6 d after transfer/immunization and analyzed by flow cytometry. Individual mice indicated in bar graph (right). Error bars represent mean ± SD.
Figure 4.
Figure 4.
Diminished BCR-dependent activation of endosomal TLRs. (A and B) WT and IgβKΔR splenocytes were stimulated with FITC-conjugated IgG- and IgM (H+L)-specific F(ab)2 antibodies for 30 min in vitro and then fixed, stained with antibodies specific for Lamp-1 and TLR9, and visualized by confocal microscopy. Representative images. Bars, 5 µm (A). Corresponding quantitation of WT (red) or IgβKΔR (blue) samples (n = 3); *, P = 1.3 × 10⁻¹⁵; **, P = 4.4 × 10⁻⁸ (B). (C) In vitro assay of T-bet induction in response to ODN 1826 or control ODN (2138) targeted through the BCR (n = 3); *, P = 0.004; **, P = 0.0003. (D and E) The indicated mouse strains were immunized with heat-inactivated influenza virus, boosted at day 21, and serum and splenic B cells were assayed at day 42. (D) IgG2a influenza-specific titers; *, P = 0.0054; ** P < 0.0001; ***, P = 0.0238. (E) Corresponding expression of T-bet mRNA in splenic B cells; *, P = 0.0484; **, P = 0.00507. (F) Serum hemagglutinin inhibition assay in response to influenza infection, day 27; *, P = ns; **, P < 0.0001; ***, P = 0.0034. For D–F, each symbol represents one mouse. Significance was determined by ANOVA in combination with Bonferroni multiple comparison test. P-values as indicated or **, P ≤ 0.01; ***, P ≤ 0.001. Error bars represent mean ± SD.
Figure 5.
Figure 5.
PI3K-mediated entry into MIIC. (A) WT or IgβKΔR B splenocytes were stimulated with IgG- and IgM (H+L)-specific F(ab)2 antibodies for the indicated times, and total cell lysates were resolved by SDS-PAGE and immunoblotted with antiphosphotyrosine antibodies. Representative of three independent experiments. (B and C) WT or IgβKΔR splenocytes were stimulated with Texas red–labeled anti-IgG and -IgM (H+L) F(ab)2 antibodies for up to 5 min and then fixed, stained with antibodies to Syk, and visualized by confocal microscopy. Representative images provided in B. White arrows denote regions of colocalization. 1-min stimulation with percent colocalization (Manders’ coefficient) between WT (red) or IgβKΔR (blue) BCR and Syk as a function of time after stimulation (C; n = 3). (D) WT or IgβKΔR B splenocytes (106 cells per sample) were stimulated with IgG- and IgM (H+L)-specific F(ab)2 antibodies for the indicated times, and total cell lysates were resolved by SDS-PAGE and immunoblotted with the indicated antibodies. Each panel is representative of three independent experiments. (E and F) Splenocytes from WT (red), Pten−/− (purple), Pten−/−xIgβKΔR (light blue), and IgβKΔR (dark blue) mice were stimulated with FITC-conjugated IgG- and IgM (H+L)-specific F(ab)2 antibodies for 30 min in vitro and then fixed, stained with antibodies specific for Lamp-1 and TLR9, and visualized by confocal microscopy. Representative images (E) and quantitation of samples (n = 3). *, P = 0.0004; †, P = 0.0016 versus WT; **, P = 0.0004; ‡, P = 0.0023 versus Pten−/−; ***, P = 0.0002; §, P = 0.0014 versus Pten−/−xIgβKΔR (F). (G and H) WT splenocytes were treated with LY294002, stimulated, and visualized by confocal microscopy as above. (I) WT or IgβKΔR splenic B cells stimulated with IgG- and IgM (H+L)-specific F(ab)2 antibodies in the presence or absence of CD19 cross-linking for the indicated times. Total cell lysates blotted as indicated (n = 3). (J and K) Confocal microscopy of cells stimulated for 30 min as in I and stained with the indicated antibodies. Represented images (J) and quantitation across three experiments (K; *, P = 0.0014). Bars, 5 µm. Approximate molecular weight is shown. Error bars represent mean ± SD.
Figure 6.
Figure 6.
Igβ ubiquitin–dependent endosomal PIP3. (A–F) Splenocytes from WT or IgβKΔR mice were stimulated with FITC-conjugated IgG- and IgM (H+L)-specific F(ab)2 antibodies for the indicated times, then fixed, stained with antibodies specific for Lamp-1, EEA1, and PIP3, and visualized by confocal microscopy. Representative images from 2 min (A), and quantitation of samples (n = 3); *, P = 2.6 × 10⁻⁵ (B). Representative images from 15 min of cells with EEA1 (C), and quantitations (n = 3; *, P ≤ 0.05; D). Representative images of cells treated as in C stained with Lamp-1 (E) with quantitations in F (n = 3; *, P = 0.0048). Quantitation of BCR+ and BCREEA1+ early endosomes containing PIP3 (n = 3). *, P > 0.0001 (G). (H) Splenocytes from WT mice were stimulated as above with Alexa Fluor 488–conjugated IgG- and IgM (H+L)-specific F(ab)2 antibodies for 15 min, then fixed and stained with antibodies for EEA1 and PIP3, and then visualized by superresolution confocal microscopy. White arrows indicate trilocalization of BCR+EEA1+PIP3+ vesicles, and the yellow arrow indicates BCREEA1+PIP3 vesicles. Bars, 5 µm. Error bars represent mean ± SD.

Similar articles

Cited by

References

    1. Aiba Y., Kameyama M., Yamazaki T., Tedder T.F., and Kurosaki T.. 2008. Regulation of B-cell development by BCAP and CD19 through their binding to phosphoinositide 3-kinase. Blood. 111:1497–1503. 10.1182/blood-2007-08-109769 - DOI - PubMed
    1. Allen C.D., Okada T., and Cyster J.G.. 2007. Germinal-center organization and cellular dynamics. Immunity. 27:190–202. 10.1016/j.immuni.2007.07.009 - DOI - PMC - PubMed
    1. Blum J.S., Wearsch P.A., and Cresswell P.. 2013. Pathways of antigen processing. Annu. Rev. Immunol. 31:443–473. 10.1146/annurev-immunol-032712-095910 - DOI - PMC - PubMed
    1. Bretscher P., and Cohn M.. 1970. A theory of self-nonself discrimination. Science. 169:1042–1049. 10.1126/science.169.3950.1042 - DOI - PubMed
    1. Carter R.H., and Myers R.. 2008. Germinal center structure and function: lessons from CD19. Semin. Immunol. 20:43–48. 10.1016/j.smim.2007.12.007 - DOI - PMC - PubMed