

A phase 1 study of romidepsin and pralatrexate reveals marked activity in relapsed and refractory T-cell lymphoma
- PMID: 29141948
- PMCID: PMC5790128
- DOI: 10.1182/blood-2017-09-806737
A phase 1 study of romidepsin and pralatrexate reveals marked activity in relapsed and refractory T-cell lymphoma
Abstract
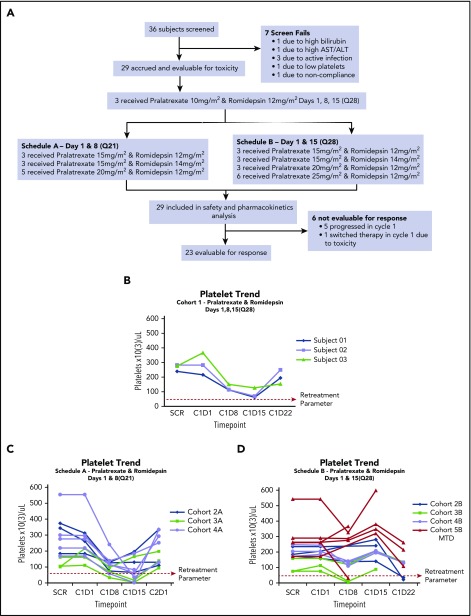
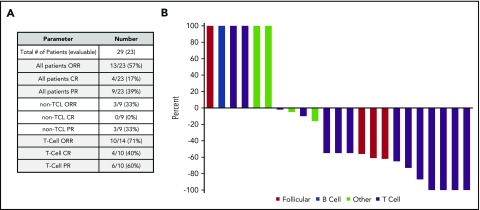
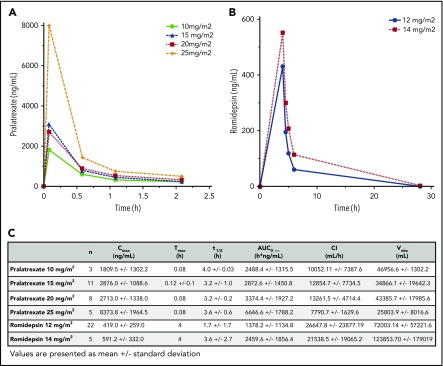
Peripheral T-cell lymphomas (PTCL) are a group of rare malignancies characterized by chemotherapy resistance and poor prognosis. Romidepsin and pralatrexate were approved by the US Food and Drug Administration for patients with relapsed/refractory PTCL, exhibiting response rates of 25% and 29% respectively. Based on synergy in preclinical models of PTCL, we initiated a phase 1 study of pralatrexate plus romidepsin in patients with relapsed/refractory lymphoma. This was a single institution dose-escalation study of pralatrexate plus romidepsin designed to determine the dose-limiting toxicities (DLTs), maximum tolerated dose, pharmacokinetic profile, and response rates. Patients were treated with pralatrexate (10 to 25 mg/m2) and romidepsin (12 to 14 mg/m2) on 1 of 3 schedules: every week × 3 every 28 days, every week × 2 every 21 days, and every other week every 28 days. Treatment continued until progression, withdrawal of consent, or medical necessity. Twenty-nine patients were enrolled and evaluable for toxicity. Coadministration of pralatrexate and romidepsin was safe, well tolerated, with 3 DLTs across all schedules (grade 3 oral mucositis × 2; grade 4 sepsis × 1). The recommended phase 2 dose was defined as pralatrexate 25 mg/m2 and romidepsin 12 mg/m2 every other week. Twenty-three patients were evaluable for response. The overall response rate was 57% (13/23) across all patients and 71% (10/14) in PTCL. The phase 1 study of pralatrexate plus romidepsin resulted in a high response rate in patients with previously treated PTCL. A phase 2 study in PTCL will determine the efficacy of the combination. This trial was registered at www.clinicaltrials.gov as #NCT01947140.
© 2018 by The American Society of Hematology.
Conflict of interest statement
Conflict-of-interest disclosure: The authors declare no competing financial interests.
Figures


Comment in
-
Peripheral T-cell lymphoma: novel backbone.Blood. 2018 Jan 25;131(4):375-376. doi: 10.1182/blood-2017-11-817734. Blood. 2018. PMID: 29371206 No abstract available.
References
-
- Abouyabis AN, Shenoy PJ, Lechowicz MJ, Flowers CR. Incidence and outcomes of the peripheral T-cell lymphoma subtypes in the United States. Leuk Lymphoma. 2008;49(11):2099-2107. - PubMed
-
- Fisher RI, Gaynor ER, Dahlberg S, et al. Comparison of a standard regimen (CHOP) with three intensive chemotherapy regimens for advanced non-Hodgkin’s lymphoma. N Engl J Med. 1993;328(14):1002-1006. - PubMed
-
- d’Amore F, Relander T, Lauritzsen GF, et al. Up-front autologous stem-cell transplantation in peripheral T-cell lymphoma: NLG-T-01. J Clin Oncol. 2012;30(25):3093-3099. - PubMed
-
- Schmitz N, Trümper L, Ziepert M, et al. Treatment and prognosis of mature T-cell and NK-cell lymphoma: an analysis of patients with T-cell lymphoma treated in studies of the German High-Grade Non-Hodgkin Lymphoma Study Group. Blood. 2010;116(18):3418-3425. - PubMed
Publication types
MeSH terms
Substances
Associated data
Grants and funding
LinkOut - more resources
Full Text Sources
Other Literature Sources
Medical
