

BRACHYURY directs histone acetylation to target loci during mesoderm development
- PMID: 29141987
- PMCID: PMC5757217
- DOI: 10.15252/embr.201744201
BRACHYURY directs histone acetylation to target loci during mesoderm development
Abstract
T-box transcription factors play essential roles in multiple aspects of vertebrate development. Here, we show that cooperative function of BRACHYURY (T) with histone-modifying enzymes is essential for mouse embryogenesis. A single point mutation (TY88A) results in decreased histone 3 lysine 27 acetylation (H3K27ac) at T target sites, including the T locus, suggesting that T autoregulates the maintenance of its expression and functions by recruiting permissive chromatin modifications to putative enhancers during mesoderm specification. Our data indicate that T mediates H3K27ac recruitment through a physical interaction with p300. In addition, we determine that T plays a prominent role in the specification of hematopoietic and endothelial cell types. Hematopoietic and endothelial gene expression programs are disrupted in TY88A mutant embryos, leading to a defect in the differentiation of hematopoietic progenitors. We show that this role of T is mediated, at least in part, through activation of a distal Lmo2 enhancer.
Keywords: Brachyury; Lmo2; H3K27 acetylation; T‐box factors; autoregulation.
© 2017 The Authors.
Figures
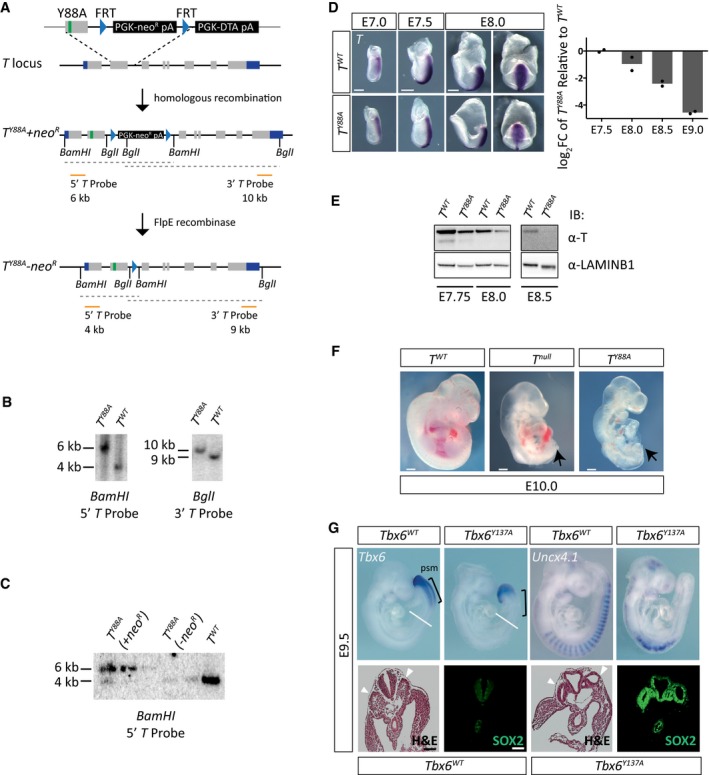
Schematic illustrating the homologous recombination strategy to insert the Y88A point mutation in the endogenous T locus. The neomycin selection cassette was removed by transient expression of FlpE recombinase. Orange lines depict probes used for Southern blotting to confirm integration of the mutation. Restriction enzyme sites used for Southern blotting are depicted.
Southern blot of genomic DNA from mESCs to detect homologous recombination of the Y88A mutation using T probes depicted in (A). A 4‐kb and 9‐kb band correspond to the wild‐type T allele using the 5′ and 3′ T probe, respectively, while a 6‐kb band and 10‐kb band correspond to the mutated T Y88A allele containing the neomycin selection cassette.
Southern blot of genomic DNA from mESCs to detect removal of the neomycin selection cassette after expression of FlpE recombinase using the 5′ T probe.
WISH analysis of T Y88A mutants shows T expression is normal at early stages, E7.0–7.5, and begins to decrease at E8.0. At E8.0, the left panels show a lateral view of the embryo, while the right panels show a dorsal view. The graph depicts RT‐qPCR analysis of whole embryos to confirm loss of T maintenance in T Y88A mutants compared to T WT controls. The mean of n = 2 biological replicates of pools of three to four embryos is depicted. Scale bar: 200 μm.
Immunoblot from whole embryo lysates using an α‐T antibody shows a progressive loss of T protein during development in the T Y88A mutant. α‐LAMIN‐B1 was used as a loading control.
T Y88A mutants resemble T null embryos on the gross morphological level, displaying a complete loss of posterior mesoderm (arrow). Scale bar: 200 μm.
Tbx6 and Uncx4.1 expression in E9.5 Tbx6 Y137A embryos by WISH. Black brackets indicate the PSM, and white lines indicate the plane of section shown in the lower panels. Hematoxylin and eosin staining of sections through the trunk of E9.5 Tbx6 Y137A embryos revealed the presence of two ectopic neural tubes (arrowheads) at the expense of somite tissue, which was confirmed by immunofluorescent staining for the neural tube marker SOX2. Scale bar: 180 μm.
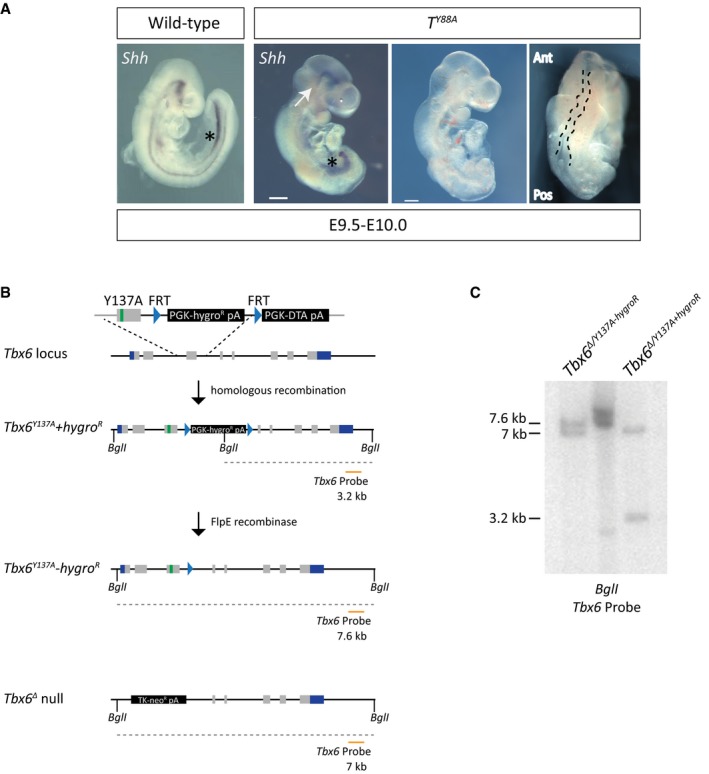
Whole‐mount in situ hybridization for Shh expression reveals the loss of notochordal structures in T Y88A mutant embryos at E9.5–10.0. White arrows point to the remnants of notochord at the rostral end of the embryo. Asterisks depict Shh staining in the foregut. The panels on the right display the kinked neural tube (outlined with a black dashed line) and truncated posterior mesoderm in the T Y88A mutant embryos at E9.5. The T Y88A mutant embryo is the same as that in Fig 1F. Scale bar: 200 μm. Ant, anterior; Pos, posterior.
Schematic illustrating the homologous recombination strategy to insert the Y137A point mutation in the endogenous Tbx6 locus. The hygromycin selection was removed by expression of FlpE recombinase. The orange line depicts the probe used for Southern blotting to confirm integration of the mutation and removal of the hygromycin resistance cassette. BglI restriction enzyme sites used for Southern blotting are depicted.
Southern blot of mESC genomic DNA to detect homologous recombination of the Y137A mutation and removal of the hygromycin cassette using the probe depicted in (B). The 3.2‐kb band corresponds to the Tbx6 Y137A mutant allele containing the hygromycin selection cassette, while the 7.6‐kb band corresponds to the Tbx6 Y137A allele with the selection cassette removed. The 7.0‐kb band corresponds to the Tbx6 Δ null allele.
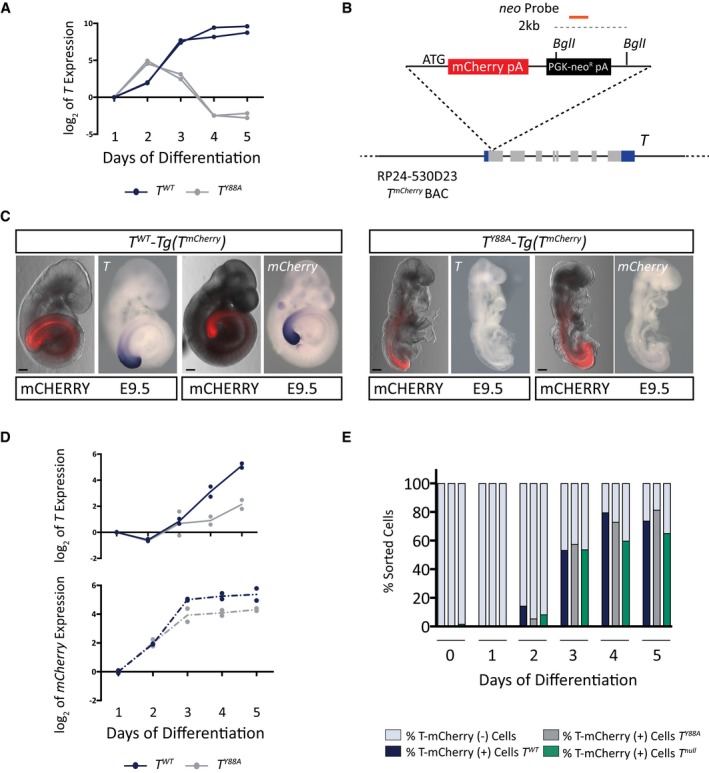
T expression in in vitro‐differentiated mesodermal cells from control T WT and T Y88A during the 5‐day differentiation protocol as measured by RT‐qPCR. n = 2 biological replicates.
Schematic illustrating the RP24‐530D23 T mCherry reporter BAC. The orange line depicts the probe used to confirm genomic integration of the reporter BAC by Southern blot. Restriction enzyme sites used for Southern blotting are depicted.
Fluorescence images and WISH analysis of T WT‐ and T Y88A ‐Tg(T mCherry) with T and mCherry probes at E9.5 reveals the co‐localization of T and mCherry expression from the T mCherry reporter BAC. mCHERRY protein is more stable than the mCherry RNA and is localized to a broader domain. Scale bars: 200 μm.
T and mCherry expression in T WT ‐ and T Y88A ‐Tg(T mCherry) cells differentiated into mesoderm in vitro during the 5‐day differentiation protocol, as measured by RT‐qPCR. The mean of n = 2 biological replicates is depicted.
Bar graph depicting the percentage of T‐mCHERRY(+) mesodermal cells and T‐mCHERRY(−) cells, as assayed by FACS, in T WT ‐, T Y88A ‐, and T null ‐Tg(T mCherry) cells during the 5‐day in vitro differentiation protocol.
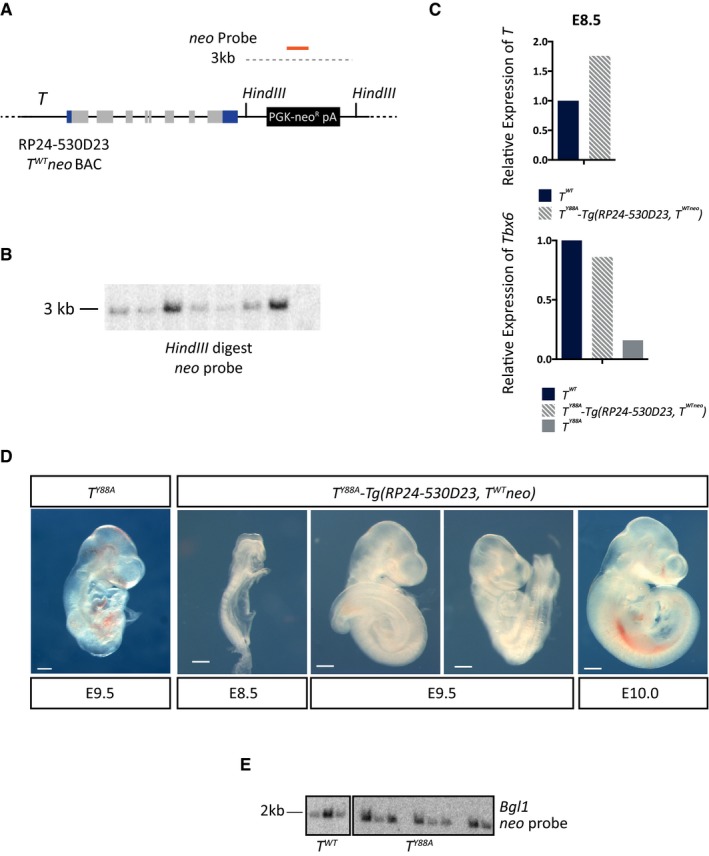
Schematic illustrating the wild‐type RP24‐530D23‐T WT neo BAC, containing a neomycin selection cassette recombined into the BAC backbone. The orange line depicts the probe used to confirm genomic integration of the T WT neo BAC by Southern blot. Restriction enzyme sites used for Southern blotting are also depicted.
Southern blot of genomic DNA from T Y88A mESC clones in which the T WT neo BAC was randomly integrated. Positive clones display a band at 3 kb when using a probe against the neomycin resistance gene.
RT–qPCR analysis of T and Tbx6 expression in whole embryos at E8.5 reveals that T expression and Tbx6 expression are rescued in T Y88A ‐Tg(RP24‐530D23, T WT neo) embryos.
Bright field images of T Y88A ‐Tg(RP24‐530D23, T WT neo) embryos from E8.5 to E10.0 reveals rescue of gross morphological phenotypes when compared to the T Y88A mutant. Scale bar: 200 μm.
Southern blot of genomic DNA from T WT and T Y88A mESC clones in which the T mCherry reporter BAC was randomly integrated. Positive clones display a band at 2 kb when using a probe against the neomycin resistance gene.
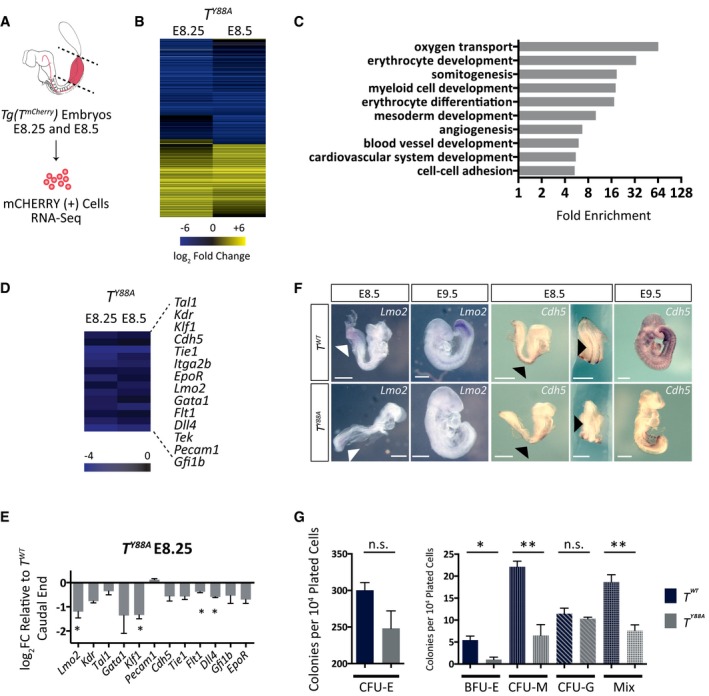
Schematic illustrating microdissection and FACS of T‐mCHERRY(+) mesodermal cells from caudal ends of Tg(T mCherry) embryos for RNA‐Seq analysis. Dotted lines indicate microdissection planes before FACS.
Heat map illustrating dysregulated gene expression (log2 fold change ≥ 1.3 when compared to T WT) in T Y88A mutant mesodermal cells at E8.25 and E8.5.
Statistical overrepresentation test (PANTHER) of GO terms from dysregulated genes in T Y88A mutant mesodermal cells at E8.25 and E8.5 (log2 fold change ≥ 1.3 when compared to T WT). Gray bars indicate fold enrichment over the reference Mus musculus gene list.
Heat map displaying downregulation of multiple genes important for hematopoietic and endothelial cell development in T Y88A mutants at E8.25 and E8.5 from the RNA‐Seq.
RT‐qPCR validation of gene expression in microdissected caudal ends of E8.25 T Y88A mutants compared to T WT control. n = 3 biological replicates of pools of five microdissected caudal ends. Error bars = SEM. *P ≤ 0.05 using a one‐sample t‐test.
WISH analysis of Lmo2 expression in T Y88A compared to T WT control embryos from E8.5 to E9.5. White arrowheads indicate Lmo2 expression in the caudal end of embryos. WISH analysis of Cdh5 expression in T Y88A compared to T WT control embryos from E8.5 to E9.5. Black arrowheads indicate expression of Cdh5 in the developing dorsal aorta. Scale bar: 500 μm.
CFC assay using cells derived from embryoid bodies of T WT and T Y88A mESCs. The graph represents the number of colonies per 104 plated cells. n = 3 biological replicates, with each replicate comprised of three technical replicates. Error bars = SEM. *P < 0.05, **P < 0.01 using the unpaired t‐test. n.s. not significant. CFU‐E, colony‐forming unit erythroid; BFU‐E, burst‐forming unit erythroid; CFU‐M, colony‐forming unit macrophage; CFU‐G, colony‐forming unit granulocyte; Mix, presence of two or more myeloid progenitor cell types (macrophage, granulocyte, or erythroid).
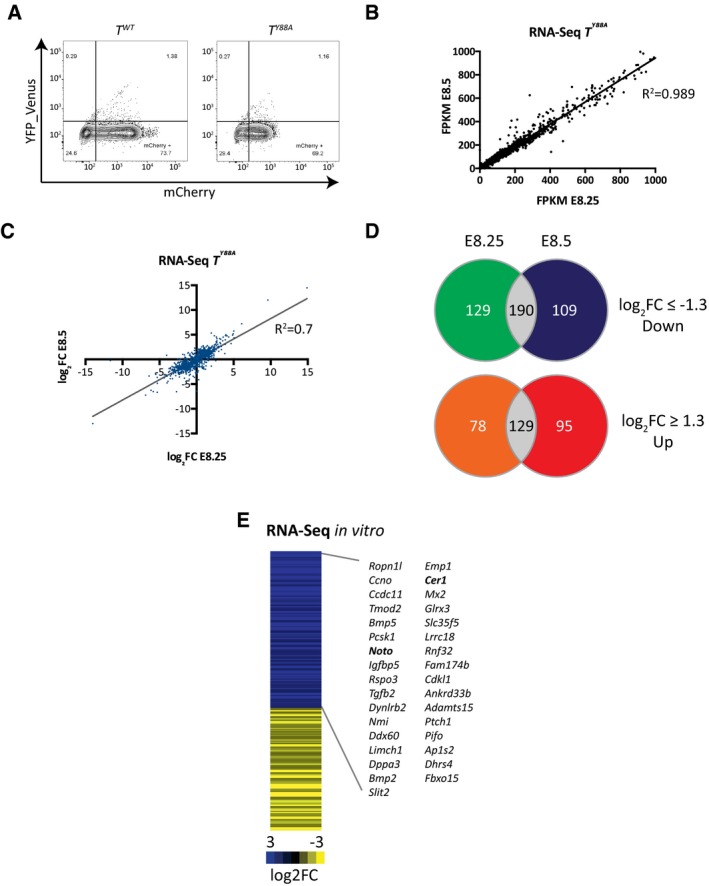
FACS plots from the sorting of T‐mCHERRY‐positive cells from T WT and T Y88A embryos for RNA‐seq.
Scatter plot of FPKM values from RNA‐Seq using mesodermal cells of T Y88A embryos at E8.25 and E8.5 (one biological replicate for each timepoint).
Scatter plot of log2 fold change values comparing T Y88A mutant mesodermal cells to T WT at E8.25 and E8.5 (log2 fold change ≥ 1.3).
Venn diagrams illustrating genes that are dysregulated both at E8.25 and E8.5 in T Y88A mutant mesodermal cells compared to T WT (log2 fold change ≥ 1.3).
Heat map depicting dysregulated gene expression (log2 fold change ≥ 1.3) in T Y88A mesodermal cells differentiated in vitro compared to T WT from RNA‐Seq of one biological replicate. Gene names correspond to genes that are downregulated and contain a nearby TBS with reduced H3K27ac (fold change > 1.4). Bold gene names indicate known T targets.
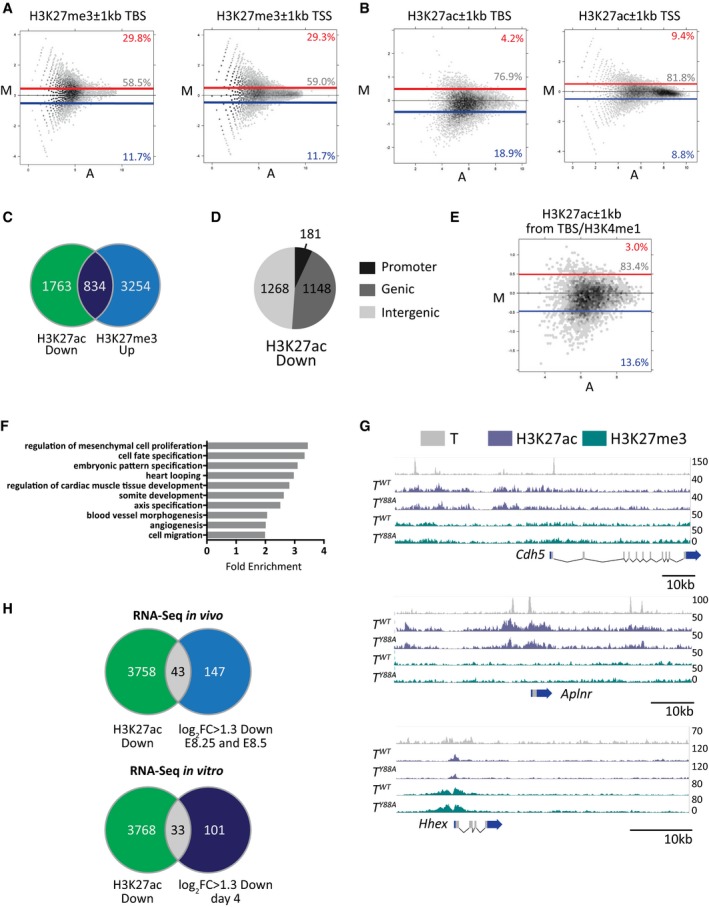
MA plots of H3K27me3 ChIP‐Seq (one biological replicate) read density ±1 kb from transcriptional start sites (TSS, with TBS removed) and TBS. Blue and red lines depict fold change values of −1.4 and 1.4, respectively. The percentage of regions above and below this threshold (red and blue, respectively) are indicated on the plots.
MA plot of H3K27ac ChIP‐seq (one biological replicate) read density ±1 kb from T binding sites and TSS (with TBS removed) in T WT versus T Y88A mutant mesodermal cells differentiated in vitro. Blue and red lines depict fold change values of −1.4 and 1.4, respectively. The percentage of regions above and below this threshold (red and blue, respectively) are indicated on the plots.
Overlap of TBS with higher H3K27me3 and lower H3K27ac (fold change > 1.4) from one biological ChIP‐Seq replicate each.
Genomic distribution of TBS with lower H3K27ac (fold change > 1.4).
MA plots of H3K27ac read density ±1 kb from TBS regions that overlap K4me1 peaks. Blue and red lines depict fold change values of −1.4 and 1.4, respectively. The percentage of regions above and below this threshold (red and blue, respectively) are indicated on the plots.
Statistical overrepresentation test (PANTHER) of GO terms from genes nearby regions of lower H3K27ac in T Y88A mutant mesodermal cells differentiated in vitro (fold change > 1.4 when compared to T WT). Gray bars indicate fold enrichment over the reference Mus musculus gene list.
Genome browser tracks depicting T binding in mesodermal cells differentiated in vitro, and H3K27ac and H3K27me3 at TBS of target genes.
Venn diagram illustrating the overlap between downregulated gene expression from RNA‐Seq in vivo (log2 fold change ≥ 1.3) and the neighboring two to three genes from each TBS with reduced H3K27ac (fold change > 1.4) from one biological ChIP‐Seq replicate. The lower Venn diagram illustrates the overlap between downregulated gene expression from RNA‐Seq from in vitro‐differentiated mesodermal cell (log2 fold change ≥ 1.3) and the neighboring two to three genes from each TBS with reduced H3K27ac (fold change > 1.4).
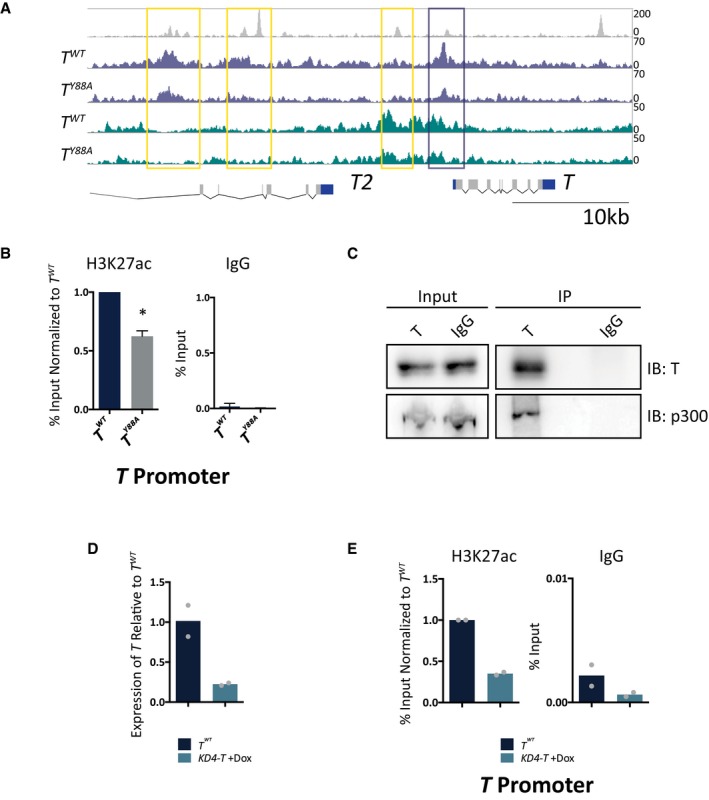
Genome browser tracks depicting H3K27ac/me3 and T binding at the T locus in mesodermal cells differentiated in vitro. Yellow and purple boxes indicate T binding sites with decreased H3K27ac.
ChIP‐qPCR analysis of H3K27ac at the TBS of the T promoter, corresponding to the purple box, in T WT and T Y88A in vitro‐differentiated mesodermal cells at day 4. IgG ChIP was used as a negative control. Error bars depict SD of n = 3–4 biological replicates. *P = 0.005 using a one‐sample t‐test.
Immunoprecipitation of endogenous T from in vitro‐differentiated mesodermal cells at day 4 revealed an interaction with endogenous p300, as assayed by immunoblotting. IgG was used as a negative control. Blot is representative of n = 3 biological replicates.
RT‐qPCR analysis of T expression in KD4‐T mESCs compared to T WT at day 4 of the in vitro differentiation protocol. Doxycycline was administered at day 2 of the protocol to induce expression of shRNA hairpins directed against T 39. The mean of n = 2 biological replicates is depicted.
ChIP‐qPCR analysis of H3K27ac at the T promoter in KD4‐T in vitro‐differentiated mesodermal cells at day 4. The mean of n = 2 biological replicates is depicted.
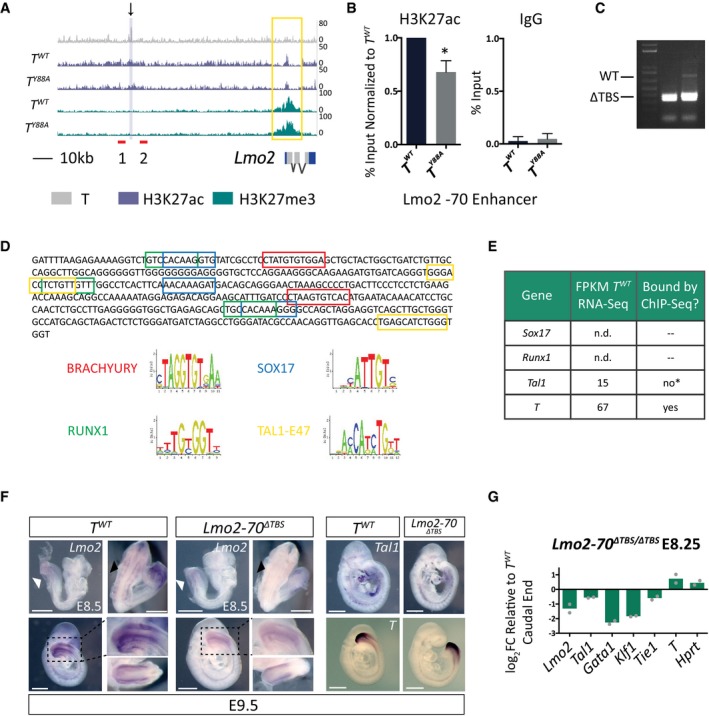
T binding and H3K27ac/me3 tracks from T WT and T Y88A mutant mesodermal cells differentiated in vitro at the Lmo2 locus. The black arrow indicates the T binding region that was removed using CRISPR/Cas9 nickase technology. Red lines indicate primers used to genotype the CRISPR/Cas9‐mediated deletion. The yellow box indicates altered H3K27ac at the TSS. The purple‐shaded box indicates the region amplified in the ChIP‐qPCR analysis.
ChIP‐qPCR analysis of H3K27ac at the −70 enhancer of Lmo2. IgG ChIP was used as a negative control. Error bars depict SD of n = 3–4 biological replicates. *P = 0.009 using a one‐sample t‐test.
Genotyping PCR from genomic DNA of Lmo2‐70 ΔTBS/ΔTBS mESC clones, using primers depicted in (A), revealed homozygous mutant deletion clones.
Motif analysis of the 400‐bp deleted region within the −70 enhancer of Lmo2. Colored boxes represent motifs pictured below, as predicted by ConSite 60.
Table illustrating the lack of Sox17 and Runx1 expression in RNA‐Seq of T WT embryos in vivo at E8.25. While Tal1 is expressed, previous reports have shown that it binds to the Lmo2 −75 enhancer in mesodermal cells, and not the Lmo2 −70 enhancer. *ChIP‐Seq tracks from 45 can be found in Fig EV5C. The only factor that is expressed and bound at the Lmo2‐70 enhancer by ChIP‐Seq is T.
WISH analysis of Lmo2, Tal1, and T expression in control T WT compared to Lmo2‐70 ΔTBS/ΔTBS embryos from E8.5 to E9.5. Black dotted lines indicate the magnification of a lateral view of the caudal end of the embryo, shown in the inset. The second inset pictured below is a dorsocaudal view of the tail. White arrowheads indicate Lmo2 expression in the caudal end mesoderm. Black arrowheads indicate Lmo2 expression in the intersomitic vessels. Scale bar: 500 μm.
RT‐qPCR analysis of gene expression in the caudal ends of E8.25 Lmo2‐70 ΔTBS/ΔTBS embryos compared to T WT control. The mean of n = 2 biological replicates of pools of five microdissected caudal ends is depicted.
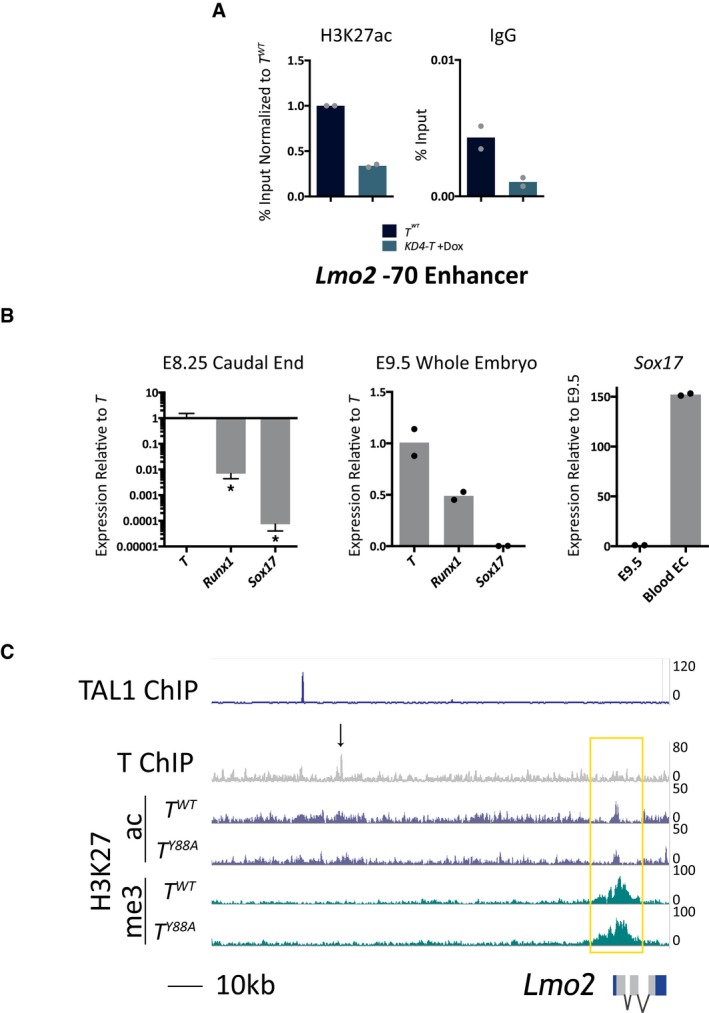
ChIP‐qPCR analysis of H3K27ac at the Lmo2 −70 enhancer in KD4‐T in vitro‐differentiated mesodermal cells at day 4. The mean of n = 2 biological replicates is depicted.
RT‐qPCR analysis of T, Runx1, and Sox17 expression in E8.25 caudal ends of T WT embryos. Levels of Runx1 and Sox17 are significantly lower than that of T in E8.25 caudal ends. Error bars depict SD of n = 3 biological replicates. *P < 0.02 using an unpaired t‐test. Middle graph depicts T, Runx1, and Sox17 levels in whole E9.5 embryos as a positive control for the qPCR primers. The mean of n = 2 biological replicates is depicted. Sox17 expression is low in E9.5 embryos, and the graph on the right depicts high Sox17 expression in CD31+ blood endothelial cells isolated from embryonic skin at E15.5. The mean of n = 2 biological replicates is depicted.
Genome browser tracks of the Lmo2 genomic locus with T, H3K27ac, and H3K27me3 tracks from the ChIP‐Seq analysis in this study. TAL1 ChIP‐Seq tracks were depicted using data from 45, and illustrate TAL1 binding in mesodermal cells at the Lmo2 −75 enhancer, approximately 7 kb upstream of T binding at the −70 enhancer. The black arrow indicates the region removed by CRISPR/Cas9‐mediated genome editing at the TBS of the Lmo2 −70 enhancer.
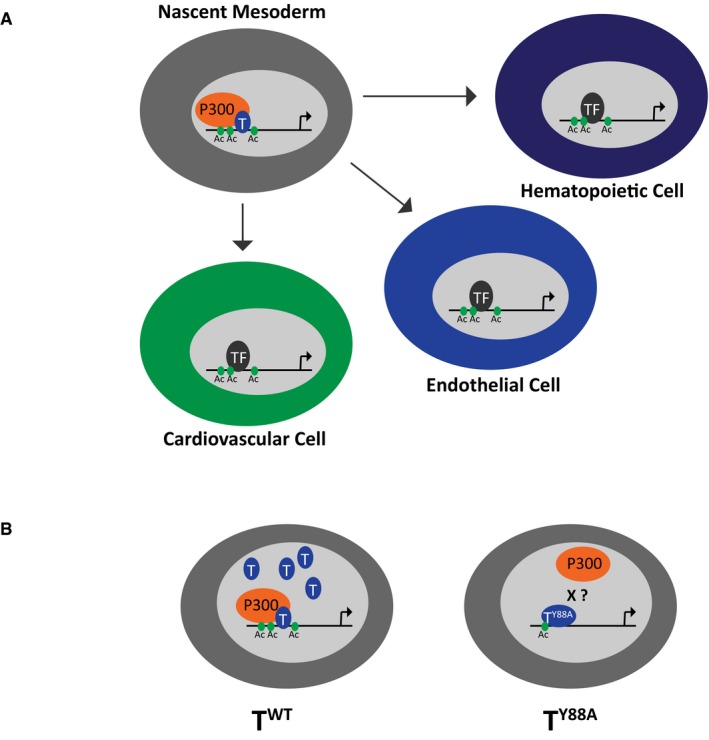
Schematic illustrating T‐mediated recruitment of p300 and H3K27ac in nascent mesoderm to target loci involved in development of cell types derived from the mesoderm, including hematopoietic, endothelial, and cardiovascular cells.
Schematic illustrating our proposed model showing that in wild‐type T mesodermal cells, recruitment of H3K27ac occurs at target loci. In the T Y88A mutant mesodermal cells, less H3K27ac is recruited to T target loci and there is less TY88A protein present. The X represents speculation that the Y88A mutation disrupts the interaction between T and p300.
References
-
- Dobrovolskaia‐Zavadskaia N (1927) Sur la mortification sponta‐nee de la queue chez la souris nouveau‐nee et sur l'existence d'un caractere hereditaire “non viable”. Compr Soc Biol 97: 114–116
-
- Herrmann BG, Labeit S, Poustka A, King TR, Lehrach H (1990) Cloning of the T gene required in mesoderm formation in the mouse. Nature 343: 617–622 - PubMed
-
- Müller CW, Herrmann BG (1997) Crystallographic structure of the T domain‐DNA complex of the Brachyury transcription factor. Nature 389: 884–888 - PubMed
Publication types
MeSH terms
Substances
LinkOut - more resources
Full Text Sources
Other Literature Sources
Molecular Biology Databases
Miscellaneous
