

Modelling the effects of phylogeny and body size on within-host pathogen replication and immune response
- PMID: 29142017
- PMCID: PMC5721155
- DOI: 10.1098/rsif.2017.0479
Modelling the effects of phylogeny and body size on within-host pathogen replication and immune response
Abstract
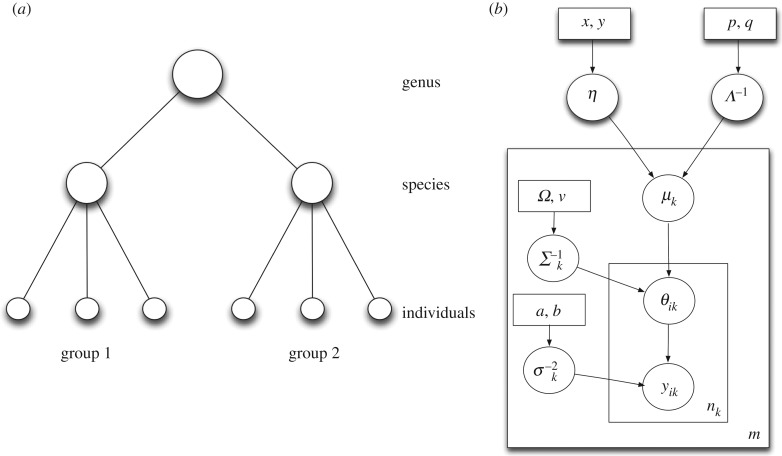
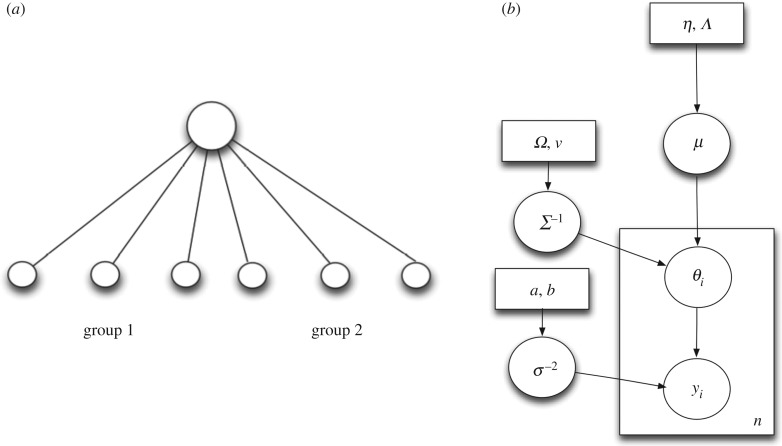
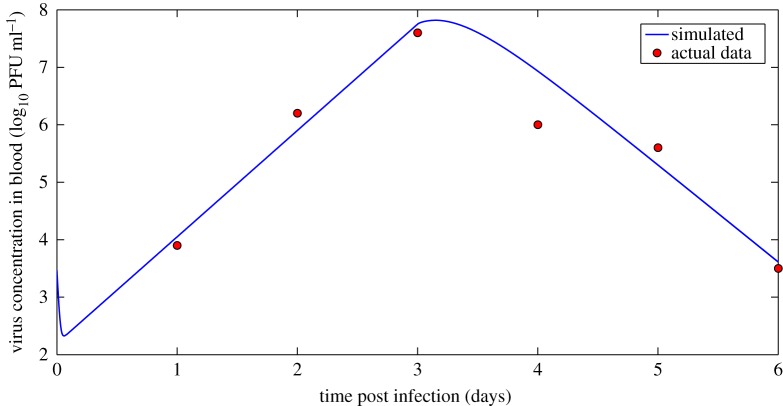
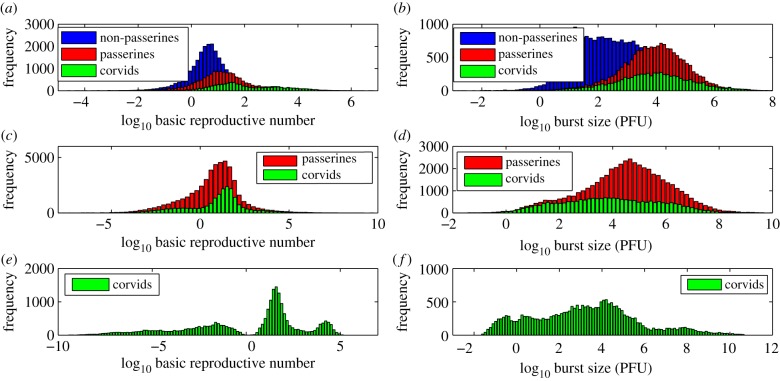
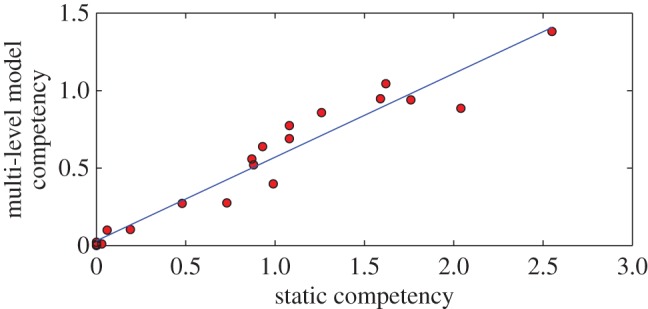
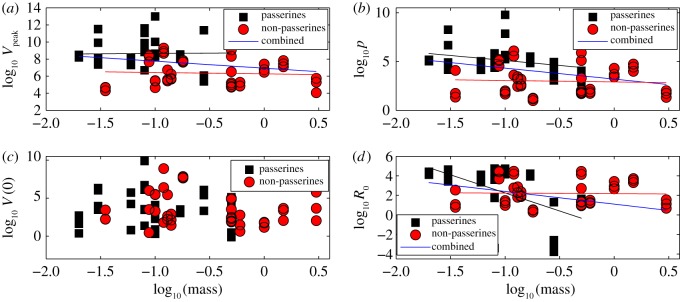
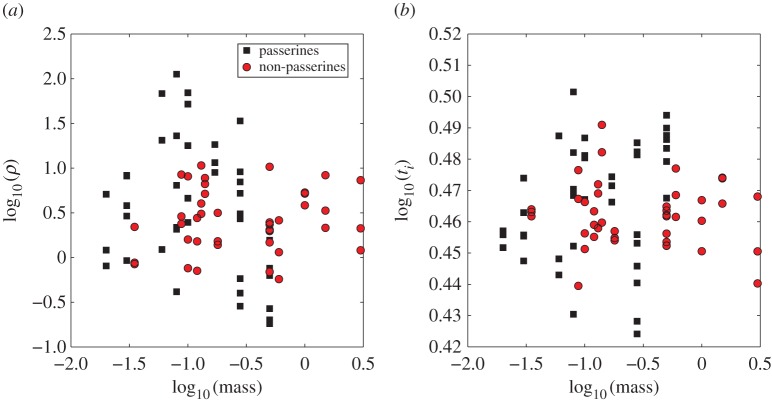
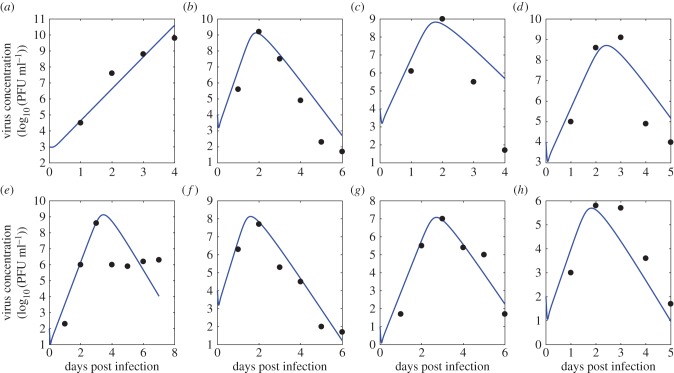
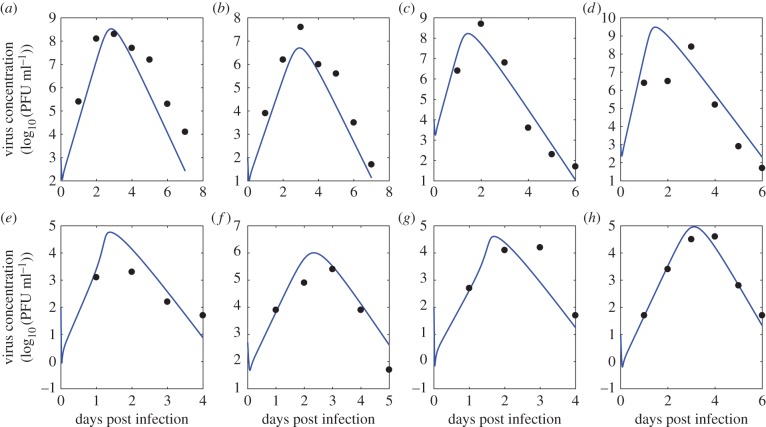
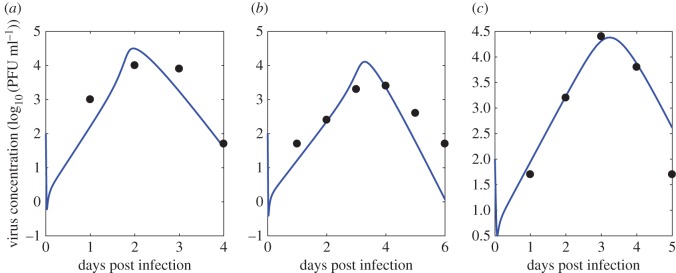
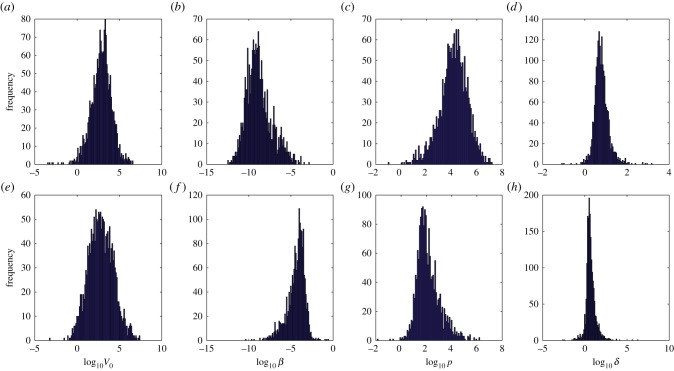
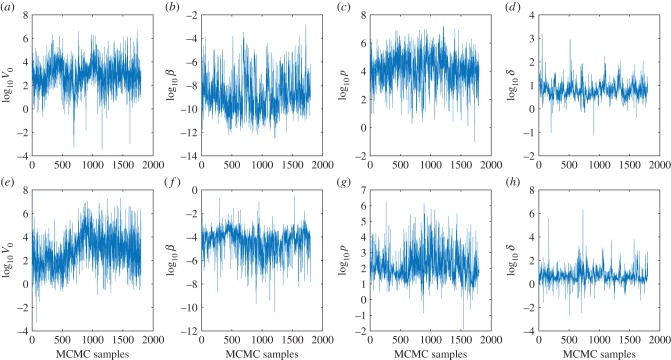
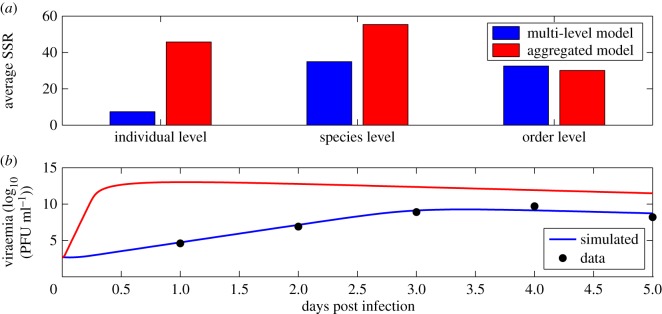
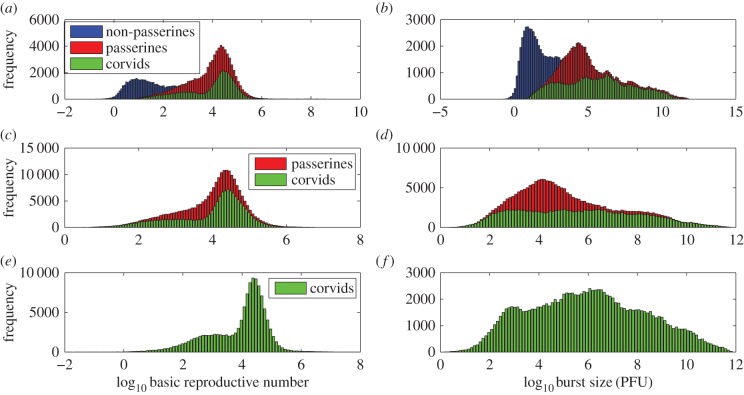
Understanding how quickly pathogens replicate and how quickly the immune system responds is important for predicting the epidemic spread of emerging pathogens. Host body size, through its correlation with metabolic rates, is theoretically predicted to impact pathogen replication rates and immune system response rates. Here, we use mathematical models of viral time courses from multiple species of birds infected by a generalist pathogen (West Nile Virus; WNV) to test more thoroughly how disease progression and immune response depend on mass and host phylogeny. We use hierarchical Bayesian models coupled with nonlinear dynamical models of disease dynamics to incorporate the hierarchical nature of host phylogeny. Our analysis suggests an important role for both host phylogeny and species mass in determining factors important for viral spread such as the basic reproductive number, WNV production rate, peak viraemia in blood and competency of a host to infect mosquitoes. Our model is based on a principled analysis and gives a quantitative prediction for key epidemiological determinants and how they vary with species mass and phylogeny. This leads to new hypotheses about the mechanisms that cause certain taxonomic groups to have higher viraemia. For example, our models suggest that higher viral burst sizes cause corvids to have higher levels of viraemia and that the cellular rate of virus production is lower in larger species. We derive a metric of competency of a host to infect disease vectors and thereby sustain the disease between hosts. This suggests that smaller passerine species are highly competent at spreading the disease compared with larger non-passerine species. Our models lend mechanistic insight into why some species (smaller passerine species) are pathogen reservoirs and some (larger non-passerine species) are potentially dead-end hosts for WNV. Our techniques give insights into the role of body mass and host phylogeny in the spread of WNV and potentially other zoonotic diseases. The major contribution of this work is a computational framework for infectious disease modelling at the within-host level that leverages data from multiple species. This is likely to be of interest to modellers of infectious diseases that jump species barriers and infect multiple species. Our method can be used to computationally determine the competency of a host to infect mosquitoes that will sustain WNV and other zoonotic diseases. We find that smaller passerine species are more competent in spreading the disease than larger non-passerine species. This suggests the role of host phylogeny as an important determinant of within-host pathogen replication. Ultimately, we view our work as an important step in linking within-host viral dynamics models to between-host models that determine spread of infectious disease between different hosts.
Keywords: Flavivirus; West Nile Virus; disease modelling; emerging diseases; hierarchical Bayesian models; mathematical modelling; zoonotic diseases; modelling diseases.
© 2017 The Author(s).
Conflict of interest statement
We declare we have no competing interests.
Figures
Similar articles
-
A MicroRNA Screen Identifies the Wnt Signaling Pathway as a Regulator of the Interferon Response during Flavivirus Infection.J Virol. 2017 Mar 29;91(8):e02388-16. doi: 10.1128/JVI.02388-16. Print 2017 Apr 15. J Virol. 2017. PMID: 28148804 Free PMC article.
-
A rapid and systematic review of the clinical effectiveness and cost-effectiveness of paclitaxel, docetaxel, gemcitabine and vinorelbine in non-small-cell lung cancer.Health Technol Assess. 2001;5(32):1-195. doi: 10.3310/hta5320. Health Technol Assess. 2001. PMID: 12065068
-
Signs and symptoms to determine if a patient presenting in primary care or hospital outpatient settings has COVID-19.Cochrane Database Syst Rev. 2022 May 20;5(5):CD013665. doi: 10.1002/14651858.CD013665.pub3. Cochrane Database Syst Rev. 2022. PMID: 35593186 Free PMC article.
-
How lived experiences of illness trajectories, burdens of treatment, and social inequalities shape service user and caregiver participation in health and social care: a theory-informed qualitative evidence synthesis.Health Soc Care Deliv Res. 2025 Jun;13(24):1-120. doi: 10.3310/HGTQ8159. Health Soc Care Deliv Res. 2025. PMID: 40548558
-
Cost-effectiveness of using prognostic information to select women with breast cancer for adjuvant systemic therapy.Health Technol Assess. 2006 Sep;10(34):iii-iv, ix-xi, 1-204. doi: 10.3310/hta10340. Health Technol Assess. 2006. PMID: 16959170
Cited by
-
Mammal assemblage composition predicts global patterns in emerging infectious disease risk.Glob Chang Biol. 2021 Oct;27(20):4995-5007. doi: 10.1111/gcb.15784. Epub 2021 Jul 22. Glob Chang Biol. 2021. PMID: 34214237 Free PMC article.
-
Mathematical modeling of within-host Zika virus dynamics.Immunol Rev. 2018 Sep;285(1):81-96. doi: 10.1111/imr.12687. Immunol Rev. 2018. PMID: 30129207 Free PMC article. Review.
-
The Promise of a Pointillist Perspective for Comparative Immunology.Physiology (Bethesda). 2024 Nov 1;39(6):0. doi: 10.1152/physiol.00012.2024. Epub 2024 May 29. Physiology (Bethesda). 2024. PMID: 38808754 Review.
-
Large-scale disease patterns explained by climatic seasonality and host traits.Oecologia. 2020 Dec;194(4):723-733. doi: 10.1007/s00442-020-04782-x. Epub 2020 Oct 24. Oecologia. 2020. PMID: 33098457
-
The impacts of body mass on immune cell concentrations in birds.Proc Biol Sci. 2020 Sep 9;287(1934):20200655. doi: 10.1098/rspb.2020.0655. Epub 2020 Sep 9. Proc Biol Sci. 2020. PMID: 32900319 Free PMC article.
References
-
- Grace D, et al. 2012. Mapping of poverty and likely zoonoses hotspots. Report to the department for international development.
-
- Kleiber M. 1947. Body size and metabolic rate. Physiol. Rev. 27, 511–541. - PubMed
-
- Kleiber M. 1932. Body size and metabolism. Hilgardia: J. Agric. Sci. 6, 315–353. ( 10.3733/hilg.v06n11p315) - DOI
Publication types
MeSH terms
Grants and funding
LinkOut - more resources
Full Text Sources
Other Literature Sources
