. 2018 Jan 15;29(2):209-219.
doi: 10.1091/mbc.E17-05-0271. Epub 2017 Nov 15.

Gfap and Osmr regulation by BRG1 and STAT3 via interchromosomal gene clustering in astrocytes

Affiliations

Gfap and Osmr regulation by BRG1 and STAT3 via interchromosomal gene clustering in astrocytes

Kenji Ito et al. Mol Biol Cell. .

Abstract

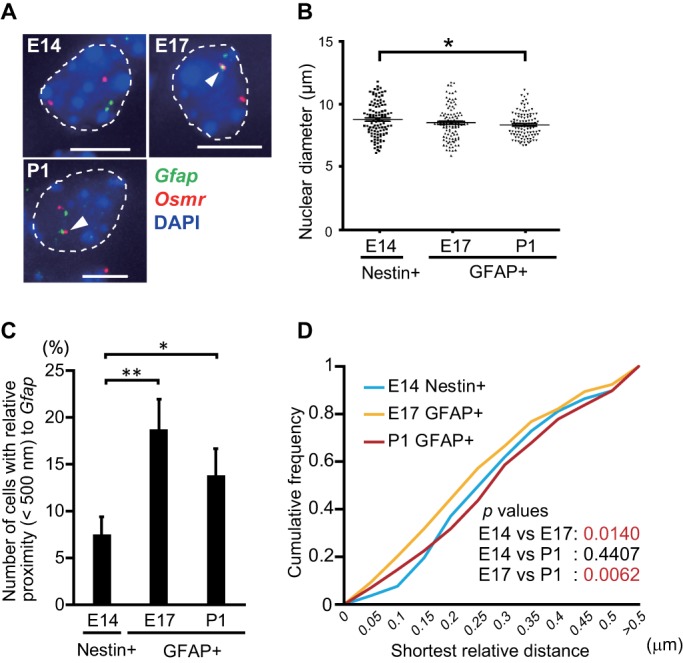
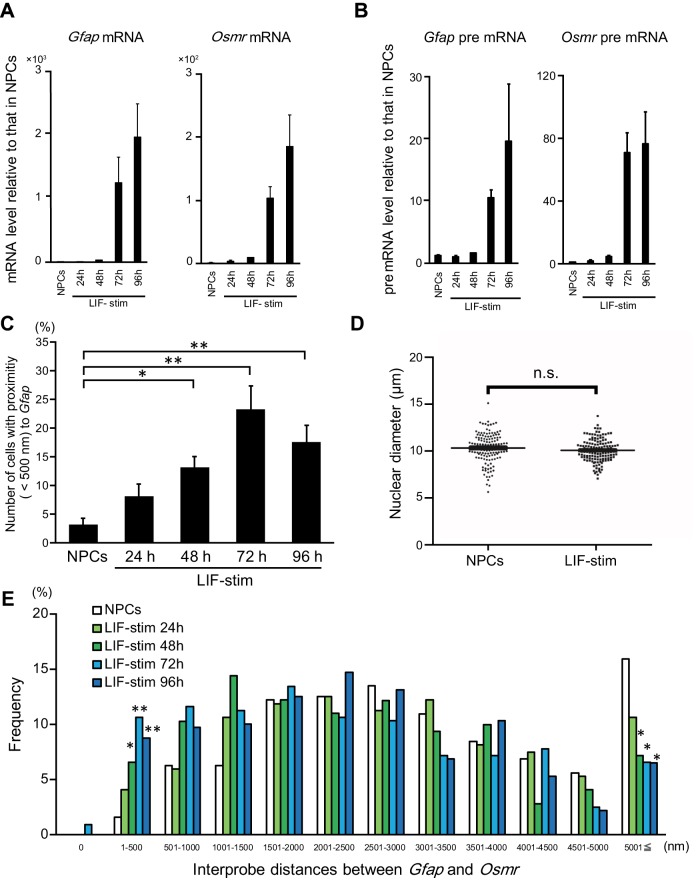
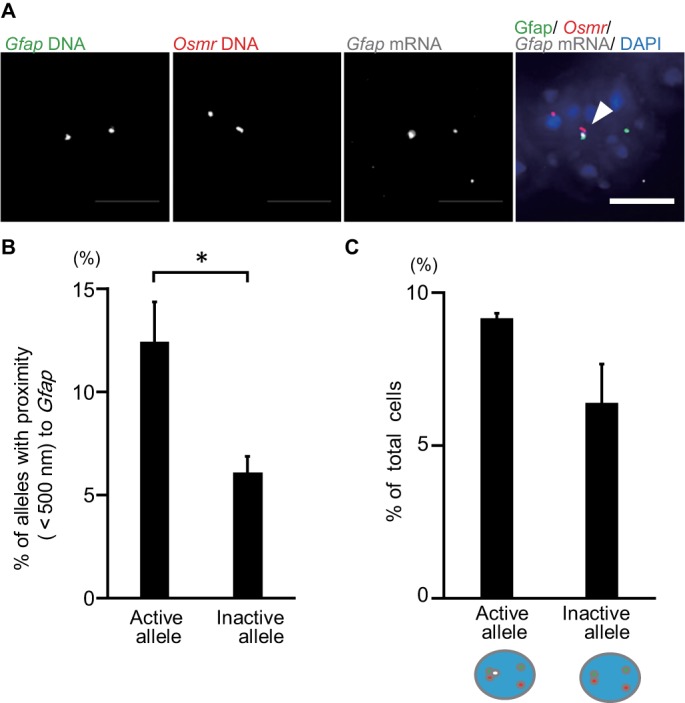
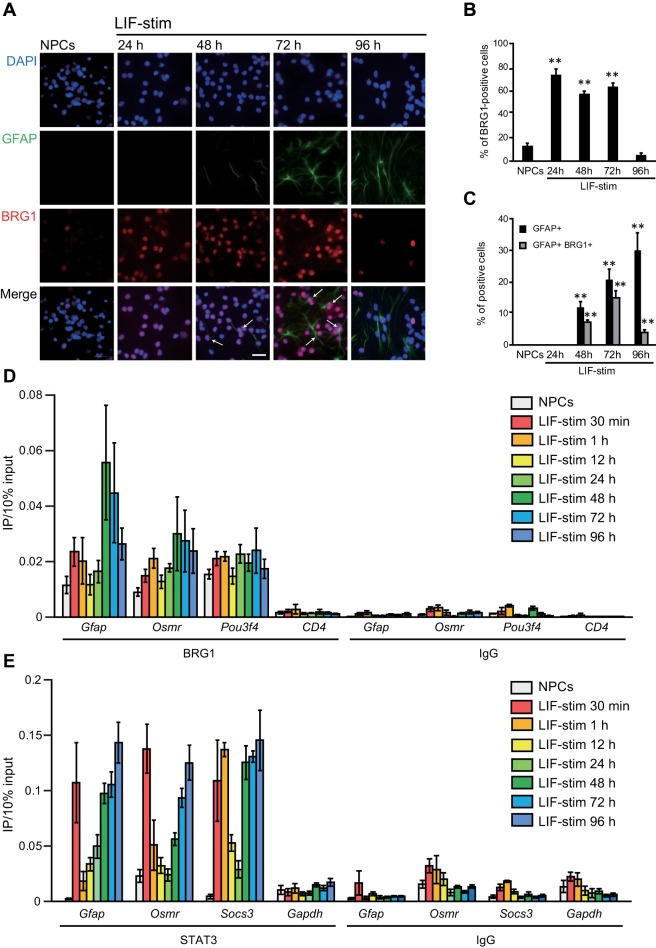
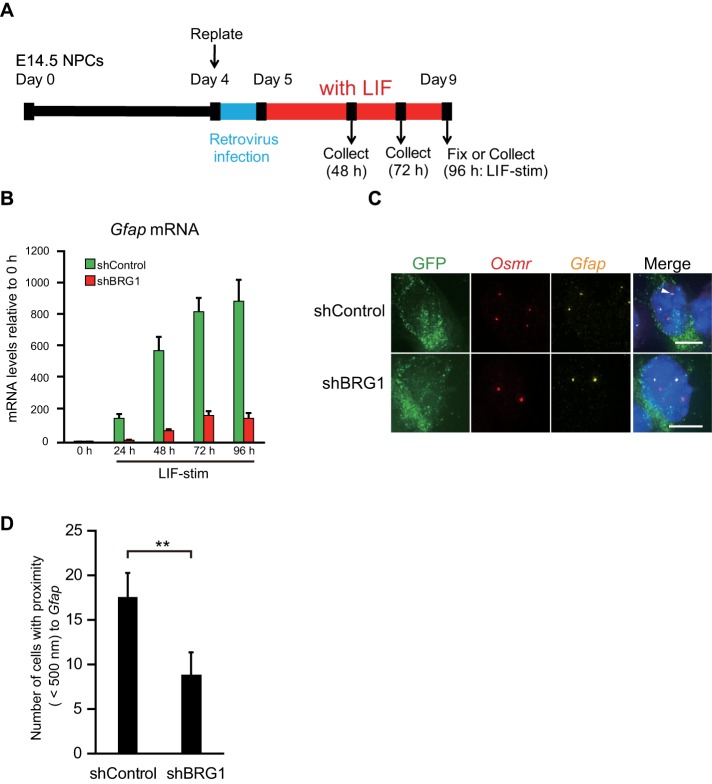
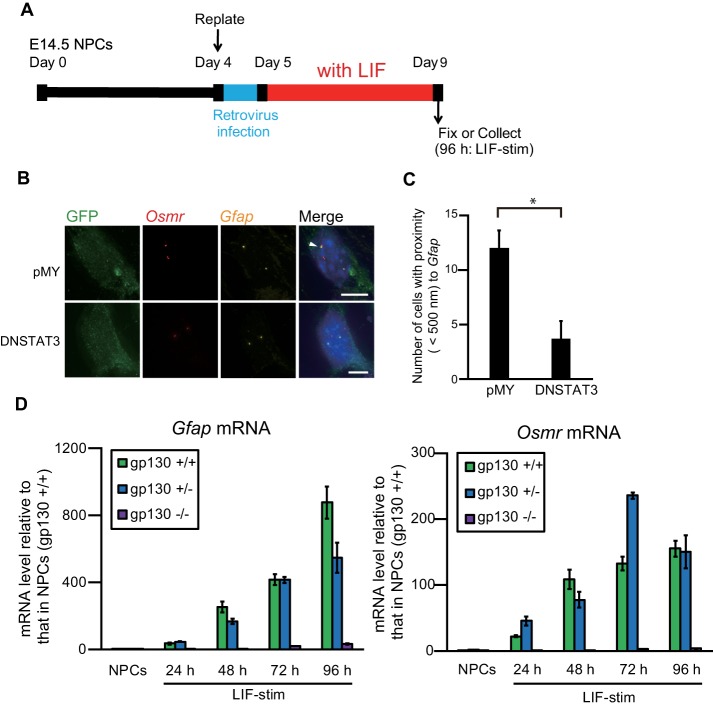
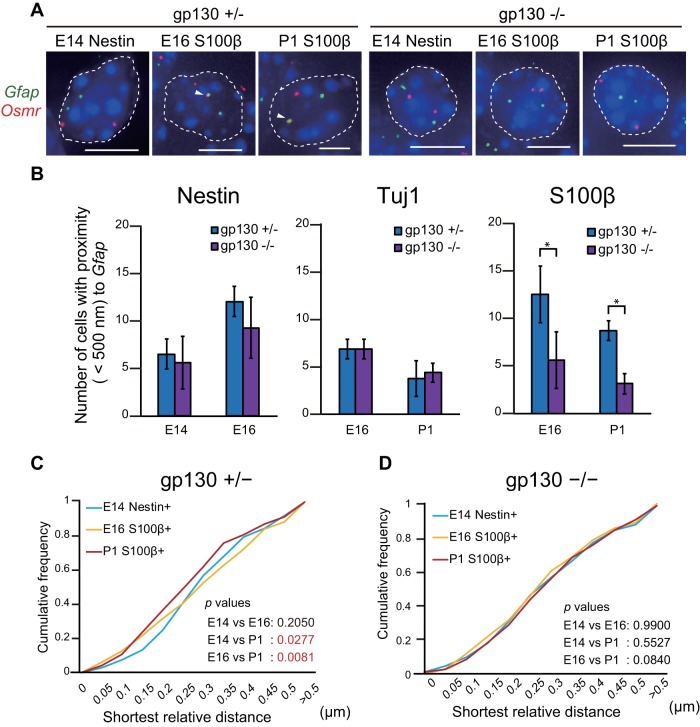
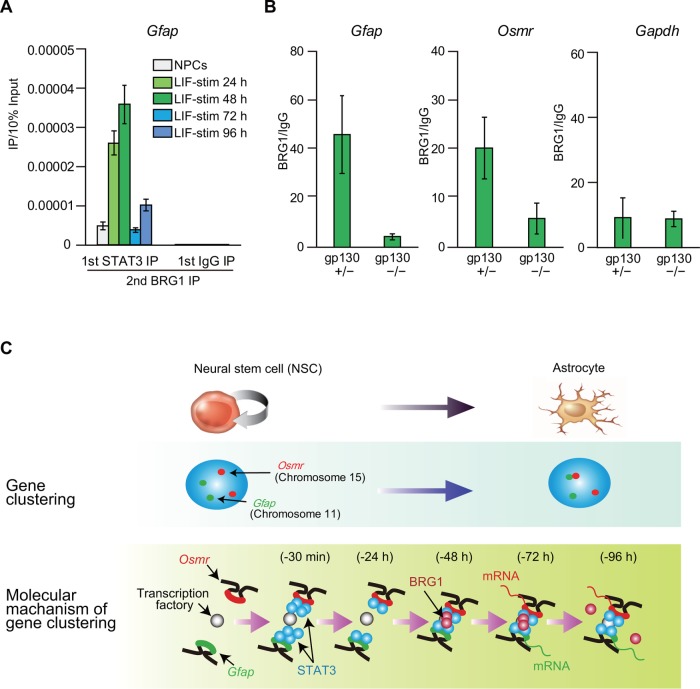
Long-range chromatin interactions between gene loci in the cell nucleus are important for many biological processes, including transcriptional regulation. Previously, we demonstrated that several genes specifically cluster with the astrocyte-specific gene for glial fibrillary acidic protein (Gfap) during astrocyte differentiation; however, the molecular mechanisms for gene clustering remain largely unknown. Here we show that brahma-related gene 1 (BRG1), an ATP-dependent chromatin remodeling factor, and the transcription factor STAT3 are required for Gfap and oncostatin M receptor (Osmr) clustering and enhanced expression through recruitment to STAT3 recognition sequences and that gene clustering occurs prior to transcriptional up-regulation. BRG1 knockdown and JAK-STAT signaling inhibition impaired clustering, leading to transcriptional down-regulation of both genes. BRG1 and STAT3 were recruited to the same Gfap fragment; JAK-STAT signaling inhibition impaired BRG1 recruitment. Our results suggest that BRG1 and STAT3 coordinately regulate gene clustering and up-regulate Gfap and Osmr transcription.


Figures

FIGURE 1:
FIGURE 1:
Confirmation of Gfap and Osmr gene clustering in brain sections. (A) Projected images of double-labeled DNA FISH for Gfap (green) and Osmr (red) in embryonic day (E) 14 Nestin-positive NPCs, E17 and postnatal day (P) 1 GFAP-positive astrocytes. Nuclei were counterstained with 4’,6-diamidino-2-phenylindole (DAPI) (blue). Scale bar = 5 μm. Arrowheads indicate clustering loci. (B) Nuclear diameters of E14 Nestin-positive NPCs and E17 and P1 GFAP-positive astrocytes. Nuclear diameters represent the largest diameter of each nucleus stained with DAPI. The Steel test was performed; *p < 0.05 (n = 108). (C) Clustering frequencies determined using DNA FISH for Gfap and Osmr in E14 Nestin-positive NPCs as well as E17 and P1 GFAP-positive astrocytes. Error bars: means ± SEM with three biological replicates (n = 53–54). *p < 0.05, **p < 0.01 by ANOVA with Fisher’s LSD post hoc test. (D) Cumulative frequencies of interprobe distances between Gfap and Osmr in E14 Nestin-positive NPCs as well as GFAP-positive E17 and P1 astrocytes. The Kolmogorov–Smirnov (K–S) test was performed (n = 320).
FIGURE 2:
FIGURE 2:
Gfap and Osmr gene cluster in prior to the transcriptional activation of both genes. (A, B) Quantitative RT-PCR was performed on mRNA (A) and pre-mRNA (B) of Gfap and Osmr. The expression level of each gene was determined in NPCs alone and stimulated with LIF for the indicated time (LIF-stim). The results were normalized to Gapdh expression. Each graph represents the mean (±SEM) relative amount (compared with NPCs) of at least three experiments. (C) Clustering frequencies of Gfap and Osmr determined using DNA FISH in NPCs alone and stimulated with LIF for the indicated time (LIF-stim). Each graph represents the mean (±SEM) percentage for the number of cells with clustering alleles of at least three experiments. The Dunnett test was performed. *p < 0.05, **p < 0.01 (n = 53–54). (D) Nuclear diameters of NPCs alone and stimulated with LIF for 96 h (LIF-stim). Nuclear diameters represent the largest diameter of each nucleus stained with DAPI. The Steel test was performed (n = 138). (E) Frequencies of interprobe distances between Gfap and Osmr in NPCs; cells were stimulated with LIF for the indicated time (LIF-stim). The Dunnett test was performed for each interprobe distance. *p < 0.05, **p < 0.01.
FIGURE 3:
FIGURE 3:
Gfap and Osmr gene clustering correlates with Gfap transcription in LIF-stimulated cells. (A) Projected images of triple-labeled RNA/DNA FISH in LIF-stimulated cells for Gfap DNA (green), Osmr DNA (red), and Gfap RNA (white). Nuclei were counterstained with DAPI (blue). Scale bar = 5 µm. Arrowhead indicates clustering alleles. (B) Clustering frequencies of Gfap active (transcribed) and inactive (not transcribed) alleles determined using RNA/DNA FISH for LIF-stimulated cells. Data represent the means ± SEM of three biological replicates (n = 72–74 for active alleles and 332–336 for inactive ones). Student’s t test was performed for statistical analysis. *p < 0.05. (C) Phenotypic analysis of cells with single active (transcribed) Gfap. Frequencies of cells with an active or inactive Gfap allele that clustered with Osmr were determined. Data are presented as the means ± SEM of three biological replicates (n = 54–55). Student’s t test was performed.
FIGURE 4:
FIGURE 4:
BRG1 and STAT3 are recruited to STAT3 binding sites (SBS) at Gfap and Osmr loci concurrent with gene clustering. (A) Expression of BRG1 in GFAP-positive cells. NPCs alone and stimulated with LIF for different periods of time (LIF-stim) were stained with an anti-GFAP antibody (green) and an anti-BRG1 antibody (red). Nuclei were counterstained with DAPI (blue). Scale bar = 20 µm. Arrows indicate BRG1/GFAP double-positive cells. (B) The number of BRG1-positive cells in total cells. (C) The number of GFAP-positive and GFAP/BRG1–double positive cells. (B, C) Data are presented as the means ± SEM from three biological replicates (n = 72–211). The Dunnett test was performed. **p < 0.01. (D) ChIP-qPCR for BRG1 at the SBS of Gfap and Osmr and at Pou3f4 (a positive control) and CD4 (a negative control) loci in NPCs alone and stimulated with LIF for different time periods (LIF-stim). Each graph represents the means (±SEM) of at least three experiments. (E) ChIP-qPCR for STAT3 at the SBS of Gfap and Osmr loci and for Socs3 (a positive control) and Gapdh (a negative control) in NPCs stimulated with LIF for different time periods (LIF-stim). Each graph represents the means (±SEM) of at least three experiments.
FIGURE 5:
FIGURE 5:
BRG1 knockdown down-regulates Gfap and Osmr transcription and impairs gene clustering. (A) Scheme of cell culture and virus infection procedures. NPCs isolated from E14.5 mouse telencephalon were cultured and replated on day 4. Subsequently, the cells were infected with retroviruses that expressed EGFP alone (shControl) or EGFP together with shBRG1 and then cultured with LIF (50 ng/ml) for astrocyte differentiation. (B) Quantitative RT-PCR for Gfap mRNA in shControl- or shBRG1-treated NPCs alone or stimulated with LIF for different periods of time (LIF-stim). The results were normalized to Gapdh expression and described as fold induction relative to the levels at 0 h. Each graph represents the mean (±SEM) for the relative amount of NPCs in at least three experiments. (C) Projected images of double-labeled DNA FISH in GFP-positive (green) LIF-stimulated cells for Gfap (yellow) and Osmr (red). Nuclei were counterstained with DAPI (blue). Scale bar = 5 µm. Arrowheads indicate clustering alleles. (D) Clustering frequencies determined for Gfap and Osmr in LIF-stimulated cells expressing shControl or shBRG1. Data are presented as the means ± SEM from three biological replicates (n = 73–127). Student’s t test was performed. **p < 0.01.
FIGURE 6:
FIGURE 6:
Inhibition of JAK-STAT signaling impairs the clustering of Gfap and Osmr and down-regulates their transcription. (A) Scheme of experimental procedures. NPCs isolated from E14.5 mouse telencephalon were cultured and replated on day 4. The cells were infected with retroviruses that express EGFP alone (pMY) or together with DN-STAT3, and then cultured with LIF (50 ng/ml) for 4 d to induce astrocyte differentiation. (B) Projected images of double-labeled DNA FISH for Gfap (yellow) and Osmr (red) in LIF-stimulated cells that were infected with recombinant retroviruses engineered to express EGFP alone (pMY) or together with DN-STAT3. Virus-infected cells were stained with an anti-GFP antibody (green). Nuclei were counterstained with DAPI (blue). Scale bar = 5 μm. Arrowheads indicate clustering alleles. (C) Clustering frequencies determined using DNA FISH for Gfap and Osmr in LIF-stimulated cells that were infected with retroviruses expressing EGFP alone (pMY) or together with DN-STAT3. Data are presented as the means ± SEM from three biological replicates (n = 53–54). Student’s t test was performed. *p < 0.05. (D) Quantitative RT-PCR of Gfap and Osmr mRNA in NPCs derived from gp130 +/+, +/−, and −/− mice, alone and stimulated with LIF for different periods of time (LIF-stim). The results were normalized to Gapdh expression. Each graph represents the means (±SEM) relative to the amounts in NPCs derived from gp130 +/+ mice from at least three experiments.
FIGURE 7:
FIGURE 7:
Gene clustering of Gfap and Osmr is impaired in gp130 −/− mice. (A) Projected images of double-labeled DNA FISH for Gfap (green) and Osmr (red) in E14 Nestin-positive NPCs and in E16 and P1 S100β-positive astrocytes derived from gp130 +/− and −/− mice. Nuclei were counterstained with DAPI (blue). Scale bar = 5 μm. Arrowheads indicate clustering alleles. (B) Clustering frequencies determined using DNA FISH for Gfap and Osmr in E14 Nestin positive NPCs, E16 Nestin-, Tuj1-, and S100β- positive cells and P1 Tuj1- and S100β- positive cells derived from gp130 +/− and −/− mice. Data are presented as the means ± SEM from three biological replicates (n = 53–54). Student’s t test was performed. *p < 0.05. (C, D) Cumulative frequencies of interprobe distances between Gfap and Osmr in cells from gp130 +/− (C) and −/− (D) mice. The Kolmogorov–Smirnov (K–S) test was performed.
FIGURE 8:
FIGURE 8:
JAK-STAT signaling is required for BRG1 recruitment to STAT3 binding sites (SBS) at Gfap and Osmr loci. (A) ChIP- and reChIP-qPCR for STAT3 and BRG1 at the SBS of Gfap in NPCs and cells stimulated with LIF for different periods of time (LIF-stim). Each graph represents the means (±SEM) of at least three experiments. (B) ChIP-qPCR for BRG1 on the SBS of Gfap, Osmr, and Gapdh (negative control) in cells stimulated with LIF for 48 h (LIF-stim 48 h). Each graph represents the means (±SEM) of at least three experiments. (C) Model depicting BRG1 as a mediator of gene clustering of Gfap and Osmr. BRG1 and STAT3 are recruited to the SBS of Gfap and Osmr within 48 h after LIF stimulation concurrent with BRG1- and STAT3-dependent Gfap and Osmr gene clustering. Transcription of both genes is enhanced after gene clustering (at 72–96 h after LIF stimulation).

References

    1. Beatus P, Jhaveri DJ, Walker TL, Lucas PG, Rietze RL, Cooper HM, Morikawa Y, Bartlett PF. Oncostatin M regulates neural precursor activity in the adult brain. Dev Neurobiol. 2011;71:619–633. - PubMed
    1. Core Team R. R: A Language and Environment for Statistical Computing. Vienna: 2013. R Foundation for Statistical Computing.
    1. Cremer T, Cremer M. Chromosome territories. Cold Spring Harb Perspect Biol. 2010;2:a003889. - PMC - PubMed
    1. Croker BA, Krebs DL, Zhang JG, Wormald S, Willson TA, Stanley EG, Robb L, Greenhalgh CJ, Förster I, Clausen BE, et al. SOCS3 negatively regulates IL-6 signaling in vivo. Nat Immunol. 2003;4:540–545. - PubMed
    1. Euskirchen GM, Auerbach RK, Davidov E, Gianoulis TA, Zhong G, Rozowsky J, Bhardwaj N, Gerstein MB, Snyder M. Diverse roles and interactions of the SWI/SNF chromatin remodeling complex revealed using global approaches. PLoS Genet. 2011;7:e1002008. - PMC - PubMed

Publication types