. 2017 Nov 15;8(1):1510.
doi: 10.1038/s41467-017-01771-2.

Unique transcriptome signatures and GM-CSF expression in lymphocytes from patients with spondyloarthritis

Affiliations

Unique transcriptome signatures and GM-CSF expression in lymphocytes from patients with spondyloarthritis

M H Al-Mossawi et al. Nat Commun. .

Abstract

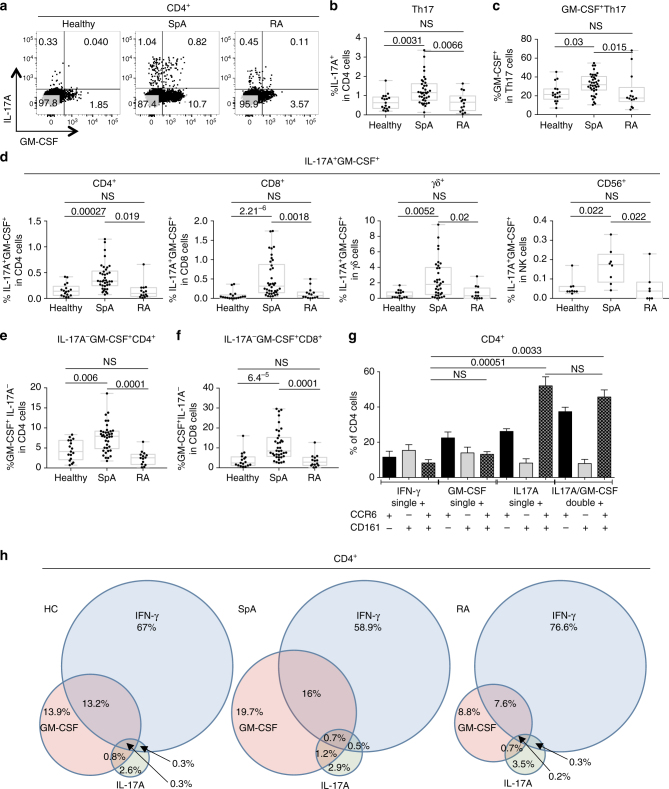
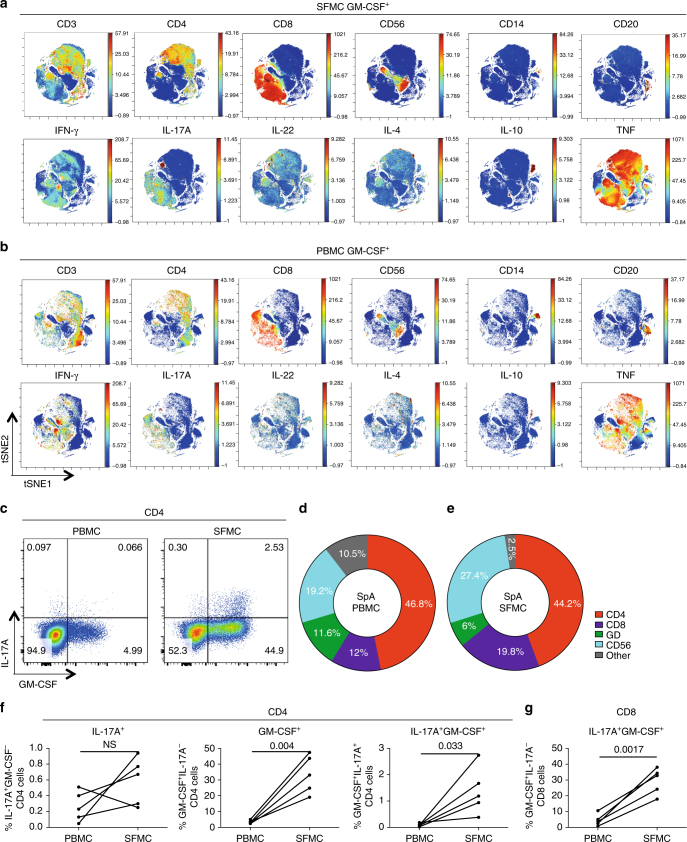
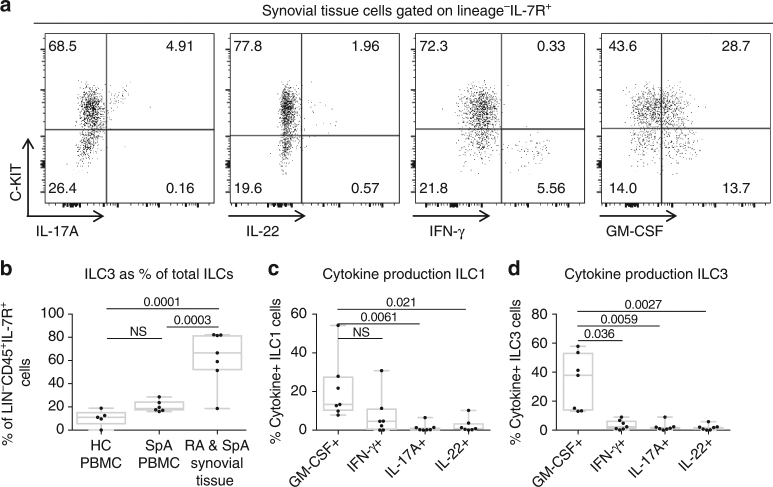
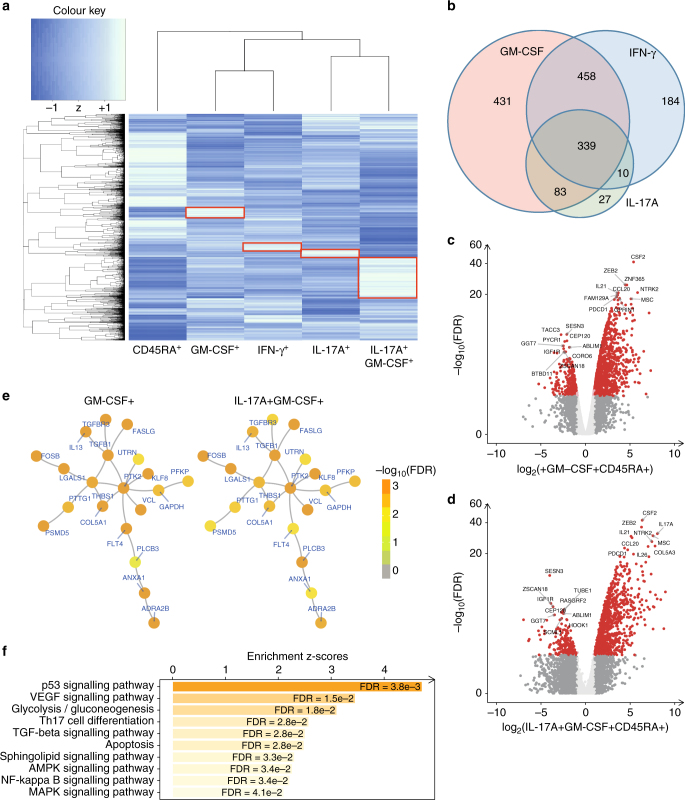
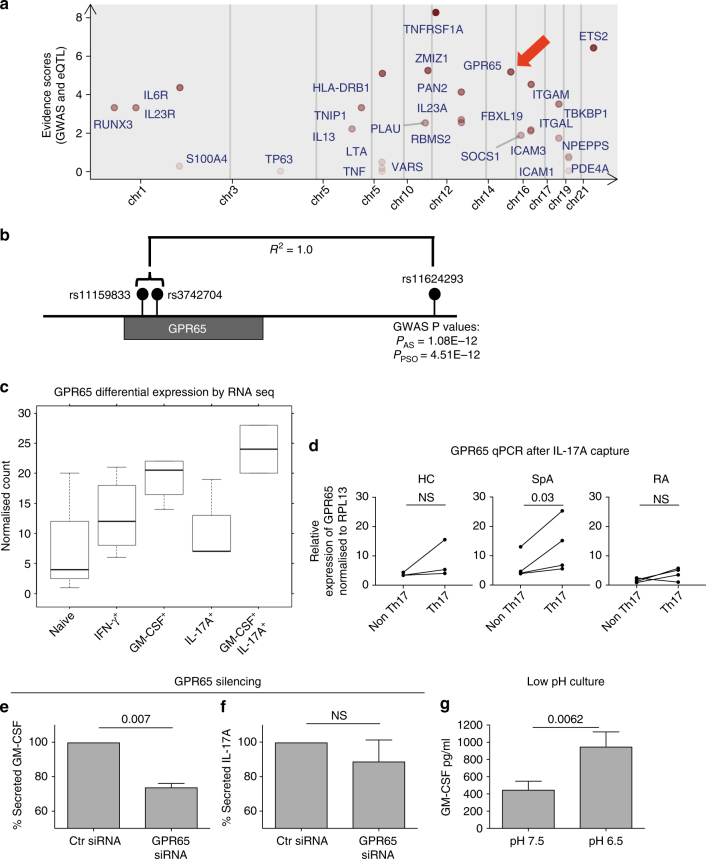
Spondyloarthritis encompasses a group of common inflammatory diseases thought to be driven by IL-17A-secreting type-17 lymphocytes. Here we show increased numbers of GM-CSF-producing CD4 and CD8 lymphocytes in the blood and joints of patients with spondyloarthritis, and increased numbers of IL-17A+GM-CSF+ double-producing CD4, CD8, γδ and NK cells. GM-CSF production in CD4 T cells occurs both independently and in combination with classical Th1 and Th17 cytokines. Type 3 innate lymphoid cells producing predominantly GM-CSF are expanded in synovial tissues from patients with spondyloarthritis. GM-CSF+CD4+ cells, isolated using a triple cytokine capture approach, have a specific transcriptional signature. Both GM-CSF+ and IL-17A+GM-CSF+ double-producing CD4 T cells express increased levels of GPR65, a proton-sensing receptor associated with spondyloarthritis in genome-wide association studies and pathogenicity in murine inflammatory disease models. Silencing GPR65 in primary CD4 T cells reduces GM-CSF production. GM-CSF and GPR65 may thus serve as targets for therapeutic intervention of spondyloarthritis.


Conflict of interest statement

Paul Bowness has received research grant funding from the Merck Research Laboratories and Celgene. Mohammad Hussein Al-Mossawi has received unrestricted research grant funding from UCB Pharma. The remaining authors declare no competing financial interests.

Figures

Fig. 1
Fig. 1
GM-CSF+ cells are expanded in multiple lymphoid populations in spondyloarthritis. a Representative flow cytometry plots comparing intracellular staining for IL-17A and GM-CSF in healthy, spondyloarthritis (SpA) and rheumatoid arthritis (RA) PBMCs (gated on live CD3+CD4+ lymphocytes). b Total IL-17A+CD4+ cells (Th17) and c percentage of Th17 cells also expressing GM-CSF for healthy (n = 17) SpA (n = 38) and RA (n = 14). d Percentage of IL-17A+GM-CSF+ cells within the CD4+, CD8+, γδ+ and CD56+ gates in the same cohort of patients and controls. Percentage of GM-CSF+ CD4 e and CD8 f independently of IL-17A in the cohort of patients and controls. g CD161 and CCR6 expression was measured by flow cytometry on single positive IL-17A+, IFN-γ+, GM-CSF+ and IL-17A+GM-CSF+ double-positive CD4 cells (n = 8; mean + SEM shown, Friedman’s test). h Venn diagram of mean PBMC cytokine data from healthy donors, SpA and RA patients derived by Boolean gating, the percentage of each cytokine is represented in relation to the total number of cytokine-producing CD4 T cells. All statistical analysis (except g, Friedman’s) determined by Kruskal–Wallis test with p-values calculated using Dunn’s multiple comparisons test
Fig. 2
Fig. 2
Spondyloarthritis synovial fluid T cells are highly enriched for GM-CSF production ex vivo. CyTOF viSNE clustering analysis of all live GM-CSF+ events from paired ex vivo spondyloarthritis (SpA) synovial fluid mononuclear cells (SFMC) a and PBMC b. In the top panels of a and b CD3, CD4, CD8, CD56, CD14 and CD20 are shown as the third parameter. The bottom panels of a and b show IFN-γ, IL-17A, IL-22, IL-4, IL-10 and TNF as third parameters. c Representative flow cytometry plots, gated on CD4 cells, from matched SpA patient PBMCs and SFMC showing IL-17A and GM-CSF production. de Flow cytometry data of 5 matched ex vivo SpA PBMC d and SFMC e samples showing the mean cellular components of the GM-CSF pool. f Paired PBMC and SFMC flow cytometry data gated on CD4 showing the percentage of IL-17A+GM-CSF, IL-17AGM-CSF+ and IL-17A+GM-CSF+ in SpA patients (n = 5, paired t-test). g Paired PBMC and SFMC flow cytometry data showing the percentage of IL-17A+GM-CSF+ CD8 cells in SpA (n = 5, paired t-test)
Fig. 3
Fig. 3
Type 3 innate lymphoid cells (ILC3) are enriched in inflammatory arthritis synovial tissue and produce GM-CSF. a Representative flow cytometry plots showing cytokine production by synovial ILCs. Lineage negative (Gating strategy shown in Supplementary Fig. 5. Lineage cocktail: CD3, CD5, CD8, CD11b, CD11c, CD19, CD20, CD34, TCR-γδ, CRTH2) CD45+ cells were then gated on IL-7R expression. ILC1 subset defined as LinCD45+IL-7R+C-KIT and ILC3 subset defined as LinCD45+IL-7R+C-KIT+. b Relative enrichment of ILC3s as percentage of total ILCs in inflammatory arthritis synovial tissue explant cultures (n = 7), compared to ex vivo PBMCs from axial spondyloarthritis (SpA) (n = 6) and healthy control (n = 5) (ANOVA). c, d. Intracellular expression of GM-CSF IFN-γ, IL-17A and IL-22 in stimulated ILCs plotted against C-KIT expression to identify ILC1 and ILC3 cytokine production (n = 7 patients with inflammatory arthritis, 4 SpA/3 RA) (Friedman’s multiple comparison test)
Fig. 4
Fig. 4
GM-CSF positive CD4 cells have a distinct transcriptional profile. RNA was extracted from 5 FACS sorted CD3+CD4+ T-cell populations: CD45RA+ (IFN-γIL-17AGM-CSF), GM-CSF+, IFN-γ+, IL-17A+ and IL-17A+GM-CSF+ double-positive, of triple cytokine capture-labelled activated PBMCs from four healthy donors, pooled and sequenced on the Illumina HiSeq 4000 platform. a Unbiased hierarchical gene clustering analysis of the 5 sorted subsets from the combined data set of 4 donors. b Differential gene expression profiles of GM-CSF+, IL-17A+ and IFN-γ+ single-positive cell subsets (compared to CD45RA+ population) showing unique and shared expressed genes. False discovery rate (FDR) for this analysis was set at <0.05%. c, d Volcano plots of differential gene expression. Fold changes in the x-axis versus FDR in the y-axis are plotted for genes identified in GM-CSF+ cells c and IL-17A+GM- CSF+ cells d, Coloured in red are genes with FDR <5% and at least twofold changes (upregulated or downregulated). Highlighted in text are the most significant genes (upregulated or downregulated). e Visualisation of the gene network identified by integrative analysis of RNA sequencing data with gene interaction data. This network contains 20 genes that were commonly regulated in both IL-17A+GM-CSF+ cells and GM-CSF+ cells. Illustrations are using the same network layout with nodes colour-coded according to cell-specific FDR in the GM-CSF+ population (left) and the IL-17A+GM-CSF+ population (right). f Bar plots of enriched pathways for 391 genes commonly regulated in IL-17A+GM-CSF+ and GM-CSF+ cells. Displayed in the x-axis are enrichment z-scores with FDR labelled inside. Supplementary Table 3 shows the listing of gene members per pathway
Fig. 5
Fig. 5
GPR65 expression is associated with GM-CSF+ and GM-CSF+IL-17A+ CD4 T cells. a Evidence score analysis showing top ranking genes identified in GM-CSF+ and IL-17A+GM-CSF+ cells. Red arrow shows GPR65 b Location of AS and psoriasis-associated GPR65 single-nucleotide polymorphism rs11624293 in relation the two SNPs identified in eQTL data sets. c Expression of GPR65 in RNA sequencing analysis of the 5 sorted primary T cell populations isolated by multiple cytokine capture (p = 0.012, ANOVA). d Expression of GPR65 by qPCR in ex vivo IL-17A and IL-17A+ cytokine captured CD4 T cells from patients and controls (paired t-tests). GM-CSF e and IL-17A f measured by ELISA in culture supernatants of primary human CD4 cells in the presence GPR65 siRNA or control siRNA (mean + SEM, paired t-tests). g GM-CSF was measured by ELISA in culture supernatants of primary human CD4 cells cultured at a pH of 7.5 or in media acidified to a pH of 6.5 for 72 h (mean + SEM, paired t-tests)

References

    1. Dougados M, Baeten D. Spondyloarthritis. Lancet. 2011;377:2127–2137. doi: 10.1016/S0140-6736(11)60071-8. - DOI - PubMed
    1. Reveille JD. Epidemiology of spondyloarthritis in North America. Am. J. Med. Sci. 2011;341:284–286. doi: 10.1097/MAJ.0b013e31820f8c99. - DOI - PMC - PubMed
    1. Braun J, et al. Prevalence of spondylarthropathies in HLA-B27 positive and negative blood donors. Arthritis Rheum. 1998;41:58–67. doi: 10.1002/1529-0131(199801)41:1<58::AID-ART8>3.0.CO;2-G. - DOI - PubMed
    1. Brandt J, et al. Long-term efficacy and safety of etanercept after readministration in patients with active ankylosing spondylitis. Rheumatology. 2005;44:342–348. doi: 10.1093/rheumatology/keh475. - DOI - PubMed
    1. van der Heijde D, et al. Efficacy and safety of adalimumab in patients with ankylosing spondylitis: results of a multicenter, randomized, double-blind, placebo-controlled trial. Arthritis Rheum. 2006;54:2136–2146. doi: 10.1002/art.21913. - DOI - PubMed

Publication types

Substances