. 2017 Nov 16;8(1):1541.
doi: 10.1038/s41467-017-01642-w.

A comprehensive structural, biochemical and biological profiling of the human NUDIX hydrolase family

Affiliations

A comprehensive structural, biochemical and biological profiling of the human NUDIX hydrolase family

Jordi Carreras-Puigvert et al. Nat Commun. .

Abstract

The NUDIX enzymes are involved in cellular metabolism and homeostasis, as well as mRNA processing. Although highly conserved throughout all organisms, their biological roles and biochemical redundancies remain largely unclear. To address this, we globally resolve their individual properties and inter-relationships. We purify 18 of the human NUDIX proteins and screen 52 substrates, providing a substrate redundancy map. Using crystal structures, we generate sequence alignment analyses revealing four major structural classes. To a certain extent, their substrate preference redundancies correlate with structural classes, thus linking structure and activity relationships. To elucidate interdependence among the NUDIX hydrolases, we pairwise deplete them generating an epistatic interaction map, evaluate cell cycle perturbations upon knockdown in normal and cancer cells, and analyse their protein and mRNA expression in normal and cancer tissues. Using a novel FUSION algorithm, we integrate all data creating a comprehensive NUDIX enzyme profile map, which will prove fundamental to understanding their biological functionality.


Conflict of interest statement

The authors declare no competing financial interests.

Figures
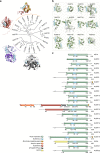
Fig. 1
Fig. 1
Sequence and structural analysis of human NUDIX hydrolases. a Consensus phylogenetic tree of full length Human NUDIX proteins with posterior probabilities of each branch provided. Distinct groups with known structures are overlaid for comparison. MTH1 (purple) and NUDT15 (light blue); NUDT5 (gray) and NUDT14 (black); NUDT21 (pink) and NUDT2 (brown); NUDT6 (firebrick red), NUDT3 (yellow), and NUDT10 (orange). b Known structures of human NUDIX proteins modeled in cartoon format with the NUDIX box colored in blue, NUDIX fold domain in green, and remaining structure colored in gray. c Graphical representation of the different domains within the human NUDIX hydrolases
Fig. 2
Fig. 2
Substrate activity of the human NUDIX hydrolases. a Activity of 18 human NUDIX hydrolases toward 52 substrates. Activity is represented in a heat map in which the absorbance at 630 nm normalized to untreated controls (this is, without BIP or PPase) is shown. The data represented correspond to the high enzyme concentration condition (200 nM); for the complete data set, see Supplementary Fig. 2d. b Hierarchical clustering heat map of the NUDIX hydrolases that displayed activity toward the corresponding substrates. Three distinct clusters appear containing MTH1, NUDT15, and NUDT18; NUDT5, NUDT9, NUDT12, and NUDT14; and NUDT2 and NUDT3. c NUDT2 and NUDT3 activity toward their corresponding substrates. d NUDT5, NUDT9, NUDT12, and NUDT14 activity toward their corresponding substrates. e MTH1, NUDT15, and NUDT18 activity toward their corresponding substrates. f Cluster co-assignment matrix comparing sequence similarity grouping and substrate activity clustering
Fig. 3
Fig. 3
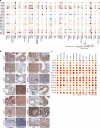
mRNA and protein expression across normal and cancer tissues of the human NUDIX hydrolases. a mRNA expression in cancer tissues from the TCGA compared with the non-cancer counterparts from the HPA. Red and blue indicate up- or downregulation, and light brown and gray indicate normal tissue of origin or non-significance in cancer tissue, respectively. A complete list of the cancer types acronyms can be found in the Supplementary Table 3. b Immunohistochemical stainings of normal tissues. a, b MTH1 shows cytoplasmic staining of glandular cells in small intestine and cytoplasmic/nuclear staining seminiferous ducts and testicular Leydig cells. c, d NUDT5 shows cytoplasmic staining hepatocytes and sperms in testis. e, f NUDT7 shows cytoplasmic staining of hepatocytes and testicular Leydig cells. g, h NUDT8 shows patchy cytoplasmic staining of skeletal muscle and parathyroid glandular cells. i, j NUDT9 shows cytoplasmic staining of glandular cells in the fallopian tube and staining of neurons and neuropil in cortex. k, l NUDT12 shows cytoplasmic/membranous staining of tubules and glomeruli in kidney and staining of glial cells in cortex. m, n NUDT13 shows nuclear staining in a subset of squamous epithelial cells in esophagus and in germinal center cells of the lymph node. o, p NUDT14 shows cytoplasmic and nuclear staining of tubules and glomeruli in kidney and cytoplasmic staining of epidermis (enriched in the basal layer). q, r NUDT15 shows cytoplasmic/membranous staining of neurons and neuropil in cortex and cytoplasmic/membranous staining of glandular cells in epididymis. s, t NUDT16 shows nucleolar staining of glandular cells in small intestine and white pulp cells in spleen. u, v NUDT17 shows cytoplasmic/membranous staining of glandular breast cells and of seminiferous ducts in testis. w, x NUDT18 shows cytoplasmic and nuclear staining of basal cells of the prostate and in epidermis. y, z NUDT22 shows cytoplasmic staining of exocrine (strong) and endocrine (weak) pancreatic cells, and cytoplasmic/membranous staining of glandular cells of the stomach. Aa, Ab DCP2 shows cytoplasmic staining in epidermis, and in stromal and glandular cells of the small intestine. c Qualitative assessment graphical representation of the human NUDIX protein expression. The inner circles represent the expression in the normal tissue corresponding to its cancer counterpart. The outer circle represents the percentage of cancers that displayed either not detectable, low, medium, or high protein expression
Fig. 4
Fig. 4
Cell viability and cell cycle profiles upon single NUDIX depletion. a Survival of CCD841, A549, MCF7, and SW480 cells upon single depletion of the NUDIX enzymes using a pool of four siRNA sequences. The survival was measured by resazurin and normalised to the non-targeting siRNA control. b Cell cycle profiles upon single NUDIX knockdown in CCD841, A549, MCF7, and SW480 cells. The histograms were obtained by measuring the integrated intensity of the DNA counterstained with Hoechst and the signal was then processed using PopulationProfiler as described in
Fig. 5
Fig. 5
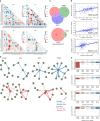
Survival genetic interactions between NUDIX genes. a Genetic interactions between NUDIX genes in the four cell lines, CCD841, and cancer cell lines A549, MCF7, and SW480. A genetic interaction was assigned to pairs of genes based on deviation of cell viability of the double knockdown from cell viability of the double knockdown that would be expected if the genes were not interacting. The expected viability was determined with a multiplicative null function. The interaction maps include negative (or aggravating) interactions, as well as positive (or alleviating interactions). Alleviating interactions, shown in blue, suggest that certain NUDIX product operate in concert or in series within the same pathway. b Statistically significant genetic interactions between NUDIX genes in the four cell lines, CCD841, and cancer cell lines A549, MCF7, and SW480 are visualized using networks. For each gene pair, the genetic interaction was assessed by using a two-tailed Z-test α = 0.1 (dotted line and solid line) or α = 0.05 (solid line only). Shown are genetic interactions whose values are significantly larger (indicating alleviating interaction) or significantly smaller (indicating aggravating interaction) than values in the 90% (dotted line and solid line), or 95% (solid line only) of interaction density in the respective cell line. c The overlap of significant genetic interactions from b (α = 0.05) is shown using Venn diagrams. The size of each circle in the diagram is proportional to the number of significant genetic interactions in the respective cell line. d Scatter plot indicating the correlation between each epistasis scores corresponding to each cell line, Spearman’s correlation indicates high similarity. e Box plots comparing log2 mRNA expression in cancer vs normal tissues, and epistasis score. Five epistasis score bins were used to classify the NUDIX genetic interactions. The list of each NUDIX interaction can be found in Supplementary Data 1
Fig. 6
Fig. 6
Cell cycle genetic interactions between NUDIX genes. a Cell cycle-based interactions between NUDIX genes in the A549 cell line. The interaction maps visualize interactions determined based on the fraction of pairwise siRNA-depleted cells in each cell cycle phase. Shown is one interaction map per cell cycle phase. In each map, an interaction score was assigned to a pair of genes based on the difference between the observed cell fraction of the double knockdown and the expected cell fraction of the double knockdown. The expected cell fraction was determined using a multiplicative null model estimating the cell fraction of a double knockdown that would be expected if the genes were not interacting. The interaction maps include negative (or aggravating) interactions in brown, as well as positive (or alleviating) interactions in green. Alleviating interactions suggest that certain NUDIX product operate in concert or in series within the same pathway. b Statistically significant cell-cycle-based interactions between NUDIX genes in the A549 cell line are visualized using circular networks. The panel shows one network for each cell cycle phase. For each gene pair, the interaction was assessed by using a two-tailed Z-test (α = 0.1). Edges in each network represent interactions whose values are significantly larger (indicating alleviating interaction) in cyan or significantly smaller (indicating aggravating interaction) in brown, than values in the 90% of interaction probability density. The interactions were selected independently and separately for each cell cycle phase in the A549 cell line. The width of network edges stands for statistical significance. c Bar charts indicating the increase in % of cells in SubG0/G1 (<2 N) phase when NUDT5 and NUDT8, as well as NUDT5 and DCP2 are co-depleted. d Bar chart indicating the decrease in % of cells in G1 (2 N) phase when NUDT1 and NUDT12 are co-depleted. The % of cells in each cell cycle phase were obtained by measuring the integrated intensity of the DNA counterstained with Hoechst, the signal was then processed using PopulationProfiler, as previously described
Fig. 7
Fig. 7
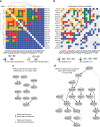
Probabilistic scoring of epistatic relationships from genetic interaction data and gene network inference. a Gene–gene relationships estimated from A549 cell viability data. b Gene–gene relationships in A549 viability data that are different from those in CCD841 viability data. c Gene network inferred based on gene-gene relationships in CCD841. d Gene network inferred based on gene–gene relationships that are conserved across A549, SW480, and MCF7. Probabilities of the estimated relationships are provided in Supplementary Fig. 6
Fig. 8
Fig. 8
Clustering of the human NUDIX family. Integrative analysis of 27 data sets from public data repositories, such as TCGA and the HPA, as well as experimental data (Supplementary Fig. 6). a Detailed hierarchy of NUDIX clusters represented with a dendrogram and a heat map. Shown are distances between vector representations of NUDIX enzymes. b Integrative clustering analysis of the NUDIX enzymes. Enzymes in the same cluster are linked with undirected edges in the network, colored based on the epistasis score. The substrate activity data is added to the same network, relating clusters of NUDIX enzymes. c, d Effect of siRNA-mediated knockdowns of NUDT5 and NUDT9 on the mRNA expression levels of the interrogated NUDIX genes in A549 and MCF7 cells. e Cluster of NUDT4, NUDT5, NUDT6, NUDT7, NUDT8, and NUDT9, which is the largest identified by the integrated analysis. f Similarities between members of the interrogated cluster reveal internal structure of the cluster. Darker color indicates greater similarity. g, h When integrating 11 data sets that were related in A549 cell line, NUDT4, NUDT5, and NUDT6 were clustered together, but placed in a different cluster than NUDT7, NUDT8, and NUDT9. Heat map showing similarity of vector representations of the enzymes, whereby these representations were derived from the model of 11 data sets describing A549 data. i, j Similar to g, h, but in this case 10 data sets originated from MCF7 cells were considered for the clustering

Similar articles

Cited by

References

    1. Bessman MJ, Frick DN, O’Handley SF. The MutT proteins or “Nudix” hydrolases, a family of versatile, widely distributed, “housecleaning” enzymes. J. Biol. Chem. 1996;271:25059–25062. doi: 10.1074/jbc.271.41.25059. - DOI - PubMed
    1. McLennan AG. The MutT motif family of nucleotide phosphohydrolases in man and human pathogens (review) Int. J. Mol. Med. 1999;4:79–89. - PubMed
    1. Sakumi K, et al. Cloning and expression of cDNA for a human enzyme that hydrolyzes 8-oxo-dGTP, a mutagenic substrate for DNA synthesis. J. Biol. Chem. 1993;268:23524–23530. - PubMed
    1. Fujikawa K, et al. The oxidized forms of dATP are substrates for the human MutT homologue, the hMTH1 protein. J. Biol. Chem. 1999;274:18201–18205. doi: 10.1074/jbc.274.26.18201. - DOI - PubMed
    1. Furuichi M, et al. Genomic structure and chromosome location of the human mutT homologue gene MTH1 encoding 8-oxo-dGTPase for prevention of A:T to C:G transversion. Genomics. 1994;24:485–490. doi: 10.1006/geno.1994.1657. - DOI - PubMed

Publication types

Substances