. 2017 Nov 15;7(1):15676.
doi: 10.1038/s41598-017-14623-2.

Using a quantitative quadruple immunofluorescent assay to diagnose isolated mitochondrial Complex I deficiency

Affiliations

Using a quantitative quadruple immunofluorescent assay to diagnose isolated mitochondrial Complex I deficiency

Syeda T Ahmed et al. Sci Rep. .

Abstract

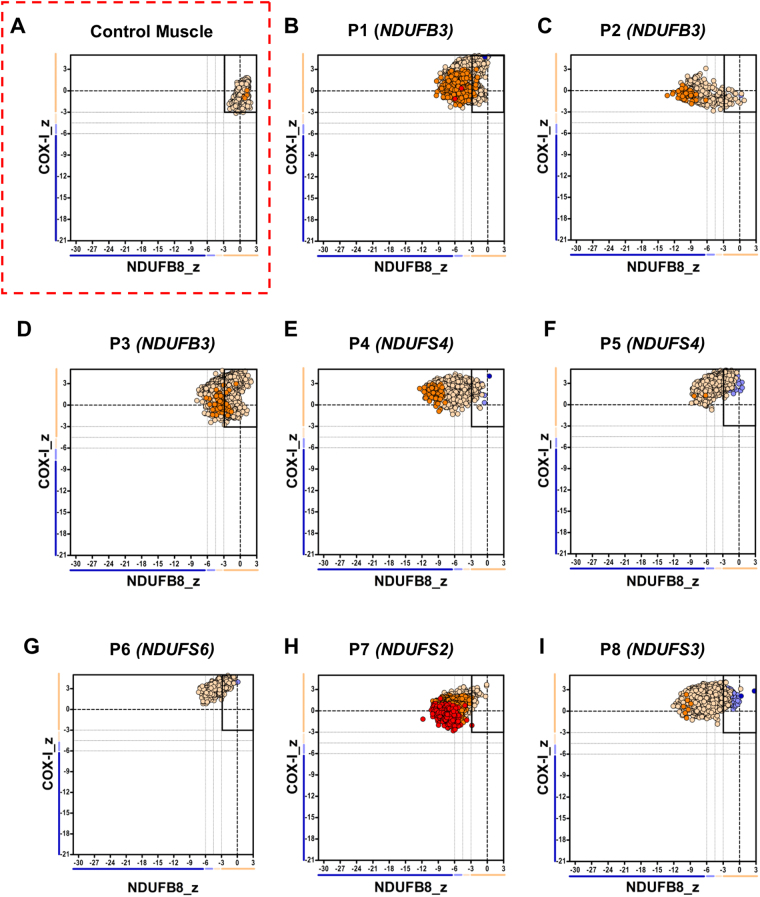
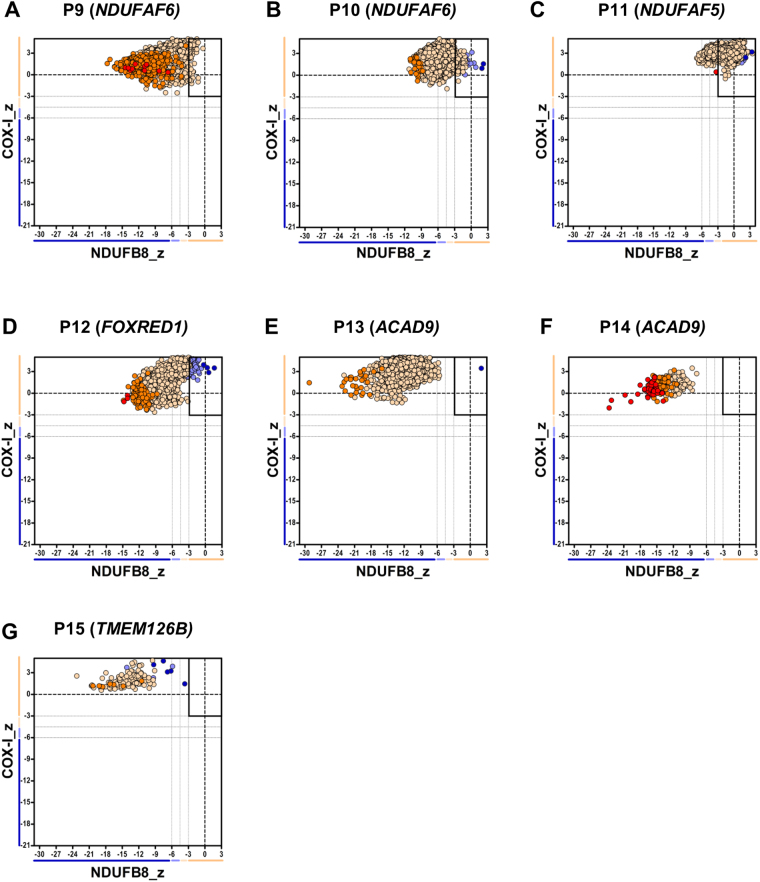
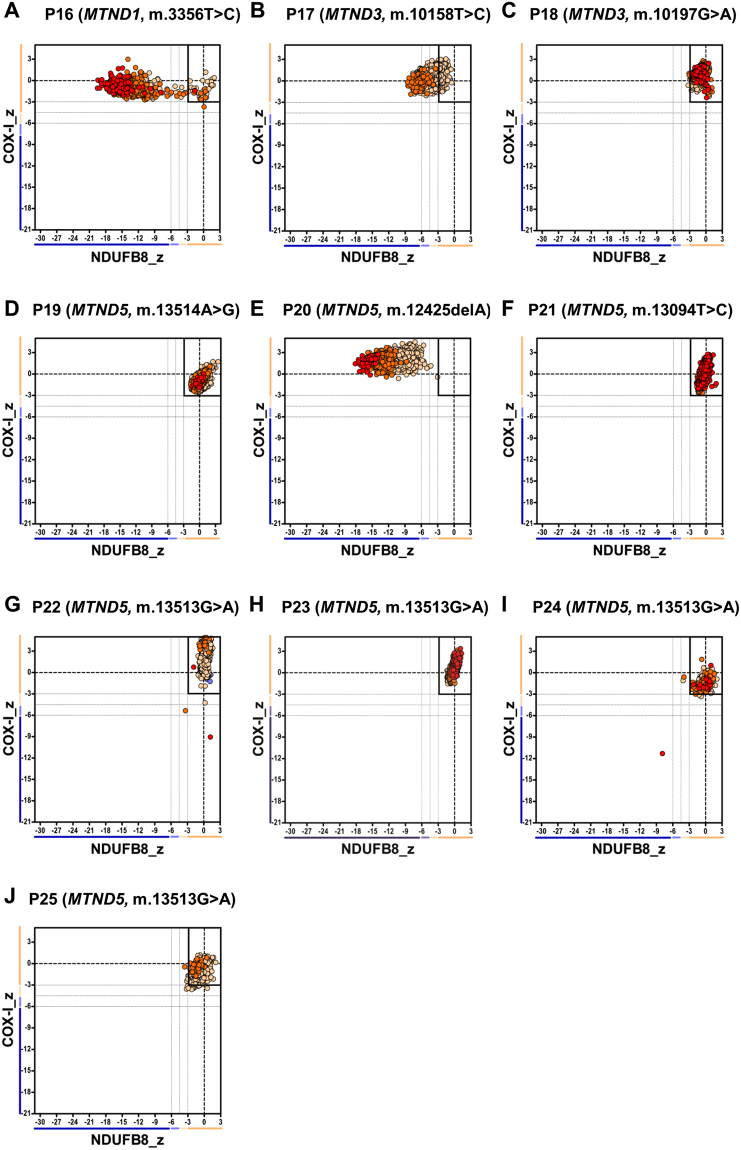
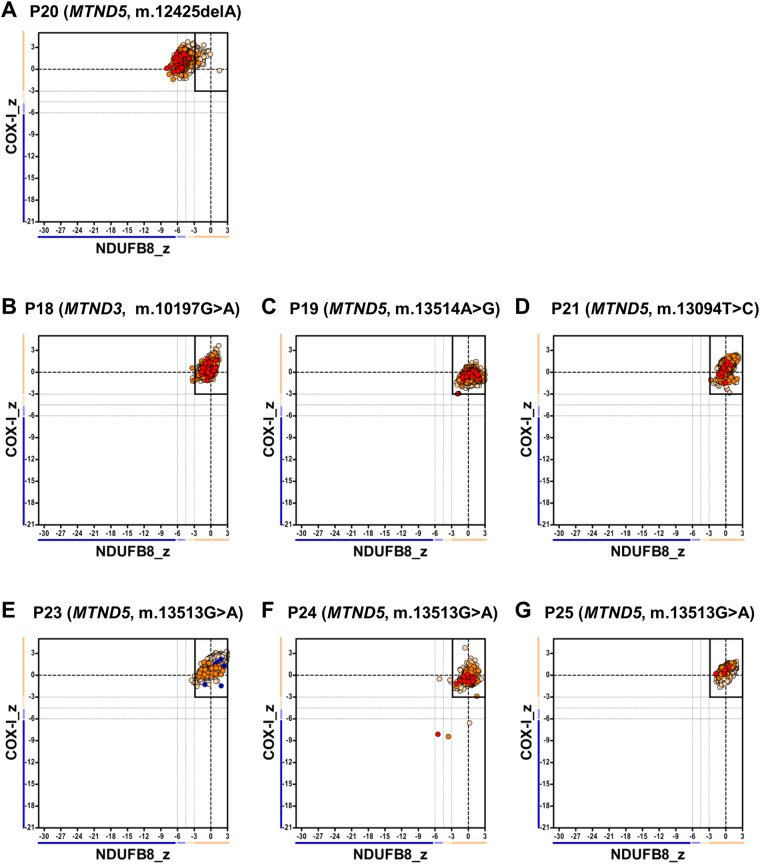
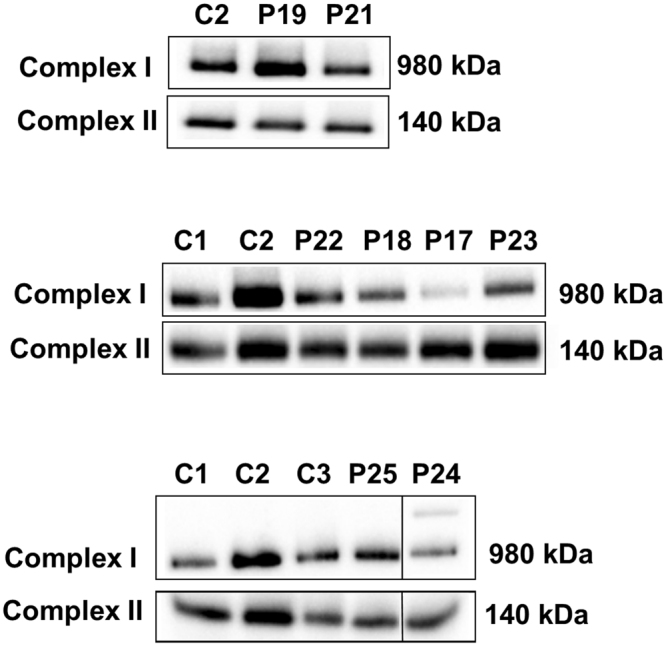
Isolated Complex I (CI) deficiency is the most commonly observed mitochondrial respiratory chain biochemical defect, affecting the largest OXPHOS component. CI is genetically heterogeneous; pathogenic variants affect one of 38 nuclear-encoded subunits, 7 mitochondrial DNA (mtDNA)-encoded subunits or 14 known CI assembly factors. The laboratory diagnosis relies on the spectrophotometric assay of enzyme activity in mitochondrially-enriched tissue homogenates, requiring at least 50 mg skeletal muscle, as there is no reliable histochemical method for assessing CI activity directly in tissue cryosections. We have assessed a validated quadruple immunofluorescent OXPHOS (IHC) assay to detect CI deficiency in the diagnostic setting, using 10 µm transverse muscle sections from 25 patients with genetically-proven pathogenic CI variants. We observed loss of NDUFB8 immunoreactivity in all patients with mutations affecting nuclear-encoding structural subunits and assembly factors, whilst only 3 of the 10 patients with mutations affecting mtDNA-encoded structural subunits showed loss of NDUFB8, confirmed by BN-PAGE analysis of CI assembly and IHC using an alternative, commercially-available CI (NDUFS3) antibody. The IHC assay has clear diagnostic potential to identify patients with a CI defect of Mendelian origins, whilst highlighting the necessity of complete mitochondrial genome sequencing in the diagnostic work-up of patients with suspected mitochondrial disease.


Conflict of interest statement

The authors declare that they have no competing interests.

Figures

Figure 1
Figure 1
Mitochondrial respiratory chain expression profile linking complex I, complex IV and porin levels in patients with isolated Complex I deficiency caused by defects in nuclear-encoded Complex I subunits. Graphs show complex I and complex IV expression profile from (A) Normal adult control and patients with (B–D) homozygous c.64T>C, p.(Trp22Arg) NDUFB3 variant, P1–n = 4372 fibres analysed, P2–n = 559, P3–n = 13422 (E) compound heterozygous NDUFS4 variant, P4, n = 5964 (F) Homozygous exon 3 and 4 deletion in NDUFS4, P5, n = 4683 (G) homozygous NDUFS6 variant, P6, n = 880 (H) Homozygous NDUFS2 variant, P7, n = 5337 (I) Homozygous NDUFS3 variant, P8, n = 7154. Each dot represents a single muscle fibre, colour co-ordinated according to its mitochondrial mass: very low – blue, low – light blue, normal – beige, high – orange, very high - red. Black dashed lines represent the SD limits for the classification of the fibres. Lines adjacent to X and Y axis represent the levels of NDUFB8 and COX-1: beige: normal (<−3), light beige: intermediate (+) (−3 to −4.5), light blue: intermediate (−) (−4.5 to −6) and blue: deficient (>−6). Bold dashed lines indicate the mean expression level of normal fibres.
Figure 2
Figure 2
Mitochondrial respiratory chain expression profile linking complex I, complex IV and porin levels in patients with isolated Complex I deficiency caused by defects in nuclear-encoded Complex I assembly factors. Graphs show complex I and complex IV expression profile from patients with (A) Compound heterozygous NDUFAF6 variant, P9, n = 9504 fibres analysed (B) Homozygous NDUFAF6 variant, P10, n = 5355 (C) Compound heterozygous NDUFAF5 variant, P11, n = 7352 (D) Compound heterozygous FOXRED1 variant, P12, n = 1708 (E–F) Compound heterozygous ACAD9 variant, (E = P13, n = 2684, F = P14, n = 239) (G) Homozygous TMEM126B variant, P15, n = 131. Each dot represents a single muscle fibre, colour co-ordinated according to its mitochondrial mass: very low – blue, low - light blue, normal – beige, high – orange, very high - red. Black dashed lines represent the SD limits for the classification of the fibres. Lines adjacent to X and Y axis represent the levels of NDUFB8 and COX-1: beige: normal (<−3), light beige: intermediate (+) (−3 to -4.5), light blue: intermediate (−) (−4.5 to −6) and blue: deficient (>−6). Bold dashed lines indicate the mean expression level of normal fibres.
Figure 3
Figure 3
Mitochondrial respiratory chain expression profile linking complex I (NDUFB8), complex IV and porin levels in patients with isolated Complex I deficiency caused by defects in mtDNA-encoded Complex I subunits. Graphs show complex I and complex IV expression profile from patients with (A) m.3356T>C MTND1 variant, P16, n = 696 fibres analysed (B) m.10158T>C MTND3 variant, P17, n = 5842 (C) m.10197G>A MTND3 variant, P18, n = 7302 (D) m.13514A>G MTND5 variant, P19, n = 2427 (E) m.12425delA MTND5 variant, P20, n = 3795 (F) m.13094T>C MTND5 variant, P21, n = 1311 (G) m.13513G>A MTND5 variant, P22, n = 3341 (H) m.13513G>A MTND5 variant, P23, n = 2730 (I) m.13513G>A MTND5 variant, P24, n = 675 (J) m.13513G>A MTND5 variant, P25, n = 785. Each dot represents a single muscle fibre, colour co-ordinated according to its mitochondrial mass: very low – blue, low - light blue, normal – beige, high – orange, very high - red. Black dashed lines represent the SD limits for the classification of the fibres. Lines adjacent to X and Y axis represent the levels of NDUFB8 and COX-1: beige: normal (<−3), light beige: intermediate (+) (−3 to −4.5), light blue: intermediate (−) (−4.5 to −6) and blue: deficient (>−6). Bold dashed lines indicate the mean expression level of normal fibres.
Figure 4
Figure 4
Mitochondrial respiratory chain expression profile linking complex I (NDUFS3), complex IV and porin levels in patients with Isolated complex I deficiency caused by defects in mtDNA-encoded Complex I subunits. Graphs show complex I and complex IV expression profile from patients with (A) m.12425delA MTND5 variant, P20, n = 5536 fibres analysed (B) m.10197G>A MTND3 variant, P18, n = 6645 (C) m.13514A>G MTND5 variant, P19, n = 2730 (D) m.13094T>C MTND5 variant, P21, n = 3979 (E) m.13513G>A MTND5 variant, P23, n = 10009 (F) m.13513G>A MTND5 variant, P24, n = 575 (G) m.13513G>A MTND5 variant, P25, n = 1168. Each dot represents a single muscle fibre, colour co-ordinated according to its mitochondrial mass: very low – blue, low - light blue, normal – beige, high – orange, very high - red. Black dashed lines represent the SD limits for the classification of the fibres. Lines adjacent to X and Y axis represent the levels of NDUFB8 and COX-1: beige: normal (<−3), light beige: intermediate (+) (−3 to −4.5), light blue: intermediate (−) (−4.5 to −6) and blue: deficient (>−6). Bold dashed lines indicate the mean expression level of normal fibres.
Figure 5
Figure 5
Analysis of Complex I assembly by BN-PAGE. Complex I assembly profiles were analysed using one dimensional blue native polyacrylamide gel electrophoresis (BN-PAGE) (4-16% gradient). Analysis showed a decrease in fully-assembled CI in patients P17, P18, P23 and P24, whilst normal assembly is seen in patients P19, P21, P22 and P25. Complex II was used a loading control. Both OXPHOS complexes were detected by immunoblotting using subunit specific antibodies – NDUFB8 (Complex I) and SDHA (complex II). The original, full length blots are included in the Supplementary Information File (Supplementary Fig. S6).

Similar articles

Cited by

References

    1. Swalwell H, et al. Respiratory chain complex I deficiency caused by mitochondrial DNA mutations. European Journal of Human Genetics. 2011;19:769–775. doi: 10.1038/ejhg.2011.18. - DOI - PMC - PubMed
    1. Zhu J, Vinothkumar KR, Hirst J. Structure of mammalian respiratory complex. I.Nature. 2016;536:354–358. doi: 10.1038/nature19095. - DOI - PMC - PubMed
    1. Mimaki M, Wang X, McKenzie M, Thorburn DR, Ryan MT. Understanding mitochondrial complex I assembly in health and disease. Biochimica et Biophysica Acta (BBA) - Bioenergetics. 2012;1817:851–862. doi: 10.1016/j.bbabio.2011.08.010. - DOI - PubMed
    1. Sánchez-Caballero L, Guerrero-Castillo S, Nijtmans L. Unraveling the complexity of mitochondrial complex I assembly: A dynamic process. Biochimica et Biophysica Acta (BBA) - Bioenergetics. 2016;1857:980–990. doi: 10.1016/j.bbabio.2016.03.031. - DOI - PubMed
    1. Guerrero-Castillo S, et al. The Assembly Pathway of Mitochondrial Respiratory Chain Complex I. Cell metabolism. 2017;25:128–139. doi: 10.1016/j.cmet.2016.09.002. - DOI - PubMed

MeSH terms

Supplementary concepts